
Older Americans
2016
Key Indicators of Well-Being

Federal Interagency Forum on Aging-Related Statistics
e Federal Interagency Forum on Aging-Related Statistics (Forum) was founded in 1986 to foster
collaboration among Federal agencies that produce or use statistical data on the older population. Forum
agencies as of June 2016 are listed below.
Copyright information: All material appearing in this report is in the public domain and may be reproduced or copied without permission; citation
as to source, however, is appreciated. Recommended citation: Federal Interagency Forum on Aging-Related Statistics. Older Americans 2016: Key
Indicators of Well-Being. Federal Interagency Forum on Aging-Related Statistics. Washington, DC: U.S. Government Printing Oce. August 2016.
Report availability: Single copies of this report are available at no charge through the National Center for Health Statistics while supplies last. Requests
may be sent to the Information Dissemination Sta, National Center for Health Statistics, 3311 Toledo Road, Room 5412, Hyattsville, MD 20782.
Copies may also be ordered by calling 1-866-441-NCHS (6247) or by e-mailing nchsquer[email protected]. is report is also available on the World Wide
Web at http://www.agingstats.gov.
Consumer Product Safety Commission
http://www.cpsc.gov
Department of Commerce
U.S. Census Bureau
http://www.census.gov
Department of Health and Human Services
Administration for Community Living
http://www.acl.gov
Agency for Healthcare Research and Quality
http://www.ahrq.gov
Centers for Medicare and Medicaid Services
http://www.cms.gov
National Center for Health Statistics
http://www.cdc.gov/nchs
National Institute on Aging
http://www.nia.nih.gov
Oce of the Assistant Secretary for Planning and
Evaluation
http://aspe.hhs.gov
Substance Abuse and Mental Health Services
Administration
http://www.samhsa.gov
Department of Housing and Urban
Development
http://www.hud.gov
Department of Labor
Bureau of Labor Statistics
http://www.bls.gov
Employee Benets Security Administration
http://www.dol.gov/ebsa
Department of Veterans Aairs
http://www.va.gov
Environmental Protection Agency
http://www3.epa.gov/
Oce of Management and Budget
Oce of Statistical and Science Policy
http://www.whitehouse.gov/omb/inforeg_statpolicy
Social Security Administration
Oce of Research, Evaluation, and Statistics
http://www.ssa.gov

Older Americans 2016
Key Indicators of Well-Being


iii
Foreword
Older Americans (those age 65 and over) are a vibrant
and growing part of our Nation. ey also experience
unique challenges to their economic well-being, health,
and independence. To inform decisions regarding the
support and well-being of older Americans, robust
statistics reecting these experiences are needed. Although
many Federal agencies provide statistics on aspects of
older Americans’ lives, it can be dicult to t the pieces
together into a comprehensive representation. us, it has
become increasingly important for policymakers and the
general public to have an accessible, easy-to-understand
portrait of how older Americans fare.
Older Americans 2016: Key Indicators of Well-Being
(Older Americans 2016) provides a comprehensive,
easy-to-understand picture of our older population. It
is the seventh such chartbook prepared by the Federal
Interagency Forum on Aging-Related Statistics (Forum).
Readers will nd here an accessible compendium of
indicators drawn from the most reliable ocial statistics.
Indicators are categorized into six broad groups:
Population, Economics, Health Status, Health Risks and
Behaviors, Health Care, and Environment.
e Forum’s recent review of the Older Americans
chartbook resulted in the addition of several new
indicators particularly relevant to many of the challenges
currently facing older Americans. Among these additions
are an indicator describing the changing demographics of
Social Security beneciaries and an indicator describing
transportation access for older Americans. Indicators have
also been added to describe dementia rates (including
Alzheimer’s disease rates, among the non-nursing home
population) as well as to examine the number of older
Americans receiving long-term care by dierent types
of providers. Finally, the Supplemental Poverty Measure
(SPM) for Americans age 65 and over has been added.
eSPM extends the ocial poverty measure by taking
into account many government programs designed to
assist low-income families that are not included in the
ocial poverty measure.
Although Federal agencies currently collect and report
substantial information on the population age 65 and
over, other important gaps in our knowledge remain.
In Older Americans 2012, the Forum identied six such
areas where more data are needed: informal caregiving,
residential care, elder abuse, functioning and disability,
mental health and cognitive functioning, pension
measures, and end-of-life issues. In Older Americans 2016,
we provide updated information on the data availability
for these specic areas, in addition to a special feature on
informal caregiving.
We continue to appreciate users’ requests for greater detail
for many existing indicators. We also extend an invitation
to all of our readers and partners to let us know what else
we can do to make our reports more accessible and useful.
Please send any comments to [email protected].
e Older Americans reports reect the Forum’s
commitment to advancing our understanding of where
older Americans stand today and what challenges they
may face tomorrow. I congratulate the Forum agencies
for joining together to present the American people with
such valuable tools for understanding the well-being of the
older population. Last, but not least, none of this work
would be possible without the continued cooperation of
millions of American citizens who willingly provide the
data that are summarized and analyzed by sta in the
Federal agencies for the American people.
Katherine K. Wallman
Chief Statistician
Oce of Management and Budget

iv
Acknowledgments
Older Americans 2016: Key Indicators of Well-Being is a
report of the Federal Interagency Forum on Aging-Related
Statistics (Forum). is report was prepared by the Forum’s
planning committee and reviewed by the Forum’s principal
members, which include Vicki Gottlich and Robert
Hornyak (retired), Administration for Community Living
(ACL); Steven B. Cohen, Agency for Healthcare Research
and Quality (AHRQ); Dorinda Allard, Bureau of Labor
Statistics (BLS); Karen Humes and Roberto Ramirez, U.S.
Census Bureau; Debra Reed-Gillette, Centers for Medicare
& Medicaid Services (CMS); Kathleen Stralka, U.S.
Consumer Product Safety Commission (CPSC); Lynn
Ross, Department of Housing and Urban Development
(HUD); Joseph Piacentini and Anja Decressin, Employee
Benets Security Administration (EBSA); Kathy Sykes,
Environmental Protection Agency (EPA); Charles Rothwell
and Jennifer Madans, National Center for Health Statistics
(NCHS); John Haaga and John Phillips, National Institute
on Aging (NIA); Ruth Katz and William Marton, Oce
of the Assistant Secretary for Planning and Evaluation
(ASPE), Department of Health and Human Services;
Katherine K. Wallman, Oce of Management and Budget
(OMB); Daryl Kade, Substance Abuse and Mental Health
Services Administration (SAMHSA); Howard Iams, Social
Security Administration (SSA); and Dat Tran and Richard
Allman, Department of Veterans Aairs (VA).
e Forum’s planning committee and contributing sta
members include Forum Sta Director, Traci Cook; Susan
Jenkins and Kristen Robinson, ACL; David Kashihara
AHRQ; Emy Sok, BLS; Amy Symens Smith and Wan He,
U.S. Census Bureau; Kathleen Stralka, CPSC; Katherine
Giuriceo and Lisa Mirel, CMS; Meena Bavan, HUD;
Allan Beckmann and Lynn Shniper, EBSA; Kathy Sykes,
EPA; Julie Dawson Weeks and Ellen Kramarow, NCHS;
John Phillips, and Prisca Fall, NIA; Helen Zayac Lamont,
ASPE; Jennifer Park, OMB; Beth Han, and Jennifer
Solomon, SAMHSA; Howard Iams and Brad Trenkamp,
SSA; Hazel Hiza, USDA; and Carolyn Stoesen,VA.
In addition to the 16 agencies of the Forum, the
Department of Agriculture (USDA) was invited to
contribute to this report. e Forum greatly appreciates
the eorts of Hazel Hiza and TusaRebecca Schap, Center
for Nutrition Policy and Promotion, USDA, in providing
valuable information from their agency. Other sta
members of Federal agencies who provided data and
assistance include Jennifer Klocinski, ACL; Rachel Krantz-
Kent and Georey Paulin, BLS; William Dean, Maria
Diacogiannis, Deborah Kidd, Chris McCormick, Maggie
Murgolo, Joseph Regan, and Laura Saron, CMS; Ellen
Baldridge, David Mintz, and Rhonda ompson, EPA;
Carolyn Lynch, HUD; Elizabeth Arias, Robin Cohen,
Nazik Elgaddal, Ginny Freid, Lauren Harris-Kojetin,
Cynthia L. Ogden, Eunice Park-Lee, and Manisha
Sengupta, NCHS; Vicky Cahan, NIA; Lynn Fisher, SSA;
and Peter Ahn and Tom Garin, VA.
e Forum is also indebted to the people outside the
Federal government who contributed to this chartbook:
Gwen Fisher, Cathy Liebowitz, and David Weir, University
of Michigan; and Xianfen Li, Harris Corporation.
Member agencies of the Forum provided funds and
valuable sta time to produce this report. NCHS and
its contractor, American Institutes for Research (AIR),
facilitated the production, printing, and dissemination
of this report. Melissa Diliberti, Ashley Roberts, Katie
Mallory, Susan Armstrong, and Kathryn Low managed
the report’s production process and designed the layout;
Richard Devens, First XV Communications, provided
consultation and editing services.

v
About This Report
Introduction
Older Americans 2016: Key Indicators of Well-Being (Older
Americans 2016) is the seventh in a series of reports by the
Federal Interagency Forum on Aging-Related Statistics
(Forum) describing the overall condition of the U.S.
population age 65 and over. e reports use data from
over a dozen national data sources to construct broad
indicators of well-being for the older population and to
monitor changes over time. By following these data trends,
the reports make more information available targeted
toward eorts to improving the lives of older Americans.
e Forum periodically conducts a conceptual and
methodological review of report indicators and format
according to an established indicator selection criteria (see
“Selection Criteria for Indicators”). is review ensures
that the report features the most current topics and the
most reliable, accurate, and accessible statistics.
After conducting a conceptual framework and literature
review in preparation for this report, the Forum modied
several existing indicators and added four new indicators:
Social Security Beneciaries, Dementia, Long-Term Care
Providers, and Transportation. e 2016 report also
contains a newly established Environment domain.
is report is intended to stimulate relevant and timely
public discussions, encourage exchanges between the data
and policy communities, and foster improvements in
Federal data collection on older Americans. By examining
a broad range of indicators, researchers, policymakers, and
service providers can better understand the areas of well-
being that are improving for older Americans as well as the
areas that require more attention.
Structure of the Report
By presenting data in a nontechnical, user-friendly format,
Older Americans 2016 complements other more technical
and comprehensive reports from the individual Forum
agencies. e report includes 41 indicators grouped in six
sections: Population, Economics, Health Status, Health
Risks and Behaviors, Health Care, and Environment.
ere is also a special feature this year on Informal
Caregiving.
Each indicator includes
• A paragraph describing the relevance of the indicator to
the well-being of the older population.
• One or more charts that illustrate important aspects of
the data.
• Bulleted data highlights.
e data used in the indicators are presented in tables in
the back of the report. Data source descriptions and a
Glossary are also provided in the back matter.
Selection Criteria for Indicators
e Forum chose these indicators because they meet the
following criteria:
• Easy to understand by a wide range of audiences.
• Based on reliable, nationwide data sponsored, collected,
or disseminated by the Federal government.
• Objectively based on substantial research that connects
the indicator to the well-being of older Americans.
• Balanced so that no single section dominates the
report.
• Measured periodically (but not necessarily annually) so
that they can be updated, making possible, description
of trends over time.
• Representative of large segments of the aging
population, rather than one particular group.
Considerations When Examining the
Indicators
e data in Older Americans 2016 usually describe the
U.S. population age 65 and over. More specic age groups
(e.g., ages 65–74, 75–84, and 85 and over) are reported
whenever possible.
Data availability and analytical relevance may factor
into the determination of the age groups presented in
an indicator. For example, data for the age range 85
and over may not appear in an indicator because small
survey sample sizes have resulted in statistically reliable
data for that age range not being available. On the other
hand, data for the population younger than age 65 are
sometimes included in an indicator if the inclusion allows
for a more comprehensive interpretation of the indicator’s
content. For example, in “Indicator 12: Participation in
Labor Force,” a comparison with a younger population
provided an opportunity for an enhanced interpretation
of labor force trends among people age 65 and over. In
order to show trends in the amount of savings reserved

vi
for retirement by the entire population, data on public
and private retirement assets are included for the total
population in “Indicator 11: Net Worth.”
To standardize the age distribution of the population age
65 and over across years, some estimates have been age
adjusted by multiplying age-specic rates by time-constant
weights. If an indicator has been age adjusted, this will be
stated in the note under the chart(s) as well as under the
corresponding table(s).
e reference population (the base population sampled
at the time of data collection) for each indicator is
labeled under each chart and table and is dened in
the Glossary. Whenever possible, the indicators include
data on the U.S. resident population (both people living
in the community and people living in institutions).
However, many indicators show data only for the civilian
noninstitutionalized population. Because the older
population residing in nursing homes (and other long-
term care institutional settings) is not included in samples
based on the noninstitutionalized population, use caution
when attempting to generalize the ndings from these
data sources to the entire population age 65 and over. is
is especially true for the older age groups. For example,
in 2014, 10 percent of the population age 85 and over
was not included in the civilian noninstitutionalized
population as dened by the U.S. Census Bureau.
100
Percent
80
60
40
20
0
65 and over 65–74 75–84 85 and over
97
99
97
90
Civilian noninstitutionalized population as a percentage of the total resident
population, by age: July 1, 2014.
SOURCE: U.S. Census Bureau, Population Estimates, July 1, 2014.
Survey Years
e reader should be aware that the range of years
presented in each chart varies because data availability is
not uniform across the data sources.
Accuracy of the Estimates
Most estimates in this report are based on a sample of the
population and are therefore subject to sampling error.
Standard tests of statistical signicance have been used
to determine whether dierences between populations
exist at generally accepted levels of condence or whether
they occurred by chance. Unless otherwise noted, only
dierences that are statistically signicant at the 0.05 level
are discussed in the text. To indicate the reliability of the
estimates, standard errors for selected estimates in the
chartbook can be found on the Forum’s website at http://
www.agingstats.gov.
Where possible, data estimates have been obtained from
the true unrounded value of the original data. Data are
rounded to one decimal place in the data tables and are
shown as whole numbers in the report text unless a ner
breakdown is needed to show a signicant dierence
between two estimates that would otherwise round to the
same number. While gures display rounded numbers, the
gures are created using unrounded estimates.
Finally, the data in some indicators may not sum to totals
because of rounding.
Sources of Data
e data used to create the charts are provided in the
tables in the back of the chartbook along with data that
are described in the bullets below each chart. e source
of the data for each indicator is noted below the chart.
Descriptions of the data sources can be found in the back
matter. Additional information about these data sources
and contact information for the agency providing the
data are available on the Forum’s website at http://www.
agingstats.gov.
Data Needs
In Older Americans 2012, the Forum identied six
areas where better data were needed to support research
and policy eorts related to older Americans: informal
caregiving, residential care, elder abuse, functioning
and disability, mental health and cognitive functioning,
pension measures, and end-of-life issues.
Since then, the Federal statistical community and the
Forum have made signicant improvements to enhance
data availability related to these data needs, many of
which are reected in Older Americans 2016. is report
includes a new indicator on dementia using data from the
2011 National Health and Aging Trends Study (NHATS)
as well as a special feature on informal caregiving based
on data from the 2011 National Study of Caregiving
(NSOC). Data from the 2015 NHATS and NSOC will
be available in late 2016. A new indicator on long-term
care providers, with data from the new 2014 National

vii
Study of Long-Term Care Providers, addresses residential
care data needs. e indicator on functional limitations
presents disability prevalence among those 65 and over,
using questions developed by the United Nations-
sponsored Washington Group on Disability Statistics and
collected as part of the National Health Interview Survey.
e report also includes a new indicator on social security
beneciaries. is indicator is based on data from the
Master Beneciary Record (MBR) which are published
annually in the Statistical Supplement to the Social
Security Bulletin.
Other key indicators were identied by the Forum for
inclusion in this year’s report, such as new measures on
oral health, cancer screenings, and transportation. Data
on other topics of continued interest, like end-of-life, have
been covered in other Federal reports.
With continued discussion on measurement issues and the
eect of survey technique on estimates of the incidence
of elder abuse
1
as well as with the number of older adults
with substance use disorders in the U.S. projected to
double by 2020,
2
the Forum continues to identify elder
abuse and substance use disorder as ongoing areas of data
need and will follow up with forthcoming survey ndings.
Mission
e Forum’s mission is to encourage cooperation and
collaboration among Federal agencies in order to improve
the quality and utility of data on the aging population.
e specic goals of the Forum are
• Widening access to information on the aging
population through periodic publications and other
means.
• Promoting communication among data producers,
researchers, and public policymakers.
• Coordinating the development and use of statistical
databases among Federal agencies.
• Identifying information gaps and data inconsistencies.
• Investigating questions of data quality.
• Encouraging cross-national research and data collection
on the aging population.
• Addressing concerns regarding collection, access, and
dissemination of data.
More Information
For more information about Older Americans 2016 or
other Forum activities, contact
Traci Cook
Sta Director
Federal Interagency Forum on Aging-Related Statistics
3311 Toledo Road
Hyattsville, MD 20782
Phone: (301) 458-4082
Fax: (301) 458-4021
E-mail: [email protected]
Website: http://www.agingstats.gov
Older Americans
on the Internet
Additional material can be found at http://www.
agingstats.gov. e website contains
• Data for all of the indicators in Excel spreadsheets
(with standard errors, when available).
• Data source descriptions.
• PowerPoint slides of the charts.
e Forum’s website also provides other Forum
publications, workshop documents, agency contacts,
subject area contact lists for Federal statistics, and
information about the Forum.
Additional Online Resources
Administration for Community Living
A Prole of Older Americans
http://www.aoa.acl.gov/Aging_Statistics/Prole/index.aspx
Aging Integrated Database
http://www.agid.acl.gov/
ACL Program Evaulations and Related Reports
http://www.aoa.acl.gov/program_results/program_
evaluation.aspx
Agency for Healthcare Research and Quality
Research Tools and Data
http://www.ahrq.gov/research/index.html
Bureau of Labor Statistics
Bureau of Labor Statistics Data
http://www.bls.gov/data

viii
U.S. Census Bureau
Age Data
http://www.census.gov/topics/population/age-and-sex.
html
Statistical Abstract of the United States
http://www.census.gov/library/publications/time-series/
statistical_abstracts.html
Longitudinal Employer-Household Dynamics
http://lehd.did.census.gov/led/
Centers for Medicare & Medicaid Services
CMS Research, Statistics, Data, and Systems
http://www.cms.gov/research-statistics-data-and-systems/
research-statistics-data-and-systems.html
Department of Housing and Urban Development
Policy Development and Research Information Services
http://www.huduser.gov
Department of Veterans Aairs
Veteran Data and Information
http://www1.va.gov/vetdata
Employee Benets Security Administration
EBSA’s Research
http://www.dol.gov/ebsa/publications/research.html
Environmental Protection Agency
Information Resources
http://www.epa.gov/healthresearch/aging-and-
sustainability-listserve
National Center for Health Statistics
Longitudinal Studies of Aging
http://www.cdc.gov/nchs/lsoa.htm
Health, United States
http://www.cdc.gov/nchs/hus.htm
Health Indicators Warehouse
http://www.healthindicators.gov/
National Institute on Aging
NIA Centers on the Demography of Aging
http://www.agingcenters.org/
National Archive of Computerized Data on Aging
http://www.icpsr.umich.edu/NACDA
Publicly Available Datasets for Aging-Related Secondary
Analysis
http://www.nia.nih.gov/research/dbsr/publicly-available-
databases-aging-related-secondary-analyses-behavioral-
and-social
Oce of the Assistant Secretary for Planning and
Evaluation, HHS
Oce of Disability, Aging, and Long-Term Care Policy
http://www.aspe.hhs.gov/_/oce_specic/daltcp.cfm
Oce of Management and Budget
Federal Committee on Statistical Methodology
https://fcsm.sites.usa.gov
Social Security Administration
Social Security Administration Statistical Information
http://www.ssa.gov/policy
Substance Abuse and Mental Health Services
Administration
Center for Behavioral Health Statistics and Quality
http://www.samhsa.gov/data
Center for Mental Health Services
http://www.samhsa.gov/about-us/who-we-are/oces-
centers/cmhs
Other Resources
FedStats.gov
https://fedstats.sites.usa.gov

ix
Table of Contents
Foreword ............................................................................................................................................................... iii
Acknowledgements ................................................................................................................................................. iv
About is Report ...................................................................................................................................................v
List of Tables ..........................................................................................................................................................xi
Highlights ...........................................................................................................................................................xvii
POPULATION
Indicator 1: Number of Older Americans ..................................................................................................... 2
Indicator 2: Racial and Ethnic Composition ................................................................................................. 4
Indicator 3: Marital Status ............................................................................................................................ 5
Indicator 4: Educational Attainment ............................................................................................................. 6
Indicator 5: Living Arrangements ................................................................................................................. 8
Indicator 6: Older Veterans ........................................................................................................................... 9
ECONOMICS
Indicator 7: Poverty .................................................................................................................................... 12
Indicator 8: Income .................................................................................................................................... 13
Indicator 9: Sources of Income ................................................................................................................... 14
Indicator 10: Social Security Beneciaries ................................................................................................... 16
Indicator 11: Net Worth ............................................................................................................................. 18
Indicator 12: Participation in Labor Force .................................................................................................. 20
Indicator 13: Housing Problems ................................................................................................................. 22
Indicator 14: Total Expenditures ................................................................................................................. 24
HEALTH STATUS
Indicator 15: Life Expectancy ..................................................................................................................... 26
Indicator 16: Mortality ............................................................................................................................... 27
Indicator 17: Chronic Health Conditions ................................................................................................... 28
Indicator 18: Oral Health ........................................................................................................................... 29
Indicator 19: Respondent-Assessed Health Status ....................................................................................... 30
Indicator 20: Dementia............................................................................................................................... 31
Indicator 21: Depressive Symptoms
............................................................................................................ 32
Indicator 22: Functional Limitations .......................................................................................................... 34
HEALTH RISKS AND BEHAVIORS
Indicator 23: Vaccinations .......................................................................................................................... 38
Indicator 24: Cancer Screenings .................................................................................................................. 39
Indicator 25: Diet Quality .......................................................................................................................... 40
Indicator 26: Physical Activity .................................................................................................................... 41
Indicator 27: Obesity .................................................................................................................................. 42
Indicator 28: Cigarette Smoking ................................................................................................................. 43

x
HEALTH CARE
Indicator 29: Use of Health Care Services ................................................................................................... 46
Indicator 30: Health Care Expenditures ...................................................................................................... 48
Indicator 31: Prescription Drugs ................................................................................................................. 50
Indicator 32: Sources of Health Insurance................................................................................................... 52
Indicator 33: Out-of-Pocket Health Care Expenditures
.............................................................................. 53
Indicator 34: Sources of Payment for Health Care Services ......................................................................... 54
Indicator 35: Veterans’ Health Care ............................................................................................................ 55
Indicator 36: Residential Services ................................................................................................................ 56
Indicator 37: Personal Assistance and Equipment ....................................................................................... 58
Indicator 38: Long-Term Care Providers ..................................................................................................... 60
ENVIRONMENT
Indicator 39: Use of Time ........................................................................................................................... 64
Indicator 40: Air Quality ............................................................................................................................ 66
Indicator 41: Transportation ....................................................................................................................... 68
SPECIAL FEATURE
Informal Caregiving .................................................................................................................................... 69
References ............................................................................................................................................................ 75
Tables ................................................................................................................................................................... 81
Data Sources ...................................................................................................................................................... 159
Glossary ............................................................................................................................................................. 171

xi
List of Tables
Indicator 1: Number of Older Americans
Table 1a. Number of people (in millions) age 65 and over and age 85 and over, selected years, 1900–2014,
and projected years, 2020–2060 ........................................................................................................................... 82
Table 1b. Percentage of people age 65 and over and age 85 and over, selected years, 1900–2014, and
projected years, 2020–2060
.................................................................................................................................. 83
Table 1c. Population of countries or areas with at least 10 percent of their population age 65 and over, 2015....... 84
Table 1d. Percentage of the population age 65 and over, by state, 2014
................................................................ 86
Table 1e. Percentage of the population age 65 and over, by county, 2014 ............................................................. 87
Table 1f. Number and percentage of people age 65 and over and age 85 and over, by sex, 2014 ........................... 87
Indicator 2: Racial and Ethnic Composition
Table 2. Population age 65 and over, by race and Hispanic origin, 2014 and projected 2060................................ 88
Indicator 3: Marital Status
Table 3. Marital status of the population age 65 and over, by age group and sex, 2015 ......................................... 88
Indicator 4: Educational Attainment
Table 4a. Educational attainment of the population age 65 and over, selected years 1965–2015 ........................... 89
Table 4b. Educational attainment of the population age 65 and over, by sex and race and Hispanic origin,
2015..................................................................................................................................................................... 89
Indicator 5: Living Arrangements
Table 5a. Living arrangements of the population age 65 and over, by sex and race and Hispanic origin, 2015
...... 90
Table 5b. Percentage of population age 65 and over living alone, by sex and age group, selected years,
1970–2015........................................................................................................................................................... 90
Indicator 6: Older Veterans
Table 6a. Percentage of population age 65 and over who are veterans, by age group and sex, 2000, 2010,
and 2015, and projected 2020 and 2025
............................................................................................................. 91
Table 6b. Number of veterans age 65 and over, by age group and sex, 2000, 2010, and 2015, and projected
2020 and 2025
..................................................................................................................................................... 91
Indicator 7: Poverty
Table 7a. Poverty rate by age, by ocial poverty measure and Supplemental Poverty Measure, 1966–2014 .......... 92
Table 7b. Percentage of the population age 65 and over living in poverty, by selected characteristics, 2014 ........... 93
Indicator 8: Income
Table 8a. Income distribution of the population age 65 and over, 1974–2014 ...................................................... 94
Table 8b. Median income of householders age 65 and over, in current and in 2014 dollars, 1974–2014 .............. 95
Indicator 9: Sources of Income
Table 9a. Percentage distribution of per capita family income for persons age 65 and over, by income
quintile and source of income, 2014..................................................................................................................... 96
Table 9b. Percentage of people age 55 and over with family income from specied sources, by age group,
2014..................................................................................................................................................................... 97
Table 9c. Number of participants (in thousands) in private pension plans, by type of plan, 1975–2013
............... 98
Table 9d. Number of participants (in thousands) in private dened benet pension plans and percent of
participants retired or separated from employer, 1975–2013
................................................................................ 99

xii
Table 9e. Number of participants (in thousands) in dened benet and dened contribution retirement
plans, by selected type of plan, 1999–2013 ........................................................................................................ 100
Table 9f. Percentage of workers in private sector and state and local government with access to retirement
benets, by type of retirement plan, 2015
.......................................................................................................... 100
Indicator 10: Social Security Beneciaries
Table 10a. Percentage distribution of people who began receiving Social Security benets in 2014, by age
and sex ............................................................................................................................................................... 101
Table 10b. Percentage distribution of female Social Security beneciaries age62 and over, by type of benet
received, selected years 1960–2014
..................................................................................................................... 101
Indicator 11: Net Worth
Table 11a. Median household net worth, in 2013 dollars, by selected characteristics of head of household,
selected years 1983–2013 ................................................................................................................................... 102
Table 11b. Value of household nancial assets held in retirement investment accounts, by selected
characteristics of head of household, 2007 and 2013
.......................................................................................... 103
Table 11c. Amount of funds (in millions of dollars) held in retirement assets, by sector and type of plan,
1975–2014......................................................................................................................................................... 104
Indicator 12: Participation in Labor Force
Table 12. Labor force participation rates (annual averages) of persons age 55 and over, by sex and age group,
1963–2015......................................................................................................................................................... 105
Indicator 13: Housing Problems
Table 13a. Prevalence of housing problems among older-owner/renter households, by type of problem,
selected years,2009–2013
.................................................................................................................................. 107
Table 13b. Prevalence of housing problems among older-member households, by type of problem, selected
years, 2009–2013
............................................................................................................................................... 107
Table 13c. Prevalence of housing problems among all U.S. households except those households with one
or more persons age 65 and over, by type of problem, selected years, 2009–2013
............................................... 108
Table 13d. Prevalence of housing problems among older-owner/renter intergenerational households, by
type of problem, selected years, 2009–2013
....................................................................................................... 108
Table 13e. Prevalence of housing problems among older-member intergenerational households, by type of
problem, selected years, 2009–2013
................................................................................................................... 109
Table 13f. Prevalence of housing problems among all older households: householder, spouse, or member(s)
age 65 and over, by type of problem, selected years, 2009–2013
......................................................................... 109
Indicator 14: Total Expenditures
Table 14. Percentage distribution of total household annual expenditures, by age of reference person, 2014 ....... 110
Indicator 15: Life Expectancy
Table 15a. Life expectancy at ages 65 and 85, by race and sex, 1981–2014 ......................................................... 111
Table 15b. Life expectancy at birth, age 65, and age 85, by race and Hispanic origin and sex, 2014 ................... 113
Indicator 16: Mortality
Table 16a. Death rates among people age 65 and over, by selected leading causes of death, 1981–2014 ............. 114
Table 16b. Death rates among people age 65 and over, by selected leading causes of death, sex, and race and
Hispanic origin, 2014
....................................................................................................................................... 115

xiii
Indicator 17: Chronic Health Conditions
Table 17a. Percentage of people age 65 and over who reported having selected chronic health conditions,
by sex and race and Hispanic origin, 2013–2014................................................................................................ 116
Table 17b. Percentage of people age 65 and over who reported having selected chronic health conditions,
1997–1998 through 2013–2014
........................................................................................................................ 116
Indicator 18: Oral Health
Table 18a. Percentage of people age 65 and over who had dental insurance, had a dental visit in the past
year, or had no natural teeth, by age group, 2014 .............................................................................................. 117
Table 18b. Percentage of people age 65 and over who had dental insurance, had a dental visit in the past
year, or had no natural teeth, by sex and race and Hispanic origin, 2014
........................................................... 117
Indicator 19: Respondent-Assessed Health Status
Table 19. Percentage of people age 65 and over with respondent-assessed good to excellent health status, by
race and Hispanic origin, sex, and age group, 2012–2014 .................................................................................. 118
Indicator 20: Dementia
Table 20a. Number and percentage of the non-nursing home population age 65 and over with dementia, by
age group, 2011.................................................................................................................................................. 119
Table 20b. Percentage of the non-nursing home population age 65 and over with dementia, by sex and age
group, 2011
....................................................................................................................................................... 119
Table 20c. Percentage of the non-nursing home population age 65 and over with dementia, by sex and
educational attainment, 2011
............................................................................................................................. 119
Table 20d. Percentage of the non-nursing home population age 65 and over with dementia, by age group
and educational attainment, 2011
...................................................................................................................... 119
Indicator 21: Depressive Symptoms
Table 21a. Percentage of people age 51 and over with clinically relevant depressive symptoms, by age group
and sex, selected years 1998–2014 ...................................................................................................................... 120
Table 21b. Percentage of people age 51 and over with clinically relevant depressive symptoms, by age group
and sex, 2014
..................................................................................................................................................... 120
Indicator 22: Functional Limitations
Table 22a. Percentage of people age 65 and over with a disability, by sex and functional domain, 2010 and
2014................................................................................................................................................................... 121
Table 22b. Percentage of people age 65 and over with a disability, by age group and functional domain,
2014................................................................................................................................................................... 122
Table 22c. Percentage of people age 65 and over with a disability, by race and Hispanic origin and
functional domain, 2014
.................................................................................................................................... 122
Table 22d. Percentage of Medicare beneciaries age 65 and over who have limitations in performing
activities of daily living (ADLs) or instrumental activities of daily living (IADLs), or who are in a long-term
care facility, 1992–2013
..................................................................................................................................... 123
Table 22e. Percentage of Medicare beneciaries age 65 and over who have limitations in performing
activities of daily living (ADLs) or instrumental activities of daily living (IADLs), or who are in a long-term
care facility, by sex and age group, 2013
............................................................................................................. 123
Indicator 23: Vaccinations
Table 23a. Percentage of people age 65 and over who reported having been vaccinated against inuenza and
pneumococcal disease, by race and Hispanic origin, selected years, 1989–2014 .................................................. 124

xiv
Table 23b. Percentage of people age 65 and over who reported having been vaccinated against inuenza and
pneumococcal disease, by selected characteristics, 2014 ...................................................................................... 124
Indicator 24: Cancer Screenings
Table 24. Percentage of women ages 50–74 who had breast cancer screening and percentage of people ages
50–75 who had colorectal cancer screening, by sex and age group, selected years, 2000–2013 ............................ 125
Indicator 25: Diet Quality
Table 25. Healthy Eating Index-2010 average total scores and component scores expressed as a percentage
of the HEI maximum score for the population age 65 and over, by age group, 2011–2012 ................................ 126
Indicator 26: Physical Activity
Table 26a. Percentage of people age 65 and over who reported participating in leisure-time aerobic and
muscle-strengthening activities that meet the 2008 Federal physical activity guidelines, by age group,
1998–2014......................................................................................................................................................... 127
Table 26b. Percentage of people age 65 and over who reported participating in leisure-time aerobic and
muscle-strengthening activities that meet the 2008 Federal physical activity guidelines, by sex and race and
Hispanic origin, 2014
........................................................................................................................................ 128
Indicator 27: Obesity
Table 27. Percentage of people age 65 and over overweight and with obesity, by sex and age group, selected years,
1976–2014......................................................................................................................................................... 129
Indicator 28: Cigarette Smoking
Table 28a. Percentage of people age 65 and over who are current cigarette smokers, by sex and race, selected
years, 1965–2014
............................................................................................................................................... 130
Table 28b. Percentage distribution of people age 18 and over, by cigarette smoking status, sex, and age
group, 2014
....................................................................................................................................................... 131
Table 28c. Percentage of people age 65 and over who are current cigarette smokers, by sex and poverty
status, 2014
........................................................................................................................................................ 131
Indicator 29: Use of Health Care Services
Table 29a. Use of Medicare-covered health care services per 1,000 Medicare beneciaries age 65 and over,
1992–2013......................................................................................................................................................... 132
Table 29b. Use of Medicare-covered home health care and skilled nursing facility services per 1,000
Medicare beneciaries age 65 and over, by age group, 2013
................................................................................ 132
Indicator 30: Health Care Expenditures
Table 30a. Average annual health care costs, in 2012 dollars, for Medicare beneciaries age 65 and over, by
age group, 1992–2012........................................................................................................................................ 133
Table 30b. Total amount and percentage distribution of annual health care costs among Medicare
beneciaries age 65 and over, by major cost component, 2008 and 2012
........................................................... 133
Table 30c. Average annual health care costs among Medicare beneciaries age 65 and over, by selected
characteristics, 2012
........................................................................................................................................... 134
Table 30d. Average annual health care costs among Medicare beneciaries age 65 and over, by age group and
major cost component, 2012
.............................................................................................................................. 135
Table 30e. Percentage of noninstitutionalized Medicare beneciaries age 65 and over who reported problems
with access to health care, 1992–2012
................................................................................................................ 135
Indicator 31: Prescription Drugs
Table 31a. Average prescription drug costs, in 2012 dollars, among noninstitutionalized Medicare
beneciaries age 65 and over, by sources of payment, 1992–2012 ...................................................................... 136

xv
Table 31b. Percentage distribution of annual prescription drug costs among noninstitutionalized Medicare
beneciaries age 65 and over, 2012 ..................................................................................................................... 136
Table 31c. Number of Medicare beneciaries age 65 and over who enrolled in Part D prescription drug
plans or who were covered by retiree drug subsidy payments, 2006 and 2014
.................................................... 137
Table 31d. Average prescription drug costs among noninstitutionalized Medicare beneciaries age 65 and
over, by selected characteristics, selected years 2000–2012
.................................................................................. 137
Indicator 32: Sources of Health Insurance
Table 32a. Percentage of noninstitutionalized Medicare beneciaries age 65 and over with supplemental
health insurance, by type of insurance, 1991–2013 ............................................................................................ 138
Table 32b. Percentage of people ages 55–64 with health insurance coverage, by poverty status and type of
insurance, 2014
.................................................................................................................................................. 139
Table 32c. Percentage of people ages 55–64 with health insurance coverage, by type of insurance,
2010–2014......................................................................................................................................................... 139
Indicator 33: Out-of-Pocket Health Care Expenditures
Table 33a. Percentage of people age 55 and over with out-of-pocket expenditures for health care service use,
by age group, 1977, 1987, 1996, and 2000–2013
.............................................................................................. 140
Table 33b. Ratio of out-of-pocket expenditures to household income per person among people age 55 and
over, by selected characteristics, 1977, 1987, 1996, and 2000–2013
.................................................................. 140
Table 33c. Percentage distribution of total out-of-pocket health care expenditures among people age 55 and
over, by age group and type of health care service, 2000–2013
........................................................................... 141
Indicator 34: Sources of Payment for Health Care Services
Table 34a. Average cost per beneciary and percentage distribution of sources of payment for health care
services for Medicare beneciaries age 65 and over, by type of service, 2012 ....................................................... 144
Table 34b. Average cost per beneciary and percentage distribution of sources of payment for health care
services for Medicare beneciaries age 65 and over, by income, 2012
................................................................. 144
Indicator 35: Veterans’ Health Care
Table 35a. Total number of veterans age 65 and over who are enrolled in the Veterans Health
Administration, by age group, 1999–2014 and projected 2019–2034 ................................................................ 145
Table 35b. Percentage of enrolled veterans age 65 and over with service-connected disabilities, by
service-connected disability rating, 2004–2014 and projected 2019–2034
......................................................... 145
Indicator 36: Residential Services
Table 36a. Percentage distribution of Medicare beneciaries age 65 and over residing in selected residential
settings, by age group, 2013 ............................................................................................................................... 146
Table 36b. Percentage distribution of Medicare beneciaries age 65 and over with limitations in
performing activities of daily living (ADLs) and instrumental activities of daily living (IADLs), by residential
setting, 2013
...................................................................................................................................................... 146
Table 36c. Percent availability of specic services among Medicare beneciaries age 65 and over residing in
community housing with services, 2013
............................................................................................................. 146
Table 36d. Percentage distribution of annual income of Medicare beneciaries age 65 and over, by
residential setting, 2013...................................................................................................................................... 147
Table 36e. Characteristics of services available to Medicare beneciaries age 65 and over residing in
community housing with services, 2013
............................................................................................................. 147
Indicator 37: Personal Assistance and Equipment
Table 37a. Percentage distribution of noninstitutionalized Medicare beneciaries age 65 and over who have
limitations in performing activities of daily living (ADLs), by type of assistance, 1992–2013 ............................. 148

xvi
Table 37b. Percentage distribution of noninstitutionalized Medicare beneciaries age 65 and over who have
limitations in performing activities of daily living (ADLs), by type of assistance, age group, and sex, 2013 ......... 148
Table 37c. Percentage of noninstitutionalized Medicare beneciaries age 65 and over who have limitations
in performing instrumental activities of daily living (IADLs) and who receive personal assistance, by age
group, 1992–2013
............................................................................................................................................. 149
Table 37d. Percentage of noninstitutionalized Medicare beneciaries age 65 and over who have limitations
in performing instrumental activities of daily living (IADLs) and who receive personal assistance, by sex and
age group, 2013.................................................................................................................................................. 149
Indicator 38: Long-Term Care Providers
Table 38a. Number of users of long-term care services, by sector and age group, 2013 and 2014
....................... 150
Table 38b. Percentage of users of long-term care services needing any assistance with activities of daily living
(ADLs), by sector and activity, 2013 and 2014
................................................................................................... 150
Indicator 39: Use of Time
Table 39a. Average number of hours per day and percentage of day that people age 55 and over spent doing
selected activities on an average day, by age group, 2014 .................................................................................... 151
Table 39b. Average number of hours and percentage of total leisure time that people age 55 and over spent
doing selected leisure activities on an average day, by age group, 2014
................................................................ 151
Indicator 40: Air Quality
Table 40a. Percentage of people age 65 and over living in counties with “poor air quality,” by selected
pollutant measures, 2000–2014.......................................................................................................................... 152
Table 40b. Counties with “poor air quality” for any standard in 2014
................................................................ 152
Indicator 41: Transportation
Table 41. Percentage of noninstitutionalized Medicare beneciaries age 65 and over who made a change in
transportation mode due to a health or physical problem, by age group and type of change, 2013 ..................... 155
Special Feature: Informal Caregiving
Table CG1. Number of informal caregivers, by age group and sex, 2011 ............................................................ 156
Table CG2. Number of informal caregivers and percentage distribution of caregiving hours provided, by
relationship to care recipient, 2011
..................................................................................................................... 156
Table CG3. Percentage of caregivers providing assistance, by sex of caregiver and type of assistance, 2011 ......... 157
Table CG4. Percentage of caregiver recipients, caregivers, and hours of help provided, by level of assistance
needed by care recipients, 2011
.......................................................................................................................... 157
Table CG5. Percentage of informal caregivers reporting positive and negative aspects of caregiving, by level
of impact, 2011
.................................................................................................................................................. 157

xvii
Highlights
Older Americans 2016: Key Indicators of Well-Being is
one in a series of periodic reports to the Nation on the
condition of older adults in the United States. In this
report, 41 indicators depict the well-being of older
Americans in the areas of Population, Economics, Health
Status, Health Risks and Behaviors, Health Care, and
Environment. is year’s report also includes a special
feature on informal caregiving. Selected highlights from
each section of the report follow.
Population
• In 2014, 46 million people age 65 and over lived in the
United States, accounting for 15 percent of the total
population. e older population in 2030 is projected
to be more than twice as large as in 2000, growing
from 35 million to 74 million and representing 21
percent of the total U.S. population (Indicator 1:
Number of Older Americans).
• In 2014, non-Hispanic single-race Whites, Blacks,
and Asians accounted for 78 percent, 9 percent, and
4 percent of the U.S. older population, respectively.
Hispanics (of any race) were 8 percent of the
older population (Indicator 2: Racial and Ethnic
Composition).
• In 2015, older men were much more likely than older
women to be married. About 74 percent of men ages
65–74 were married, compared with over one-half
(58 percent) of women in the same age group. e
proportion who were married was lower at older ages:
42 percent of women ages 75–84 and 17 percent of
women age 85 and over were married in 2015. For
men, the proportion who were married was also lower
at older ages, but not as low as for older women. Even
among men age 85 and over, the majority (59percent)
were married in 2015 (Indicator 3: Marital Status).
• In 2015, 84 percent of the population age 65 and
over were high school graduates or more, and 27
percent had a Bachelor’s degree or more (Indicator 4:
Educational Attainment).
• In 2015, older men were more likely to live with their
spouse than were older women. About 70 percent of
older men lived with their spouse while less than half
(45 percent) of older women did. In contrast, older
women were more likely than older men to live alone
(36 percent versus 20 percent) (Indicator5: Living
Arrangements).
• In 2010, there were 9.2 million veterans age 65 and
over in the United States. is number is expected to
drop to 8.9 million by 2025, an expected decrease of
about 2.7 percent (Indicator 6: Older Veterans).
Economics
• In 1966, 29 percent of people age 65 and over lived
below the poverty threshold. By 2014, the proportion
of the older population living in poverty had decreased
dramatically to 10 percent (Indicator 7: Poverty).
• Between 1974 and 2014, there was a decrease in the
proportion of older people with an income below
poverty (from 15 percent to 10 percent) and with low
income (from 35 percent to 23 percent), and there
was an increase in the proportion of people with high
income (from 18percent to 36 percent) (Indicator 8:
Income).
• For persons age 65 and over, two-thirds of income in
2014 was from retirement benets including Social
Security which accounted for about half of average
total family income (Indicator 9: Sources of Income).
• e type of Social Security benets received by women
age 62 and over dramatically changed between 1960
and 2014. e percentage who received spouse-only
benets decreased from 33percent to 9 percent, and
the percentage who received widow-only benets
decreased from 23 percent to 14percent. In contrast,
the percentage who received earned worker benets
increased from 43 percent in 1960 to 77 percent in
2014 (Indicator 10: Social Security Beneciaries).
• In 2013, the median net worth of households headed
by White people age 65 and over ($255,000) was
almost ve times that of the median net worth of
households headed by older Black people ($56,700).
is dierence was less than in 1998, when the median
net worth of households headed by older White people
was about six times higher than that of households
headed by older Black people (Indicator 11: Net
Worth).
• In 2015, labor force participation rates for women
age 55 and over remained high after rising over the
past four decades. is trend continued through the
recent recession, but leveled o since the beginning
of the recovery. Among men age 55 and over, labor
participation rates increased in the mid-1990s,

xviii
following declines in the rates in the previous decades.
Since the recent recession, participation rates among
men have been fairly at (Indicator 12: Participation in
Labor Force).
• While housing cost burden has generally increased
over time, between 2009 and 2013 the prevalence of
cost burden decreased from 40 to 36 percent for older
owner/renter households and from 39 to 34 percent
for older-member households. For households headed
by older Americans with children in their homes,
housing cost burden remained relatively the same at
approximately 40 percent. (Indicator 13: Housing
Problems).
• As a share of total expenditures, health care increased
dramatically with age in 2014. For the group age 75
and over, the share (16 percent) was more than double
the share for the age 45–54 group (7 percent) and
larger than the share the oldest group allocated to
transportation (14 percent) or the share allocated to
food (12 percent) (Indicator 14: Total Expenditures).
Health Status
• Life expectancy varies by race, but the dierence
decreases with age. In 2014, life expectancy at birth
was 3.4 years higher for White people than for Black
people. At age 65, White people can expect to live
an average of 1.1 years longer than Black people.
Among those who survive to age 85, however, the
life expectancy among Black people is slightly higher
(6.9years) than White people (6.5 years) (Indicator 15:
Life Expectancy).
• Between 1999 and 2014, age-adjusted death rates
for all causes of death among people age 65 and over
declined by 20 percent. Death rates declined for heart
disease, cancer, chronic lower respiratory disease,
stroke, diabetes, and inuenza and pneumonia.
Death rates for Alzheimer’s disease and unintentional
injuries increased over the same period (Indicator 16:
Mortality).
• e prevalence of certain chronic health conditions
diered by sex in 2013–2014. Women reported higher
levels of asthma and arthritis than men. Men reported
higher levels of heart disease, cancer, and diabetes
(Indicator 17: Chronic Health Conditions).
• In 2014, about 62 percent of people age 65 and over
had a dental visit in the past year. e percentage
visiting a dentist was higher among people ages 65–74
than among people age 85 and over (66 percent versus
56 percent) (Indicator 18: Oral Health).
• In 2012–2014, older non-Hispanic White people were
more likely to report good to excellent health than
their non-Hispanic Black and Hispanic counterparts
(80 percent versus 65 and 66 percent, respectively)
(Indicator 19: Respondent-Assessed Health Status).
• In 2011, among people ages 65–74, men were more
likely to have dementia than women, but among adults
age 85 and over, women were more likely to have
dementia than men (Indicator 20: Dementia).
• e prevalence of clinically meaningful depressive
symptoms for the U.S. population over age 50
remained fairly stable between 1998 and 2014.
Although women over 50 have consistently higher
prevalence of depressive symptoms than men, in
2014 both men and women had higher prevalence of
depressive symptoms in middle adulthood and after age
80, with the lowest prevalence occurring among those
ages 65 to 79 (Indicator 21: Depressive Symptoms).
• In 2014, 22 percent of the population age 65 and over
reported having a disability as dened by limitations in
vision, hearing, mobility, communication, cognition,
and self-care. Women were more likely to report any
disability than men (24 percent versus 19percent)
(Indicator 22: Functional Limitations).
Health Risks and Behaviors
• In 2014, 70 percent of people age 65 and over reported
receiving a u shot in the past 12 months; however,
there were dierences by race and ethnicity. About
72percent of non-Hispanic Whites reported receiving
a u shot, compared with 57 percent of non-Hispanic
Blacks and 61 percent of Hispanics (Indicator 23:
Vaccinations).
• A higher proportion of women in 2013 received a
mammogram in the past 2 years than met colorectal
cancer screening guidelines. For example, 71 percent of
women ages 50–64 received a mammogram compared
with 54 percent who met colorectal cancer screening
guidelines (Indicator 24: Cancer Screenings).
• During 2011–2012, people age 75 and over met the
dietary recommendations for whole fruits, while people
age 65 and over met the dietary recommendations for
total protein foods. Overall diet quality, as measured by
the Total Healthy Eating Index-2010 score, was 68 out

xix
of 100 for people age 65 and over (Indicator 25: Diet
Quality).
• In 2014, about 12 percent of people age 65 and over
reported participating in leisure-time aerobic and
muscle-strengthening activities that met the 2008
Federal physical activity guidelines. e percentage of
older people meeting the physical activity guidelines
decreased with age, ranging from 15 percent among
people ages 65–74 to 5 percent among people age 85
and over (Indicator 26: Physical Activity).
• As with other age groups, the percentage of people age
65 and over with obesity has increased since 1988–
1994. In 2011–2014, about 35 percent of people age
65 and over had obesity, compared with 22 percent in
1988–1994 (Indicator 27: Obesity).
• e percentage of people age 65 and over who were
current cigarette smokers declined between 1965 and
2014, with larger declines occuring among men than
among women. Levels of cigarette smoking have been
stable in the past decade. In 2014, 10 percent of men
and 8 percent of women age 65 and over were current
smokers (Indicator 28: Cigarette Smoking).
Health Care
• While the number of hospital stays remained fairly
stable from 1992 to 2013, the average length of stay in
the hospital decreased steadily over time. In 1992, the
average length of stay in the hospital for a Medicare
beneciary was 8.4 days; by 2013 the average length
of stay had decreased to 5.3 days (Indicator 29: Use of
Health Care Services).
• After adjusting for ination, health care costs per
capita increased slightly among those ages 65–74
between 1992 and 2012. In all years, average costs
were substantially higher for those age 85 and over
compared with those in the younger age groups
(Indicator 30: Health Care Expenditures).
• Average prescription drug costs for noninstitutionalized
Americans age 65 and over increased rapidly for
many years but were relatively stable from 2005
to 2012. Medicare coverage of prescription drugs,
which includes a low-income subsidy for beneciaries
with low income and assets, began in January 2006
(Indicator 31: Prescription Drug Costs).
• Enrollment in Medicare Advantage (MA)/Capitated
Payment Plans has grown rapidly in recent years. In
2005, 16 percent of Medicare beneciaries age 65 and
over were enrolled in an MA plan, compared with
34percent in 2013 (Indicator 32: Sources of Health
Insurance).
• From 1977 to 2013, the percentage of household
income that people age 65 and over allocated to
out-of-pocket spending for health care services
increased among those in the poor/near poor income
category from 12 percent to 17 percent (Indicator 33:
Out-of-Pocket Health Care Expenditures).
• Medicare paid for almost 60 percent of all health care
costs of enrollees age 65 and over in 2012. Medicare
nanced all hospice costs and most hospital, physician,
home health care, and short-term institution costs
(Indicator 34: Sources of Payment for Health Care
Services).
• e number of veterans age 65 and over enrolled with
the Veterans Health Administration has been steadily
increasing since 1999, when eligibility for this benet
was reformed, and the number of veterans age 85 and
over enrolled is projected to exceed 1 million by 2034
(Indicator 35: Veterans’ Health Care).
• In 2013, about 3 percent of the Medicare population
age 65 and over resided in community housing with
at least one service available. About 4 percent resided
in long-term care facilities. Among those age 85 and
over, 8 percent resided in community housing with
services, and 15 percent resided in long-term care
facilities. Among those ages 65–74, about 98 percent
resided in traditional community settings (Indicator
36: Residential Services).
• In 2013, about two-thirds of people who had diculty
with one or more activities of daily living (ADLs)
received personal assistance or used special equipment:
7percent received personal assistance only, 35 percent
used equipment only, and 25 percent used both
personal assistance and equipment (Indicator 37:
Personal Assistance and Equipment).
• In 2014, about 1.2 million people age 65 and over were
residents of nursing homes. Nearly 780,000 people of
that age lived in residential care communities such as
assisted living facilities. In both settings, people age
85and over were the largest age group among residents
(Indicator 38: Long-Term Care Providers).
Environment
• e proportion of leisure time that older Americans
spent socializing and communicating—such as visiting

xx
friends or attending or hosting social events—declined
with age. In 2014, the percentage of leisure time spent
socializing and communicating was about 11 percent
for those ages 55–64 and 9 percent for those age 75
and over (Indicator 39: Use of Time).
• e percentage of people age 65 and over living in
counties that experienced poor air quality decreased
from 66 percent in 2000 to 16percent in 2014
(Indicator 40: Air Quality).
• In 2013, about 33 percent of the noninstitutionalized
Medicare population age 65 and over limited their
driving to daytime because of a health or physical
problem. e percentage of people who limited
their driving to daytime was greater for those age
85 and over (55 percent) than for those age 65–74
(25percent) (Indicator 41: Transportation).
Special Feature
“Informal caregivers” are family members or friends who
are not paid and assist older adults who have functional
limitations with everyday tasks such as bathing, dressing,
preparing a meal, or managing money. Informal
caregivers are a diverse population that includes spouses,
children, and other relatives such as daughters-in-law,
grandchildren, and friends.
• In 2011, an estimated 18 million informal caregivers
provided 1.3 billion hours of care on a monthly basis.
• More informal caregivers were women (11.1 million)
than men (6.9 million), and about half of informal
caregivers were middle-aged (ages 45–64).
• Almost half of informal caregivers were a child of the
care recipient. Although spouses made up only 21
percent of informal caregivers, they accounted for more
than 31 percent of the total hours of informal care
provided.
• Some types of care provided dier by caregiver
gender. For example, men were more likely to provide
assistance with mobility, whereas women were more
likely to assist with self-care and medical care.
• Most informal caregivers reported positive impacts of
caregiving; however, almost half said they have things
they cannot handle or do not have enough time for
themselves.

Population
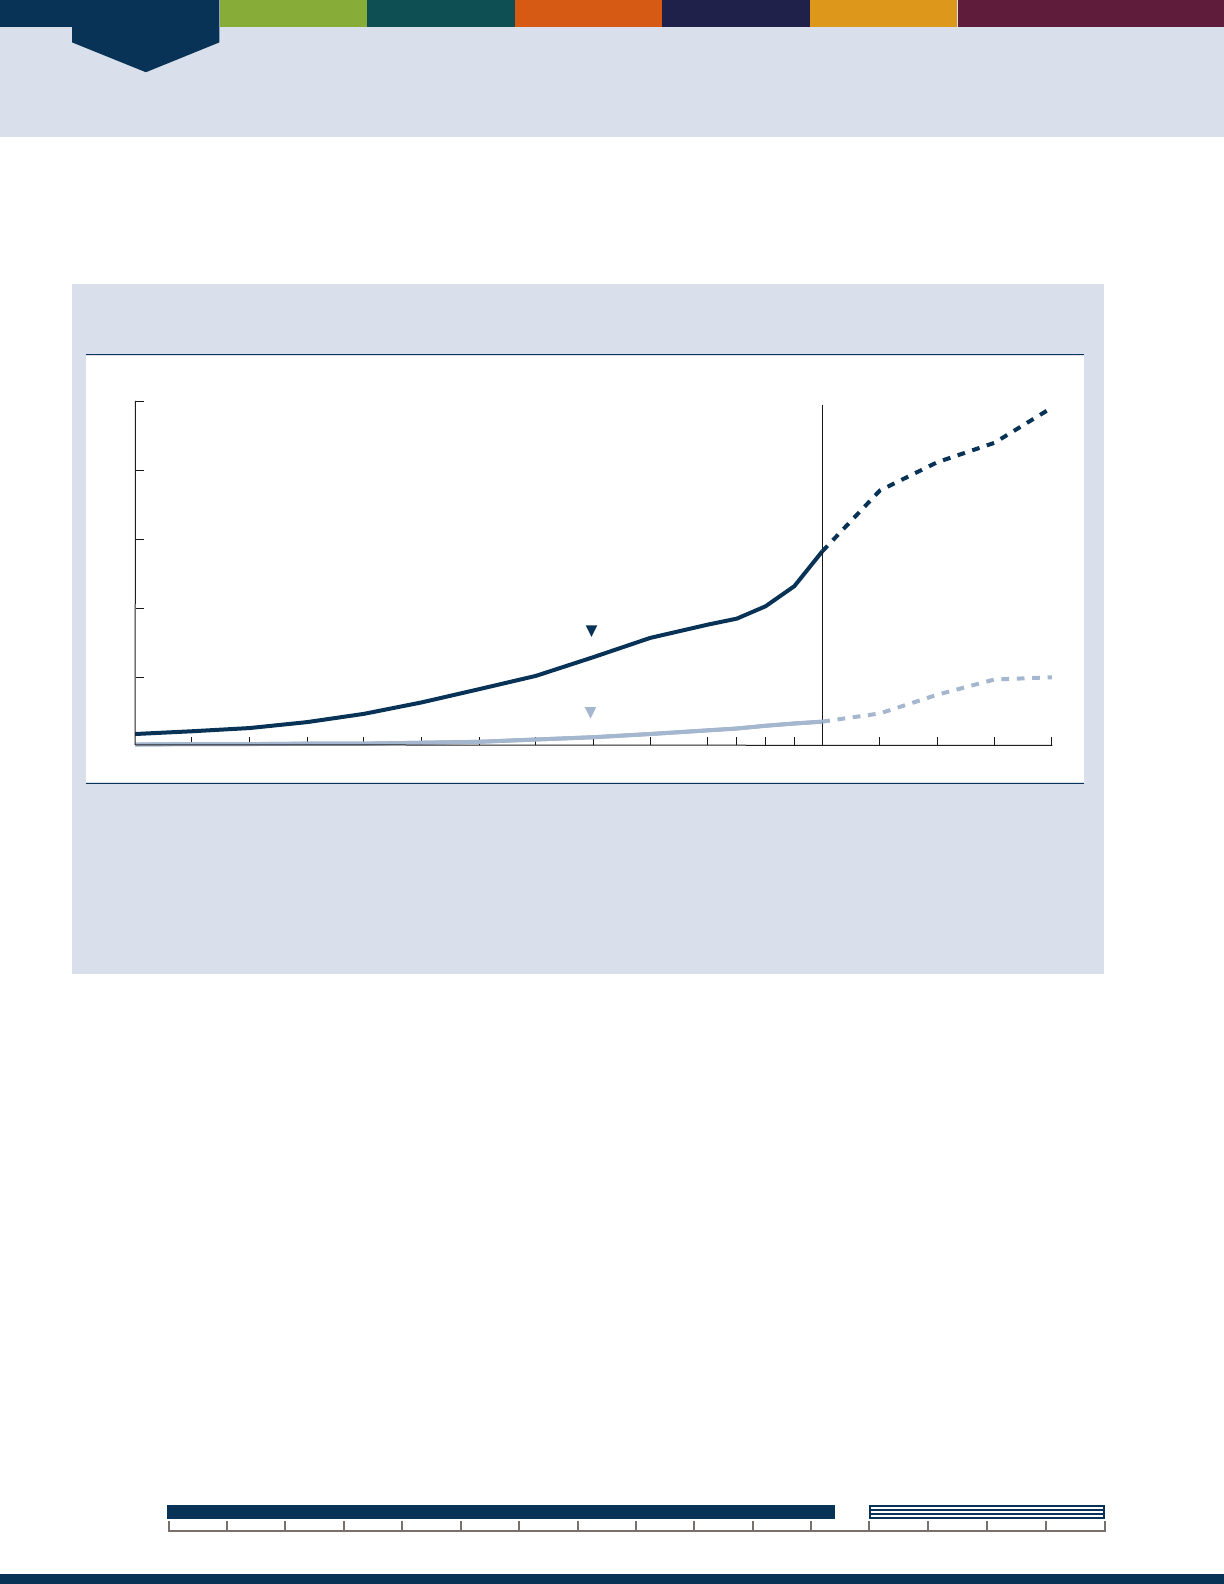
Population
2
INDICATOR 1: Number of Older Americans
e growth of the population age 65 and over aects many aspects of our society, presenting challenges to families,
businesses, health care providers, and policymakers, among others, to meet the needs of aging individuals.
Population age 65 and over and age 85 and over, selected years, 1900–2014, and projected years,
2020–2060
Millions
0
20
40
60
80
100
65 and over
Projected
85 and over
1900 1910 1920 1930 1940 1950 1960 1970 1980 1990 2000 2010 2020 2030 2050 20602040
NOTE: Some data for 2020–2050 have been revised and differ from previous editions of
Older Americans.
Reference population: These data refer to the resident population.
SOURCE: U.S. Census Bureau, 1900 to 1940, 1970, and 1980, U.S. Census Bureau, 1983, Table 42; 1950, U.S. Census Bureau, 1953, Table 38;
1960, U.S. Census Bureau, 1964, Table 155; 1990, U.S. Census Bureau, 1991, 1990 Summary Table File; 2000, U.S. Census Bureau, 2001,
Census
2000 Summary File 1;
U.S. Census Bureau, Table 1: Intercensal Estimates of the Resident Population by Sex and Age for the U.S.: April 1,
2000, to July 1, 2010 (US-EST00INT-01); U.S. Census Bureau, 2011.
2010 Census Summary File 1;
U.S. Census Bureau, Annual Estimates of the
Resident Population for Selected Age Groups by Sex for the United States, States, Counties, and Puerto Rico Commonwealth and Municipios:
April 1, 2010, to July 1, 2014 (PEPAGESEX); U.S. Census Bureau, Table 3: Projections of the Population by Sex and Selected Age Groups for the
United States: 2015 to 2060 (NP2014-T3).
• In 2014, 46 million people age 65 and over lived in
the United States, accounting for 15 percent of the
total population. e older population grew from
3million in 1900 to 46 million in 2014. e oldest-
old population (those age 85 and over) grew from just
over 100,000 in 1900 to 6 million in 2014.
• e “Baby Boomers” (those born between 1946 and
1964) started turning 65 in 2011, and the number
of older people will increase dramatically during the
2014–2030 period. e older population in 2030 is
projected to be twice as large as their counterparts
in 2000, growing from 35 million to 74 million
and representing nearly 21 percent of the total
U.S.population.
• e growth rate of the older population is projected to
slow after 2030, when the last Baby Boomers enter the
ranks of the older population. From 2030 onward, the
proportion of those who are age 65 and over will be
relatively stable, ranging from 21 percent to 24 percent,
even though the absolute number of people age 65 and
over is projected to continue to grow. e oldest-old
population is projected to grow rapidly after 2030,
when the Baby Boomers move into this age group.
• e U.S. Census Bureau projects that the population
age 85 and over could grow from 6 million in 2014
to 20 million by 2060. Some researchers predict that
death rates at older ages will decline more rapidly than
is reected in the U.S. Census Bureau’s projections,
which could lead to faster growth of this population.
3–5
20602000 2010 20201990198019701960195019401930192019101900
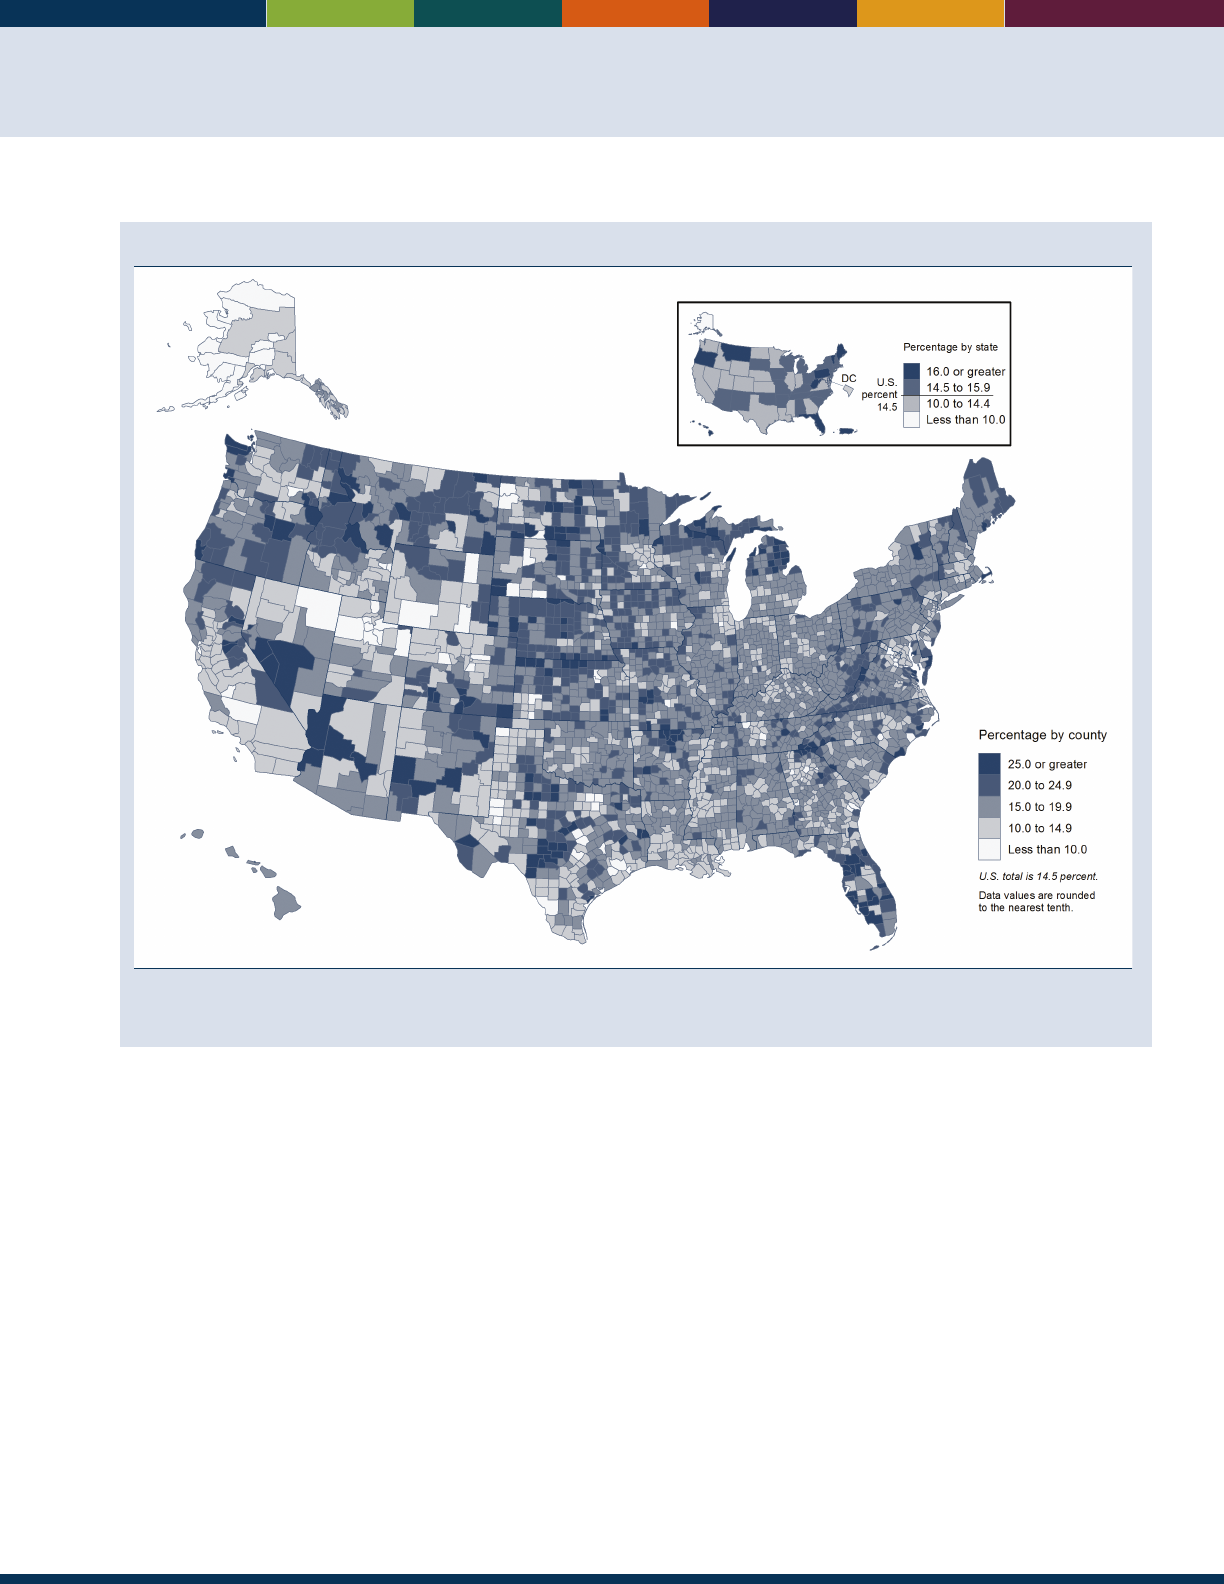
3
Percentage of population age 65 and over, by county and state, 2014
Reference population: These data refer to the resident population.
SOURCE: U.S. Census Bureau, Annual Estimates of the Resident Population for Selected Age Groups by Sex for the United States, States,
Counties, and Puerto Rico Commonwealth and Municipios: April 1, 2010, to July 1, 2014 (PEPAGESEX).
• e proportion of the population age 65 and over
varies by state and is partly aected by the state
fertility and mortality levels and partly by the number
of older and younger people who migrate to and
from the state. In2014, Florida was the state with
the highest proportion of people age 65 and over
(19percent). Maine, West Virginia, Vermont, Montana,
Pennsylvania, Delaware, Hawaii, and Oregon also
hadhigh proportions (16 percent or over).
• e proportion of the population age 65 and over
varies even more by county. In 2014, 53 percent of
Sumter County, Florida, was age 65 and over, the
highest proportion in the country. In several Florida
counties, the proportion was over 30 percent. At the
other end of the spectrum was Chattahoochee County,
Georgia, with only 4.1 percent of its population age
65and over.
• Older women outnumbered older men in the United
States, and the proportion who are female increased
with age. In 2014, women accounted for 56percent of
the population age 65 and over and for 66 percent of
the population age 85 and over.
• e United States is fairly young for a developed
country, with 15 percent of its population age 65and
over in 2015. Japan had the highest percentage of
persons age 65 and over (27 percent) among countries
with a population of at least 1 million. e older
population made up more than 15 percent of the
population in most European countries and above
20percent in Germany, Italy, Greece, and Finland.
Data for this indicator’s charts and bullets can be found in
Tables 1a through 1f on pages 82–87.
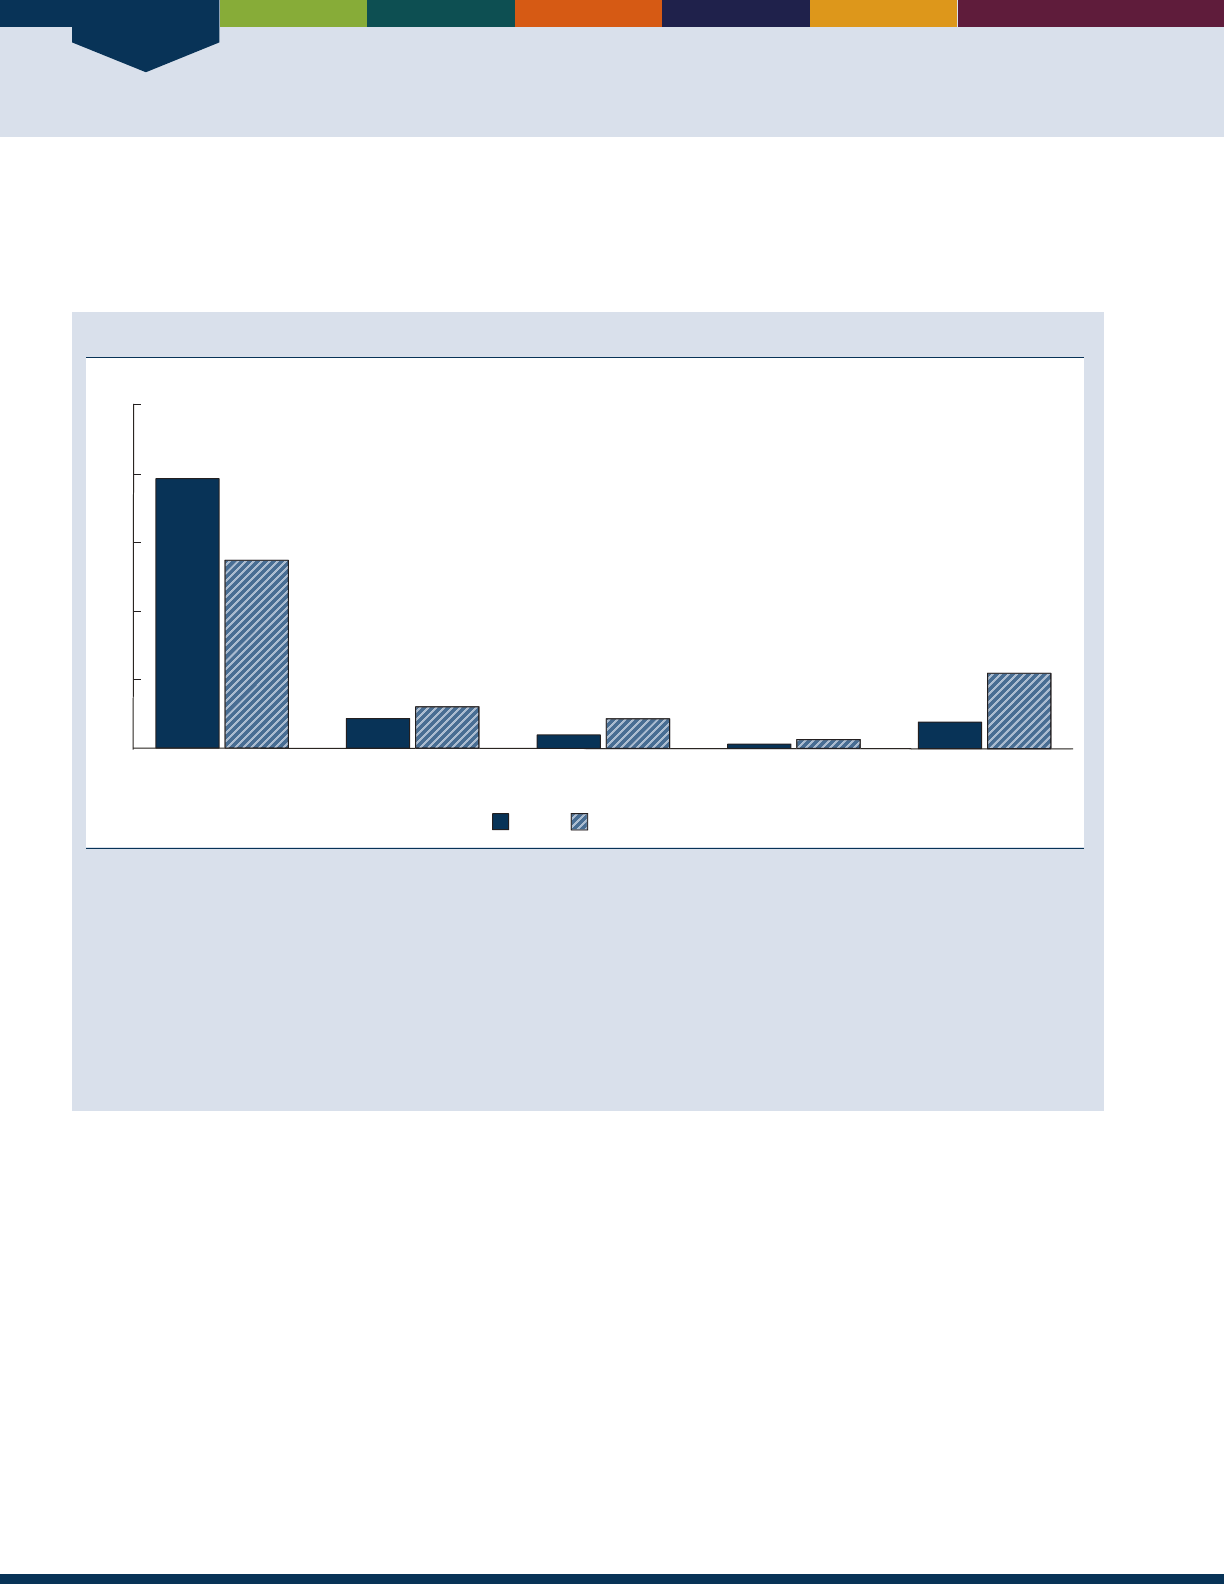
Population
4
INDICATOR 2: Racial and Ethnic Composition
As the older population grows larger, it will also grow more diverse, reecting the demographic changes in the U.S.
population as a whole over the last several decades. By 2060, programs and services for older people will require greater
exibility to meet the needs of a more diverse population.
Population age 65 and over, by race and Hispanic origin, 2014 and projected 2060
Non-Hispanic White
alone
Non-Hispanic Black
alone
Non-Hispanic Asian
alone
Non-Hispanic all other races
alone or in combination
Hispanic or
Latino (any race)
Percent
2060 (projected)2014
78
55
9
12
4
9
8
22
1
3
0
20
40
60
80
100
NOTE: The presentation of racial and ethnic composition data in this table has changed from previous editions of
Older Americans.
Unlike in
previous editions, Hispanics are not counted in any race group. The term “non-Hispanic White alone” is used to refer to people who reported
being White and no other race and who are not Hispanic. The term “non-Hispanic Black alone” is used to refer to people who reported being
Black or African American and no other race and who are not Hispanic, and the term “non-Hispanic Asian alone” is used to refer to people
who reported only Asian as their race and who are not Hispanic. The use of single-race populations in this chart does not imply that this is
the preferred method of presenting or analyzing data. The U.S. Census Bureau uses a variety of approaches. The race group “non-Hispanic All
other races alone or in combination” includes people who reported American Indian and Alaska Native alone who are not Hispanic; people
who reported Native Hawaiian and Other Pacic Islander alone who are not Hispanic; and all people who reported two or more races who are
not Hispanic. “Hispanic” refers to an ethnic category; Hispanics may be of any race.
Reference population: These data refer to the resident population.
SOURCE: U.S. Census Bureau, Annual Estimates of the Resident Population by Sex, Age, Race, and Hispanic Origin for the United States and
States: April 1, 2010, to July 1, 2014 (PEPASR6H); U.S. Census Bureau, Table 1. Projected Population by Single Year of Age, Sex, Race, and
Hispanic Origin for the United States: 2014 to 2060 (NP2014_D1).
• In 2014, non-Hispanic single-race Whites, Blacks,
and Asians accounted for 78 percent, 9 percent, and
4 percent of the U.S. older population, respectively.
Hispanics (of any race) were 8 percent of the older
population.
• Projections indicate that by 2060 the composition
of the older population will be 55 percent non-
Hispanic White alone, 12 percent non-Hispanic
Black alone, and 9 percent non-Hispanic Asian
alone. Hispanics will be 22 percent of the older
population in 2060.While the older population will
increase among all racial and ethnic groups, the older
Hispanicpopulation is projected to grow the fastest,
from 3.6million in 2014 to 21.5 million in 2060.
e older Hispanic population is expected to be larger
than the older non-Hispanic Black alone population in
2060. e older non-Hispanic Asian alone population
is also projected to experience rapid growth. In 2014,
nearly 2 million older single-race non-Hispanic Asians
lived in the United States; by 2060, this population is
projected to be about 8.5 million.
Data for this indicator’s charts and bullets can be found in
Table 2 on page 88.
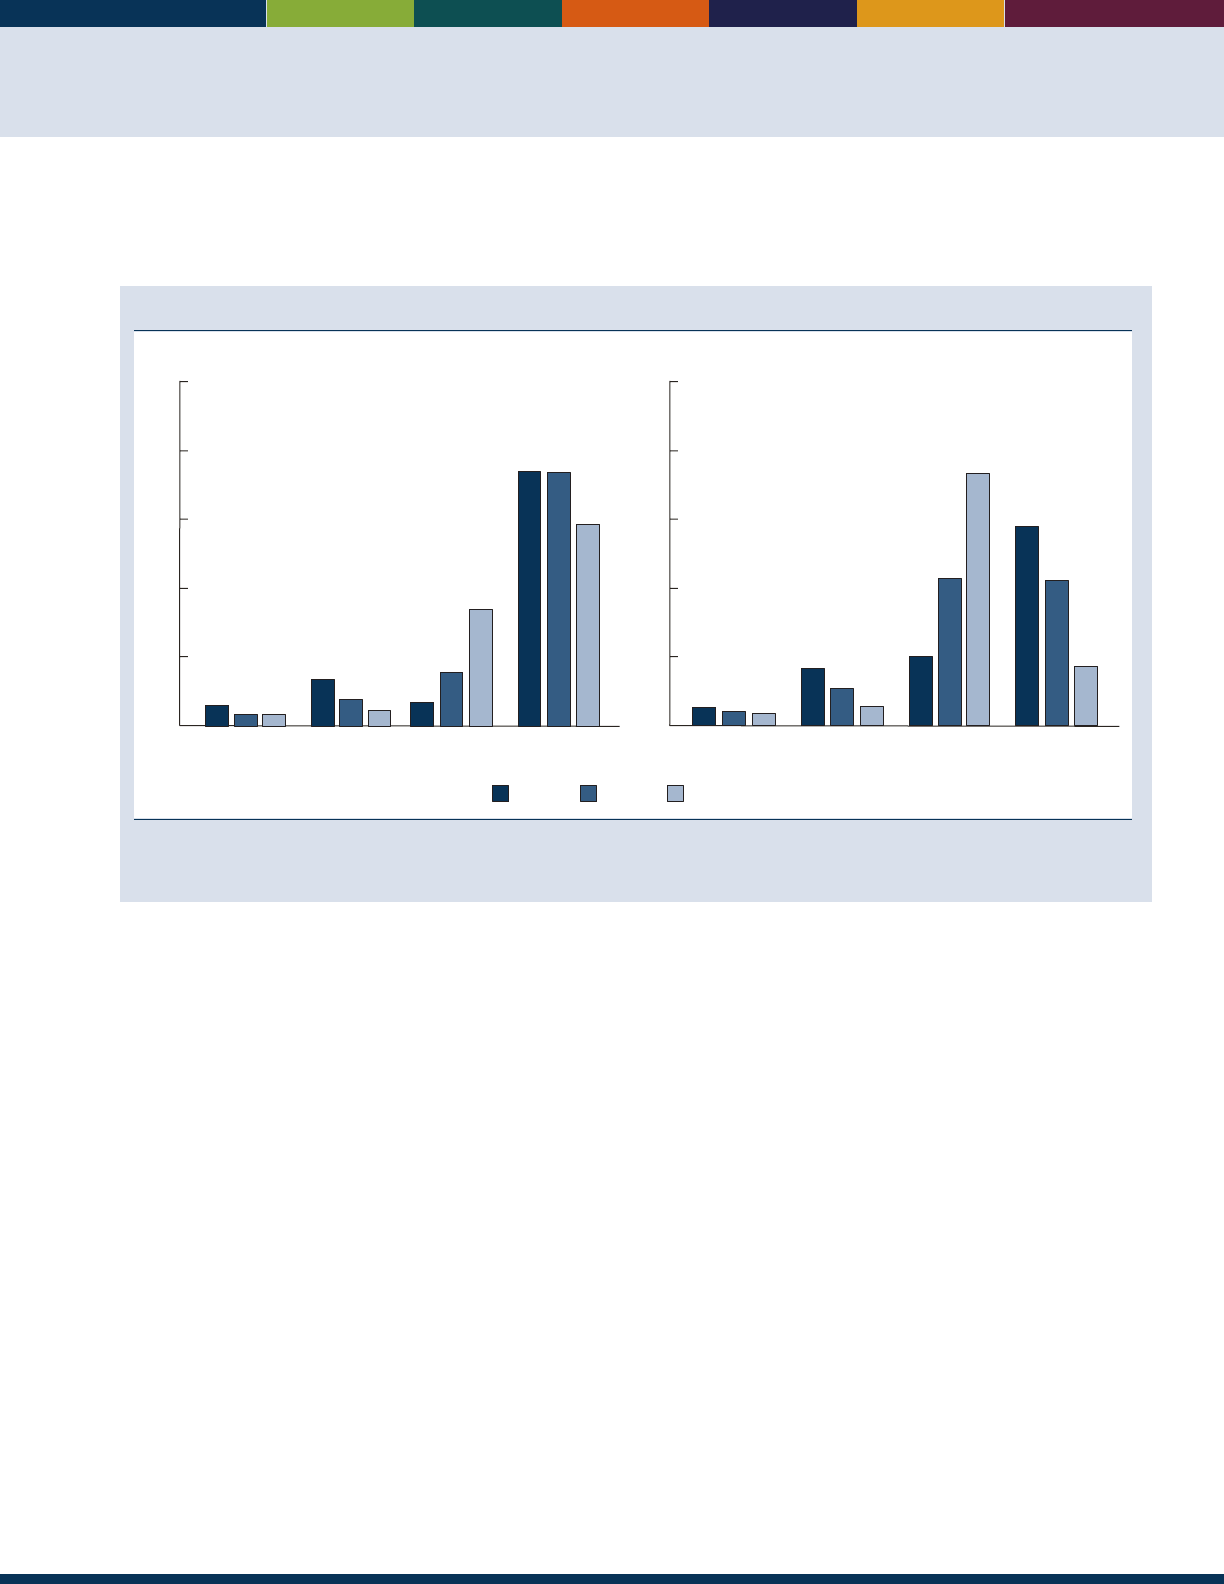
5
INDICATOR 3: Marital Status
Marital status can strongly aect one’s emotional and economic well-being. Among other factors, it inuences living
arrangements and the availability of caregivers for older Americans with an illness or disability.
Marital status of the population age 65 and over, by sex and age group, 2015
75–84 85 and over65–74
100
Percent
80
60
40
20
0
Men
6
3
3
13
7
4
7
16
34
74 74
59
Never married Divorced Widowed Married
Women
100
Percent
80
60
40
20
0
5
44
6
17
11
20
43
42
58
17
Never married Divorced Widowed Married
73
NOTE: Married includes married, spouse present; married, spouse absent; and separated.
Reference population: These data refer to the civilian noninstitutionalized population.
SOURCE: U.S. Census Bureau, Current Population Survey, Annual Social and Economic Supplement.
• In 2015, older men were much more likely than older
women to be married. About 74 percent of men ages
65–74 were married, compared with over one-half
(58 percent) of women in the same age group. e
proportion who were married was lower at older ages:
42 percent of women ages 75–84 and 17 percent of
women age 85 and over were married in 2015. For
men, the proportion who were married was also lower
at older ages, but not as low as for older women. Even
among the oldest old (those age 85 and over), the
majority of men (59percent) were married in 2015.
• Widowhood was more common among older women
than among older men in 2015. Women age 65 and
over were more likely than men of the same age to
be widowed (34 percent compared with 12 percent).
Nearly three-quarters (73 percent) of women age 85
and over were widowed, compared with34 percent of
men.
• Relatively small proportions of older men (11 percent)
and women (13 percent) were divorced in 2015. A
small proportion (5 percent) of the older population
had never married.
All comparisons presented for this indicator are signicant at
the 0.10 condence level. Data for this indicator’s charts and
bullets can be found in Table 3 on page 88.
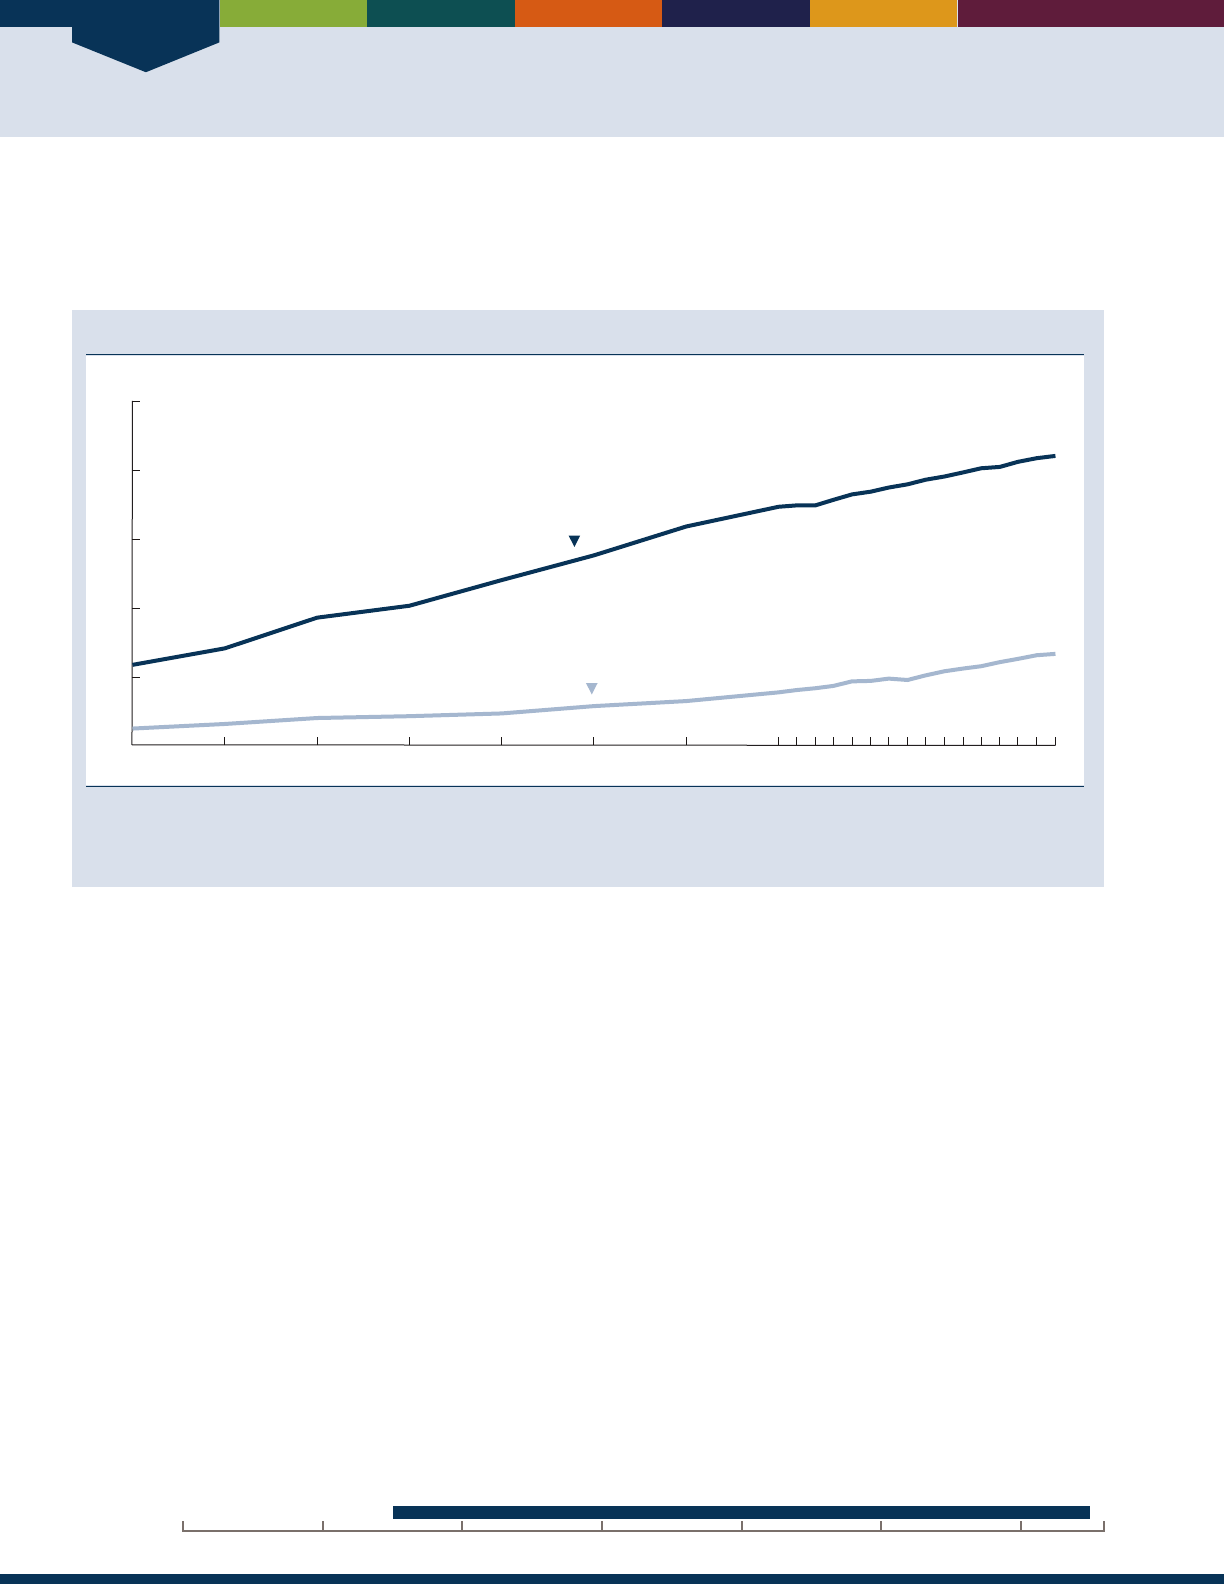
Population
6
INDICATOR 4: Educational Attainment
Educational attainment has eects throughout the life course, which in turn plays a role in well-being at older ages.
Higher levels of education are usually associated with higher incomes, higher standards of living, and above-average
health.
Educational attainment of the population age 65 and over, selected years, 1965–2015
Percent
0
20
40
60
80
100
1965 1970 1975 1980 1985 1990 1995 2000 2005 20152010
High school graduate or more
Bachelor’s degree or more
NOTE: A single question that asks for the highest grade or degree completed is used to determine educational attainment. Prior to 1995,
educational attainment was measured using data on years of school completed.
Reference population: These data refer to the civilian noninstitutionalized population.
SOURCE: U.S. Census Bureau, Current Population Survey, Annual Social and Economic Supplement.
• In 1965, 24 percent of the older population had
graduated from high school and only 5 percent had
at least a Bachelor’s degree. By 2015, 84 percent were
high school graduates or more and 27 percent had a
Bachelor’s degree or more.
• In 2015, 85 percent of older men and 83 percent
of older women had at least a high school diploma.
Older men attained at least a Bachelor’s degree more
often than older women (32 percent compared with
23percent, respectively).
20162000 201019901980197019601950
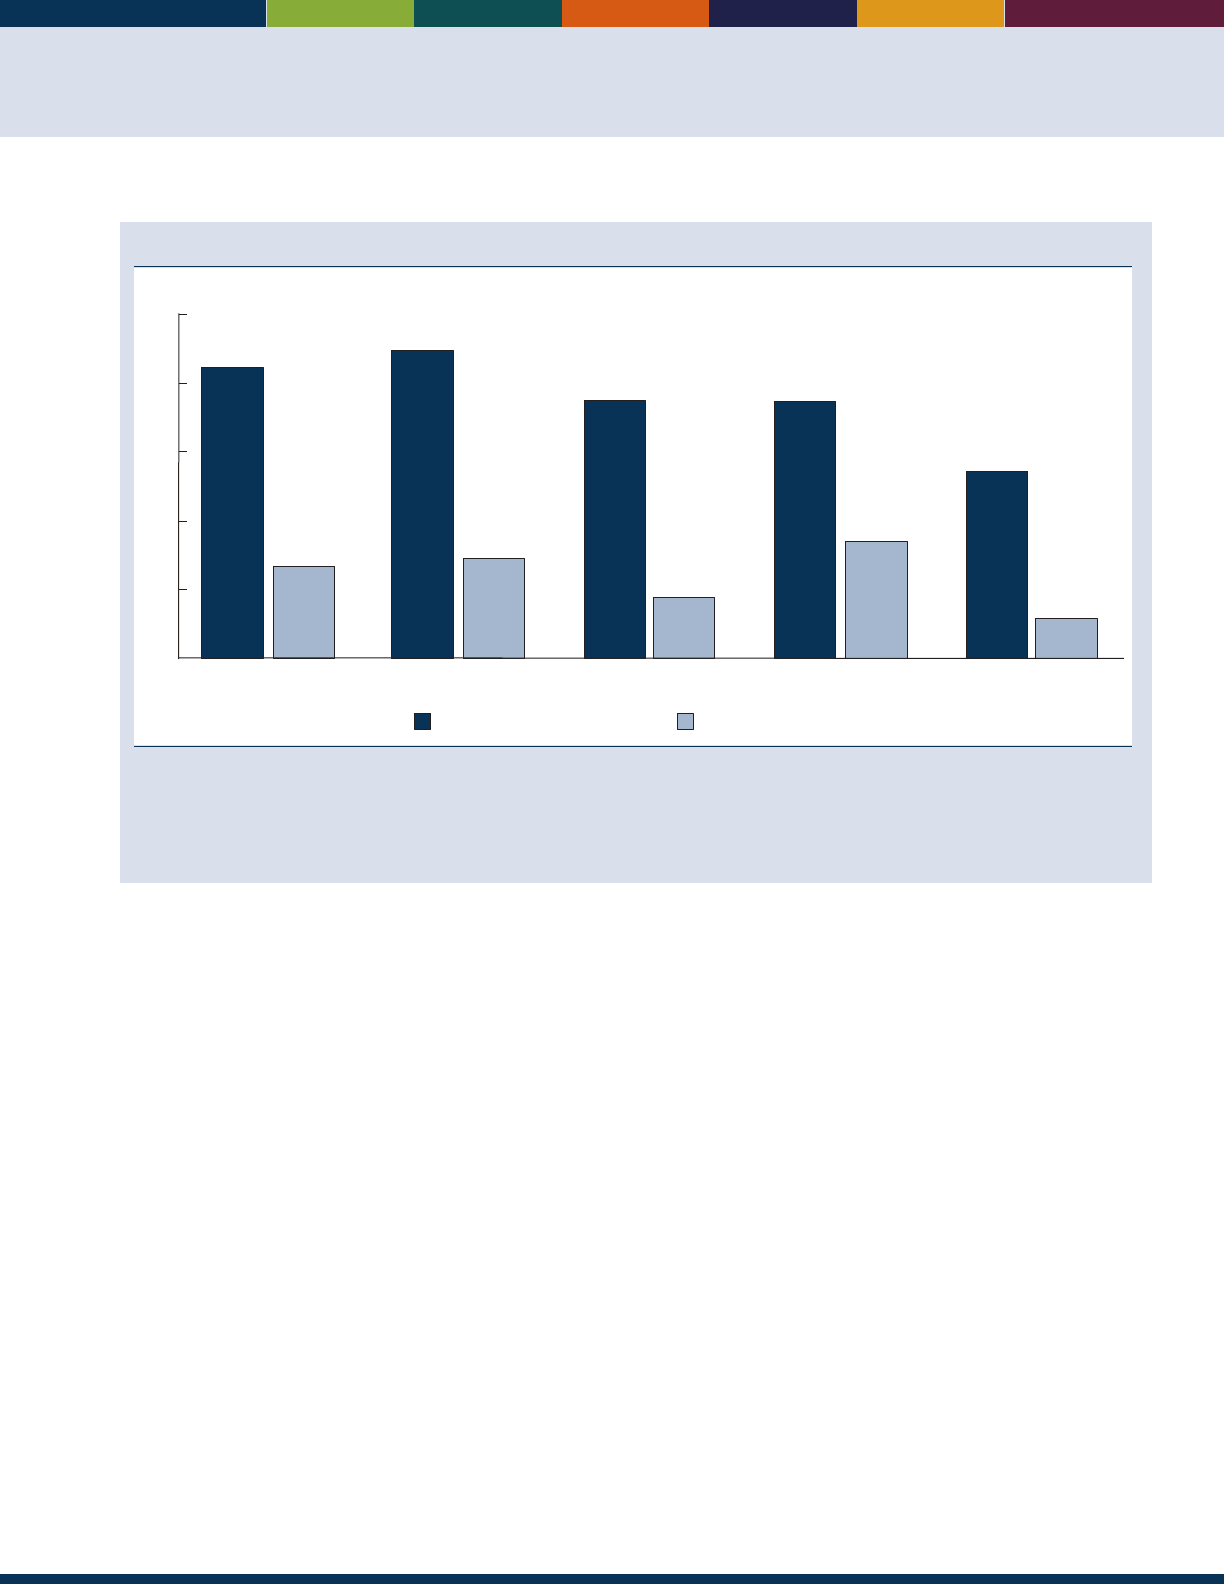
7
Educational attainment of the population age 65 and over, by race and Hispanic origin, 2015
Total Non-Hispanic White
alone
Black alone Asian alone Hispanic
(of any race)
Percent
High school graduate or more Bachelor’s degree or more
84
27
89
29
75
17
74
34
54
12
0
20
40
60
80
100
NOTE: The term “non-Hispanic White alone” is used to refer to people who reported being White and no other race and who are not Hispanic.
The term “Black alone” is used to refer to people who reported being Black or African American and no other race, and the term “Asian alone”
is used to refer to people who reported only Asian as their race. The use of single-race populations in this chart does not imply that this is the
preferred method of presenting or analyzing data. The U.S. Census Bureau uses a variety of approaches.
Reference population: These data refer to the civilian noninstitutionalized population.
SOURCE: U.S. Census Bureau, Current Population Survey, Annual Social and Economic Supplement.
• Despite the overall increase in educational attainment
among older Americans, substantial educational
dierences exist among racial and ethnic groups. In
2015, 89 percent of non-Hispanic Whites age 65
and over had completed high school. e percentages
of older Asians and Blacks who had completed high
school (74 percent and 75 percent, respectively) were
not statistically dierent. In contrast, 54 percent of
older Hispanics had completed high school.
• In 2015, older Asians had the highest proportion
with at least a Bachelor’s degree (34 percent). About
29percent of older non-Hispanic Whites had this level
of education. e proportions were 17 percent and
12percent, respectively, for older Blacks and Hispanics.
All comparisons presented for this indicator are signicant at
the 0.10 condence level. Data for this indicator’s charts and
bullets can be found in Tables 4a and 4b on page 89.
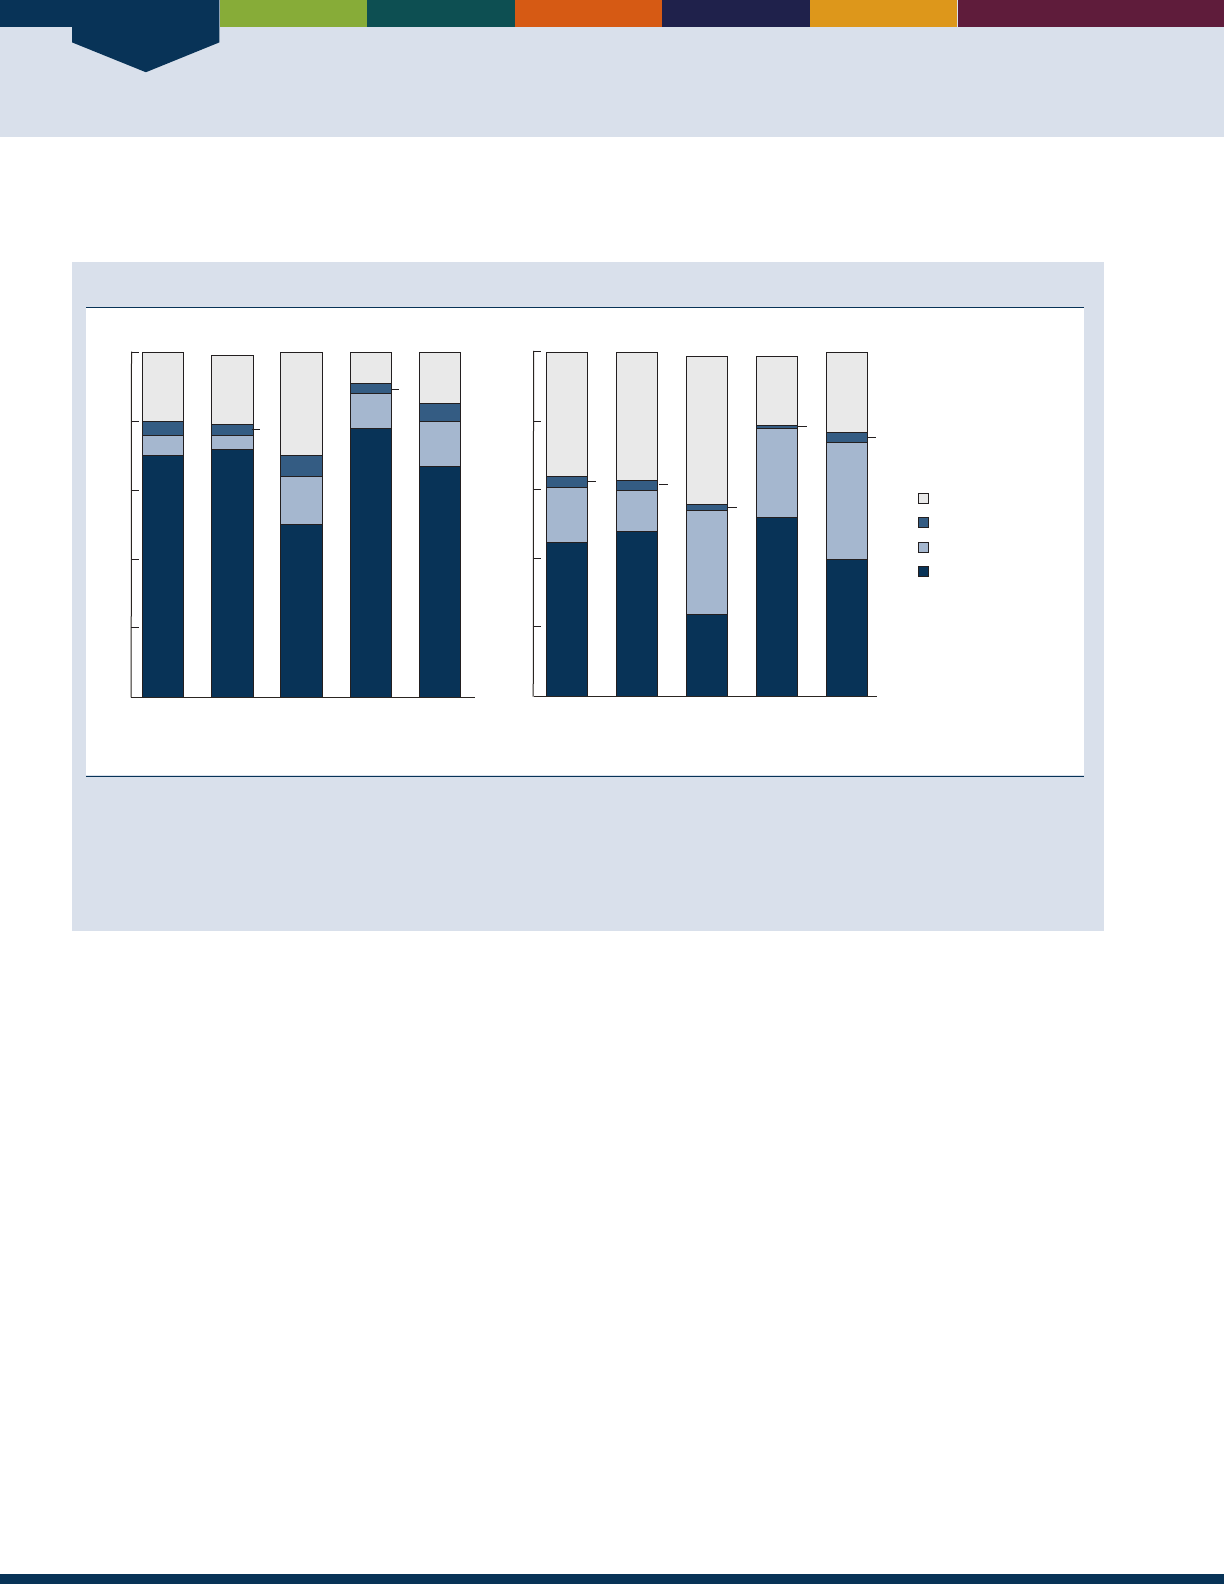
Population
8
INDICATOR 5: Living Arrangements
e living arrangements of America’s older population are linked to income, health status, and the availability of caregivers.
Living arrangements of the population age 65 and over, by sex and race and Hispanic origin, 2015
Total Non-
Hispanic
White alone
Black
alone
Asian
alone
Hispanic
(of any
race)
Men
Women
Total Non-
Hispanic
White alone
Black
alone
Asian
alone
Hispanic
(of any
race)
70
4
20
6
72
20
4
50
6
30
14
78
10
10
67
5
15
13
45
36
16
48
37
12
24
43
30
52
20
26
40
23
34
2
3
3
3
3
1
3
Percent
0
20
40
60
80
100
Percent
0
20
40
60
80
100
With other relatives
With spouse
With nonrelatives
Alone
NOTE: Living with other relatives indicates no spouse present. Living with nonrelatives indicates no spouse or other relatives present. The
term “non-Hispanic White alone” is used to refer to people who reported being White and no other race and who are not Hispanic. The term
“Black alone” is used to refer to people who reported being Black or African American and no other race, and the term “Asian alone” is used to
refer to people who reported only Asian as their race. The use of single-race populations in this chart does not imply that this is the preferred
method of presenting or analyzing data. The U.S. Census Bureau uses a variety of approaches.
Reference population: These data refer to the civilian noninstitutionalized population.
SOURCE: U.S. Census Bureau, Current Population Survey, Annual Social and Economic Supplement.
• In 2015, older men were more likely to live with their
spouse than were older women. About 70 percent of
older men lived with their spouse, while less than half
(45 percent) of older women did. In contrast, older
women were more likely than older men to live alone
(36 percent versus 20 percent).
• Living arrangements of older people diered by race
and Hispanic origin. Older Black, Asian, and Hispanic
women were more likely than non-Hispanic White
women to live with relatives other than a spouse. For
example, in 2015, 26 percent of older Asian women,
30 percent of older Black women, and 34 percent
of older Hispanic women lived with other relatives,
compared with only 12 percent of older non-Hispanic
White women. e percentages of Asian and Black
women were not dierent.
• Older non-Hispanic White women and Black women
were more likely than women of other races to live
alone. In 2015, 37 percent of non-Hispanic White
and 43 percent of Black women lived alone, compared
with about 20 percent for older Asian women and
23percent for older Hispanic women. epercentages
of older Asian and older Hispanic women living alone
were not dierent.
• e percentage of older Black men living alone was
about three times as high as the percentage of older
Asian men (30 percent versus 10percent). e
percentage of older Black men living alone was also
higher than that of older non-Hispanic White men
(20percent).
• Older Hispanic and Black men were more likely
(13and 14 percent, respectively, which did not dier)
than non-Hispanic White men (4 percent) to live
with relatives other than a spouse. e percentage
of Asian men living with relatives other than a
spouse (10percent) was lower than the percentages
for Hispanic and Black men and higher than the
percentages for non-Hispanic Whitemen.
All comparisons presented for this indicator are signicant at
the 0.10 condence level. Data for this indicator’s charts and
bullets can be found in Tables 5a and 5b on page 90.
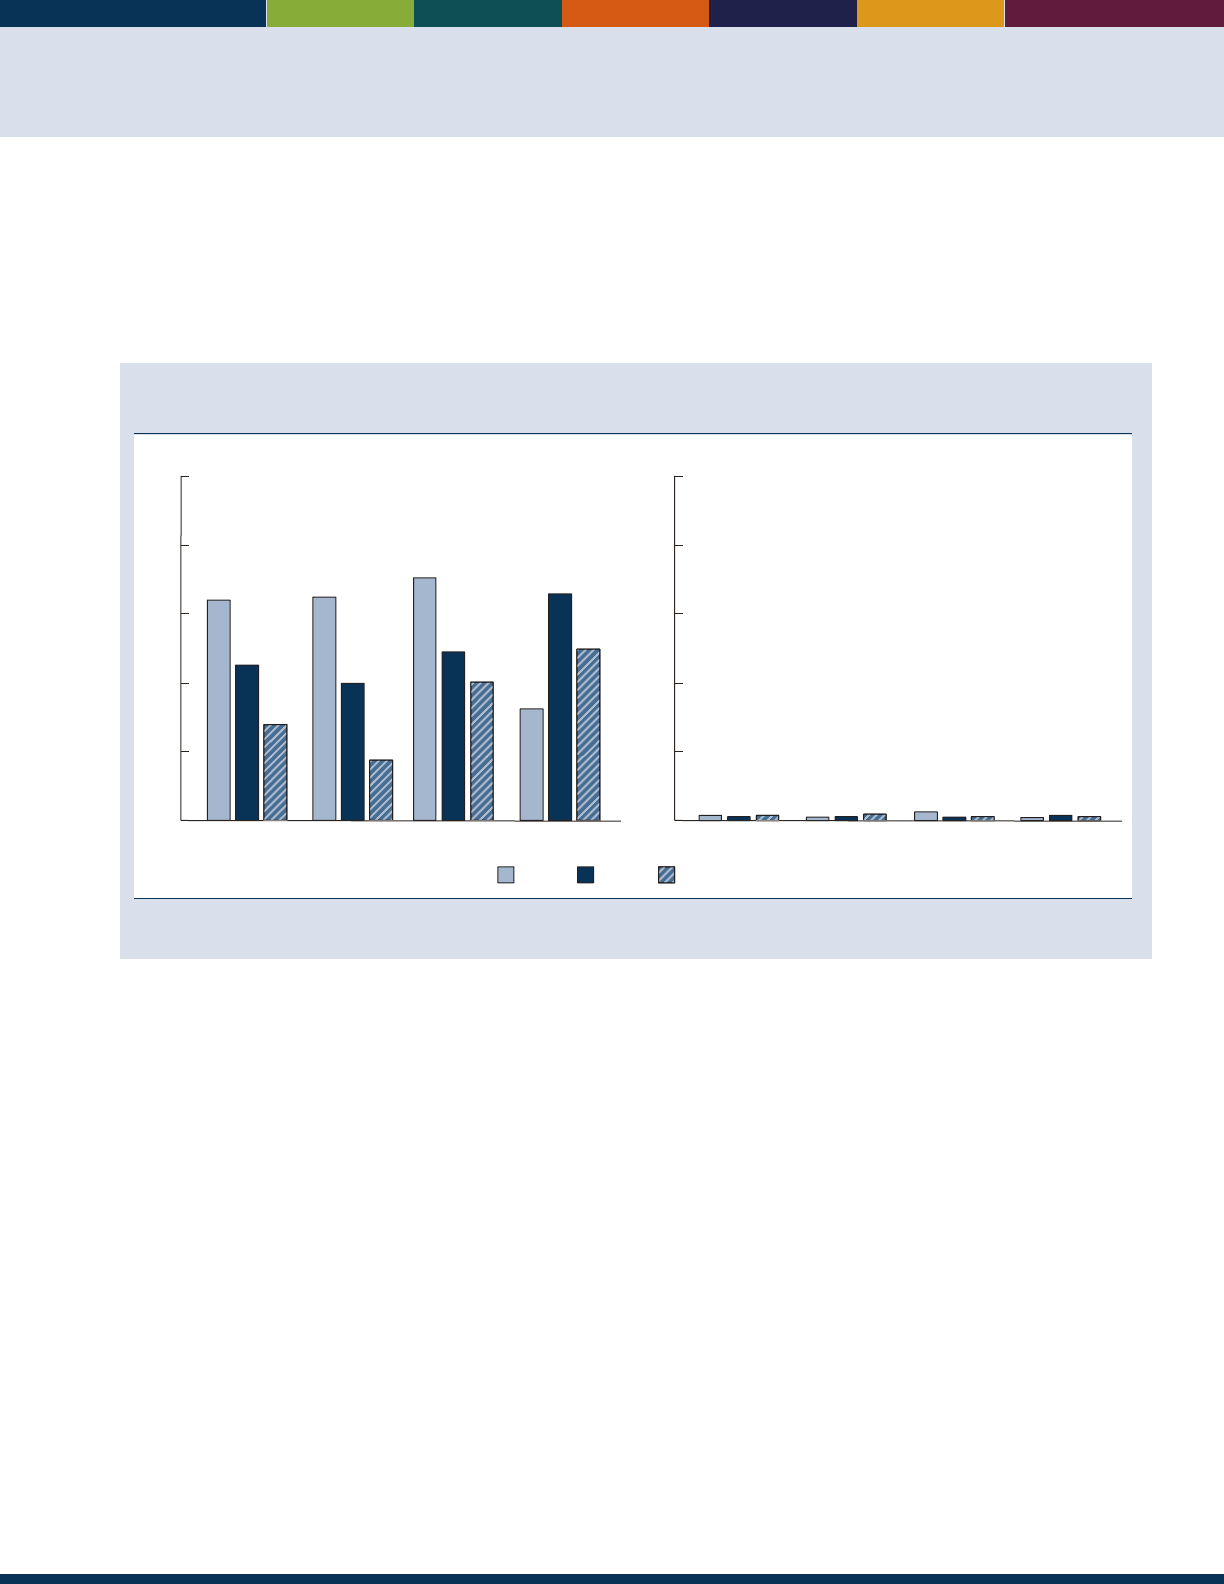
9
INDICATOR 6: Older Veterans
Veteran status among America’s older population is associated with higher median family income, lower percentages
of individuals who are uninsured or covered by Medicaid, higher percentages of functional limitations in activities of
daily living or instrumental activities of daily living, greater likelihood of having any disability, and less likelihood of
rating their general health status as good or better.
6
e oldest segment of the veteran population will continue to have
signicant ramications with regard to the demand for health care services, particularly in the area of long-term care.
7
Percentage of population age 65 and over who are veterans, by sex and age group, 2000, 2015,
and projected 2025
100
Percent
80
60
40
20
0
Men
12
64
45
28
65 and over
65
40
18
65−74
71
49
41
75−84
33
66
50
85 and over
Women
100
Percent
80
60
40
20
0
65 and over 65−74 75−84 85 and over
2
1
22
11
3
11
2
11
2025 (projected)20152000
Reference population: These data refer to the resident population of the United States and Puerto Rico.
SOURCE: U.S. Census Bureau, Population Projections 2014, and
2010 Census Summary File 1;
Department of Veterans Affairs, VetPop2014.
• In 2015, there were 9.9 million veterans age 65
and over in the United States and Pueto Rico.
Approximately one out of every two men age 65 and
over in 2015 were veterans.
• More than 95 percent of veterans age 65 and over are
male. Over time, the number of male veterans age
65 and over will go from 9.4 million in 2000 to a
projected 9.0 million in 2020.
• e number of men age 85 and over who are veterans
increased from 400,000 in 2000 to over 1.4 million
in 2015. e proportion of men age 85 and over who
are veterans increased from 33 percent in 2000 to 66
percent in 2015.
• Between 2000 and 2010, the number of female
veterans age 85 and over increased from about 30,000
to 97,000 but is projected to decrease to 56,000 by
2025.
Data for this indicator’s charts and bullets can be found in
Tables 6a and 6b on page 91.

10

Economics
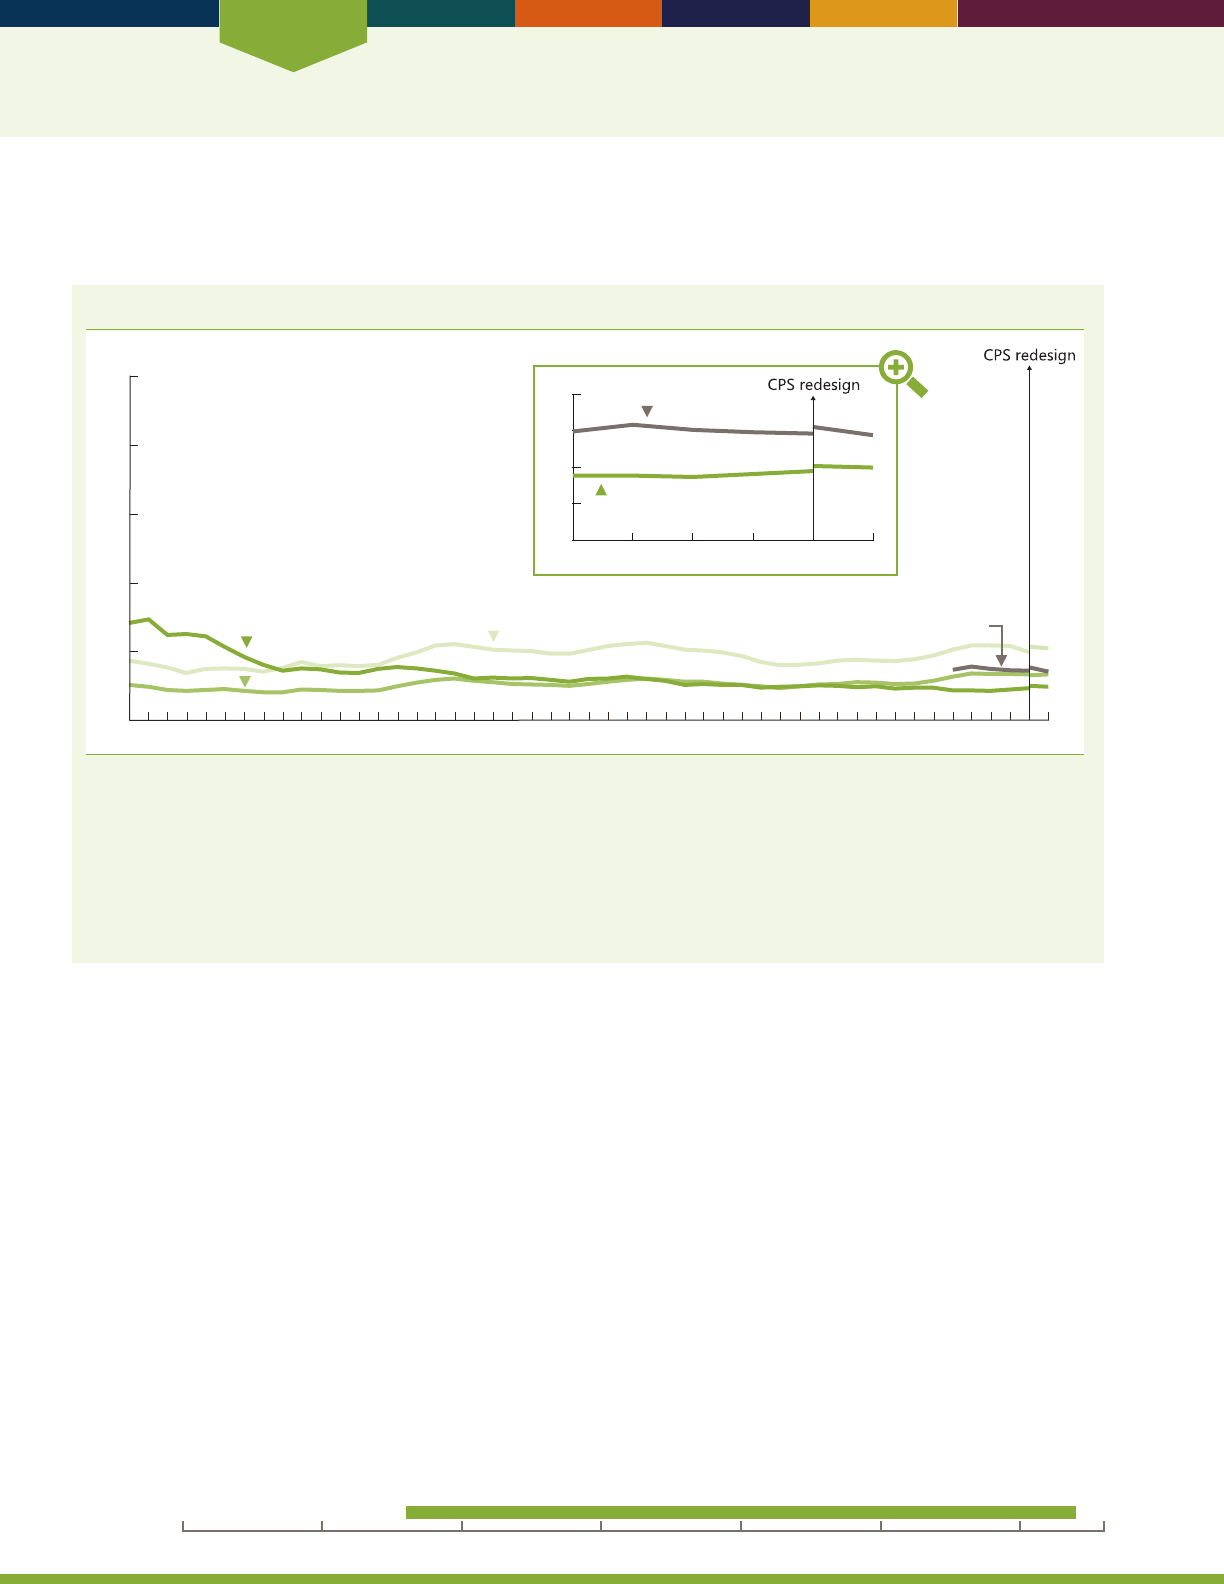
Economics
12
INDICATOR 7: Poverty
Poverty rates are one way to evaluate economic well-being. People identied as living in poverty are at risk of having
inadequate resources for food, housing, health care, and other needs.
Poverty rate by age, by ofcial poverty measure and Supplemental Poverty Measure, 1966–2014
Percent
0
20
40
60
80
100
1966 1970 1975 1980 1985 1990 1995 2000 2005 2014
65 and over
Under 18
18–64
2010
2009 2010 2011 2012 2013 2014
0
5
10
15
20
65 and over SPM
65 and over
65 and over SPM
NOTE:
Poverty status in the Current Population Survey (CPS) is based on prior year income. The source of the 2013 estimates shown in this gure
is the portion of the CPS Annual Social and Economic Supplement (ASEC) sample which received the redesigned income questions. The 2013
estimates from the traditional ASEC can be found in Table 7a. For further information on the redesigned income questions and the Supplemental
Poverty Measure (SPM), see NOTE for Table 7a. The ofcial poverty measure is based on money income and does not include noncash benets
such as food stamps. Poverty thresholds reect family size and composition and are adjusted each year using the annual average Consumer Price
Index. For more detail, see U.S. Census Bureau Series P-60, No. 252. The SPM extends the ofcial poverty measure by taking account of many of
the government programs designed to assist low income families and individuals that are not included in the current ofcial poverty measure and
by using thresholds derived from the Consumer Expenditure Survey by the Bureau of Labor Statistics.
Reference population: These data refer to the civilian noninstitutionalized population.
SOURCE: U.S. Census Bureau, Current Population Survey, Annual Social and Economic Supplement.
• In 1966, 29 percent of people age 65 and over lived
below the poverty threshold. By 2014, the proportion
of the older population living in poverty had decreased
dramatically to 10 percent.
• Relative levels of poverty among the dierent age groups
have changed over time. In 1966, older people had the
highest poverty rate (29 percent), followed by children
(18 percent) and those in the working ages (11 percent).
By 2014, the proportions of the older population and
of those of working age living in poverty were about 10
percent and 14 percent, respectively, while 21 percent
of children lived in poverty. e poverty rate for older
people in 2014 was not dierent from the poverty rate for
people of working age in 1966.
• Poverty rates diered by age and sex among the older
population. Older women (12 percent) were more likely
than older men (7 percent) to live in poverty in 2014.
People ages 65–74 had a poverty rate of 9percent,
compared with 12 percent of those age 75and over.
• Race and ethnicity are related to poverty among older
men. In 2014, older non-Hispanic White men were less
likely than older Black men, older Hispanic men, and older
Asian men to live in poverty; 5 percent compared with 17
percent for older Black men, 16percent for older Hispanic
men, and 13 percent for older Asian men. e poverty
rates for older Black men, older Hispanic men, and older
Asian men were not statistically dierent from each other.
• Older non-Hispanic White women (10 percent) were
less likely than older Black women (21 percent), older
Hispanic women (20 percent), and older Asian women
(16 percent) to live in poverty. e poverty rates for older
Black women, older Hispanic women, and older Asian
women were not statistically dierent from each other.
• In 2014, poverty rates for those 65 years and over were
higher under the Supplemental Poverty Measure (14
percent) compared with the ocial measure (10percent).
All comparisons presented for this indicator are signicant at the
0.10 condence level. Data for this indicator’s charts and bullets
can be found in Tables 7a and 7b on pages 92–93.
20162000 201019901980197019601950
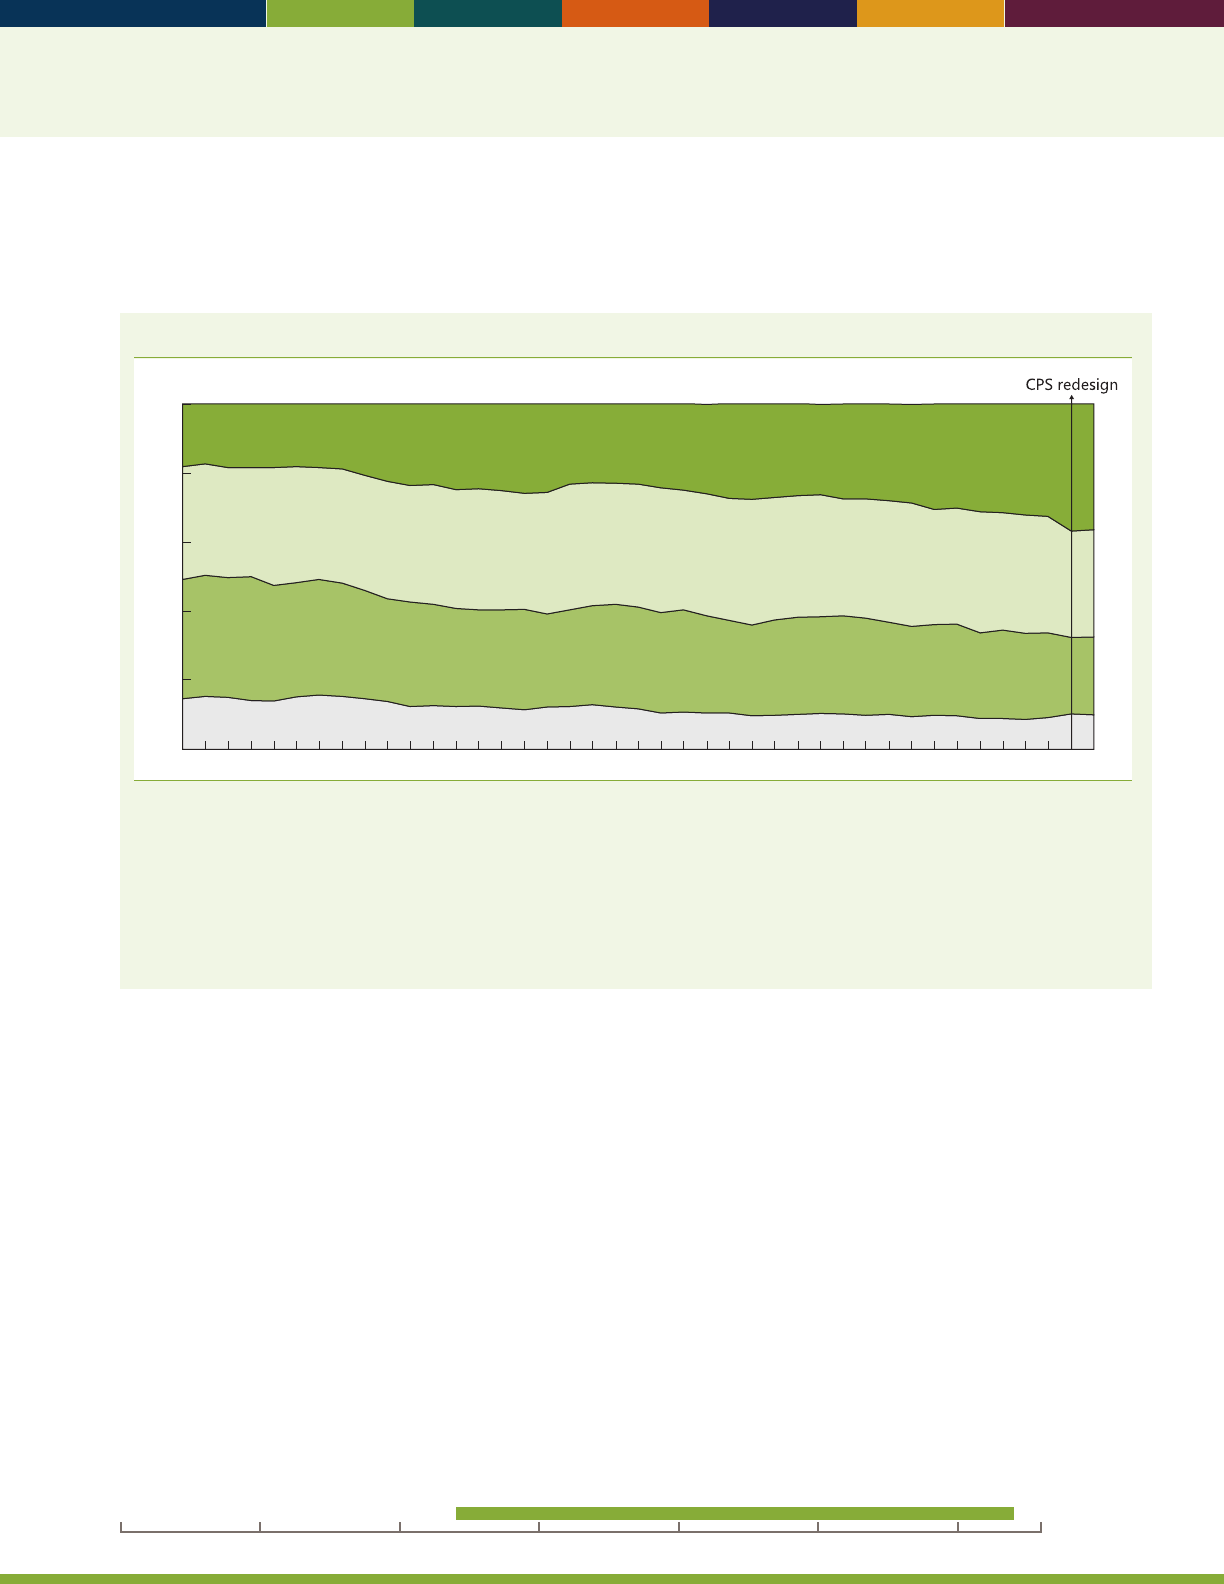
13
INDICATOR 8: Income
e percentage of people living below the poverty line does not give a complete picture of the economic situation
of older Americans. Examining the income distribution of the population age 65 and over and their median income
provides additional insights into their economic well-being.
Income distribution of the population age 65 and over, 1974–2014
1974 1980 1985 1990 1995 2000 2005 20142010
Percent
0
20
40
60
80
100
High income
Middle income
Low income
Poverty
NOTE: Income distribution in the Current Population Survey (CPS) is based on prior year income. The source of the 2013 estimates shown in
this gure is the portion of the CPS Annual Social and Economic Supplement (ASEC) sample that received the redesigned income questions.
The 2013 estimates for the portion of the sample that received the traditional ASEC income questions can be found in Table 8a. For further
information on the redesigned income questions see the NOTE for Table 8a. The income categories are derived from the ratio of the family’s
income (or an unrelated individual’s income) to the corresponding ofcial poverty threshold. Being in poverty is measured as income less than
100 percent of the poverty threshold. Low income is between 100 and 199 percent of the poverty threshold. Middle income is between 200
percent and 399 percent of the poverty threshold. High income is 400 percent or more of the poverty threshold. Some data have been revised
and differ from previous versions of
Older Americans.
Reference population: These data refer to the civilian noninstitutionalized population.
SOURCE: U.S. Census Bureau, Current Population Survey, Annual Social and Economic Supplement.
• Since 1974, the proportion of older people living in
poverty and in the low income group has generally
declined; as a consequence, by 2014, 10 percent of the
older population lived in poverty and 23 percent of the
olderpopulation was in the low income group.
• In 2014, people in the high income group made up
the largest share of older people by income category
(36 percent). e proportion with a high income
has increased over time. e proportion of the older
population in the middle income group decreased
from33 percent in 1974 to 31 percent in 2014.
• e trend in median household income of the older
population also has been positive. In 1974, the median
household income for householders age 65 and over
was $22,921, when expressed in 2014 dollars. By 2014,
the median household income of the older population
had increased to$36,895.
Data for this indicator’s charts and bullets can be found in
Tables 8a and 8b on pages 94–95.
20162000 201019901980197019601950
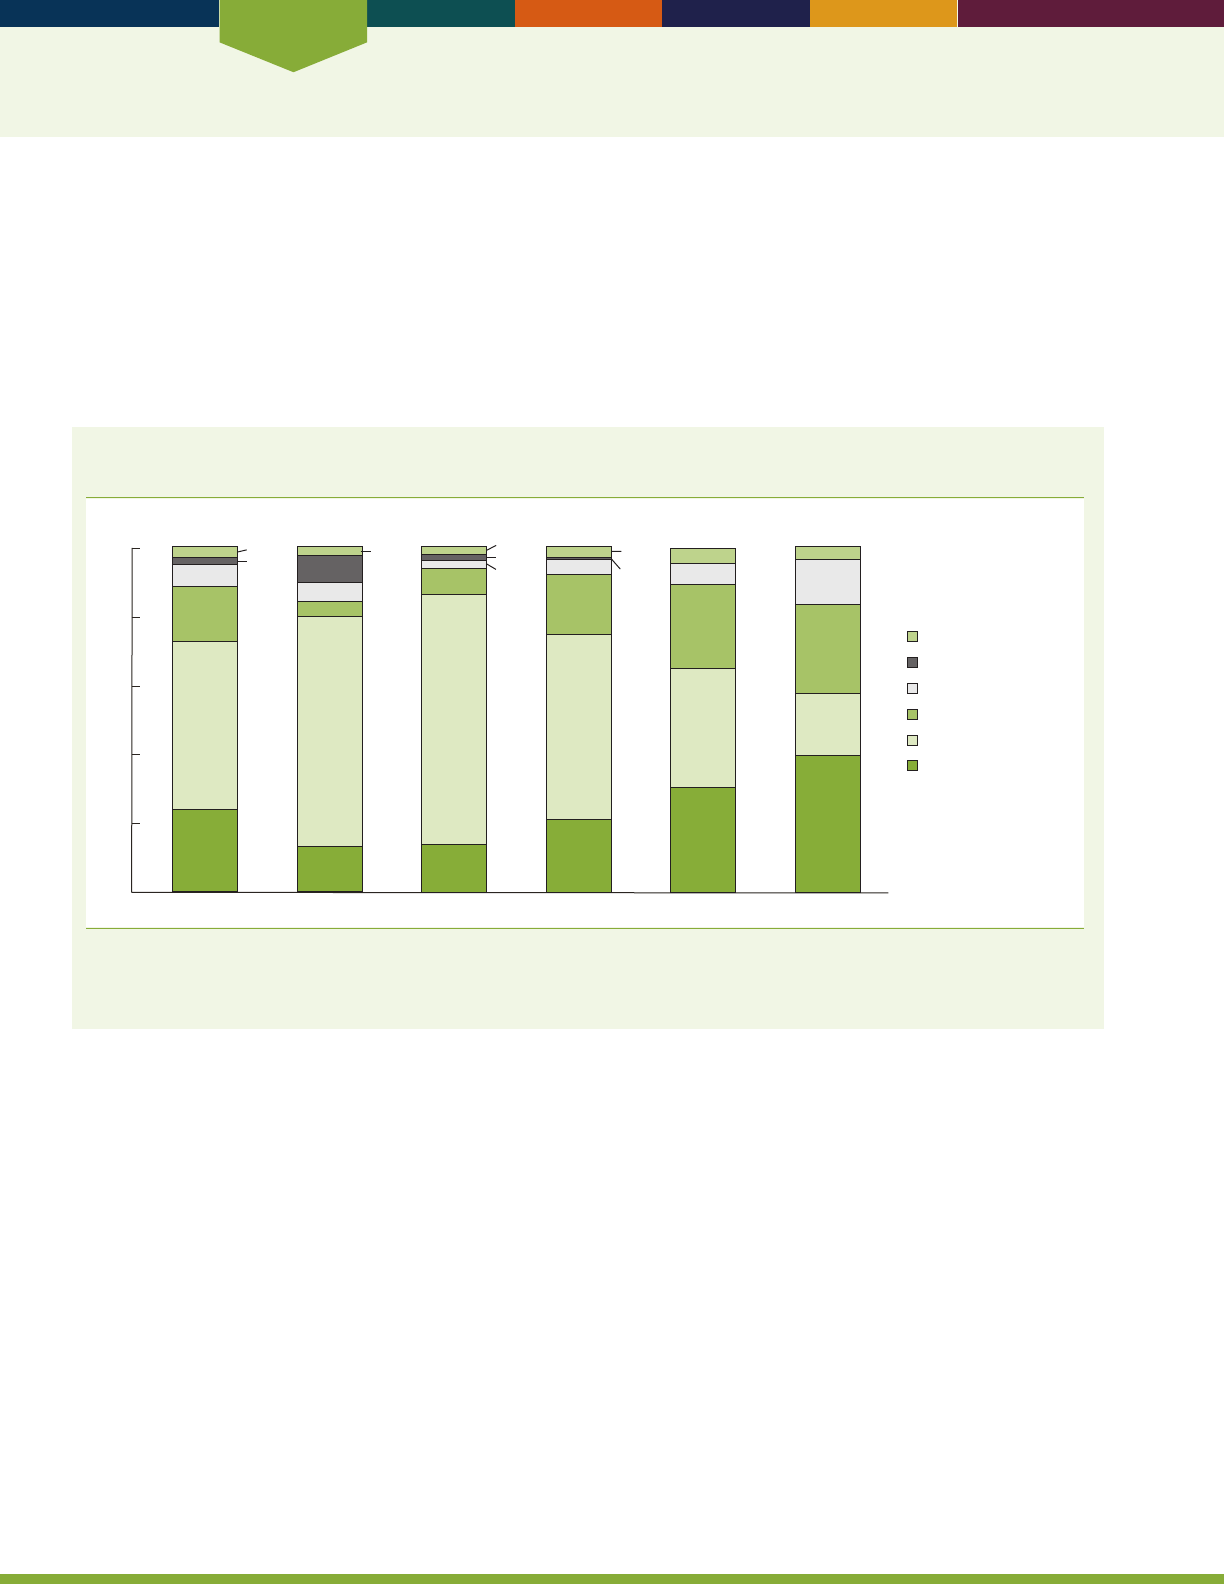
Economics
14
INDICATOR 9: Sources of Income
Most older Americans are retired from full-time work. Social Security was developed as a oor of protection for their
incomes, to be supplemented by other pension income, income from assets, and, to some extent, continued earnings.
Over time, Social Security has taken on greater importance to older Americans.
Since the early 1960s, Social Security has provided the largest share of aggregate income for older Americans.
8
e share
of income from pensions increased rapidly in the 1960s and 1970s, peaked in 1992, and has uctuated since then at
around one-fth of aggregate income.
8
Asset income generally decreased while earnings generally increased after the
mid-1980s.
8
Percentage distribution of per capita family income for persons age 65 and over, by income
quintile and source of income, 2014
Total Lowest fifth Second fifth Third fifth Fourth fifth Highest fifth
0
20
40
60
80
100
Percent
2
0.6
49
16
6
24
67
6
8
13
4
2
72
8
14
2
2
54
17
4
21
34
24
6
5
30
18
26
13
4
40
3
3
3
Earnings
Social Security
Pensions
Asset income
Cash public assistance
Other
NOTE: The denition of “other” includes, but is not limited to, unemployment compensation, workers’ compensation, veterans’ payments, and
personal contributions. Quintile limits are $12,492, $19,245, $29,027, and $47,129. Estimates may not sum to the totals because of rounding.
Reference population: These data refer to the civilian noninstitutionalized population.
SOURCE: U.S. Census Bureau, Current Population Survey, Annual Social and Economic Supplement.
• In 2014, most persons (86 percent) age 65 and over
lived in families with Social Security income. About
two-fths (41 percent) lived in families with private
pensions or annuities, while almost a fth (18 percent)
lived in families with other public pensions. Two-thirds
(67 percent) lived in families with income from assets.
Two-fths (40 percent) lived in families with earnings,
and about one-tenth (13 percent) were in families
receiving public assistance (cash and noncash) with
other income sources. One-tenth (13 percent) were in
families receiving income from other sources.
• e proportion of per capita family income of persons
age 65 and over from specied sources varied across
major sources and levels of income. Overall, Social
Security accounted for 49 percent of per capita family
income. For those in the lowest quintile of income,
Social Security accounted for two-thirds and earnings
accounted for about one-tenth (13 percent) of per
capita family income. For those in the highest income
quintile, Social Security accounted for one-fth
(18percent) of per capita family income, pension
income accounted for one-quarter, and earnings
accounted for about two-fths.
• For those age 80 and over, a larger percentage lived
in families with Social Security income (90 percent,
including families of one) and a smaller percentage
(23percent) had earnings than did the population
age65–69.
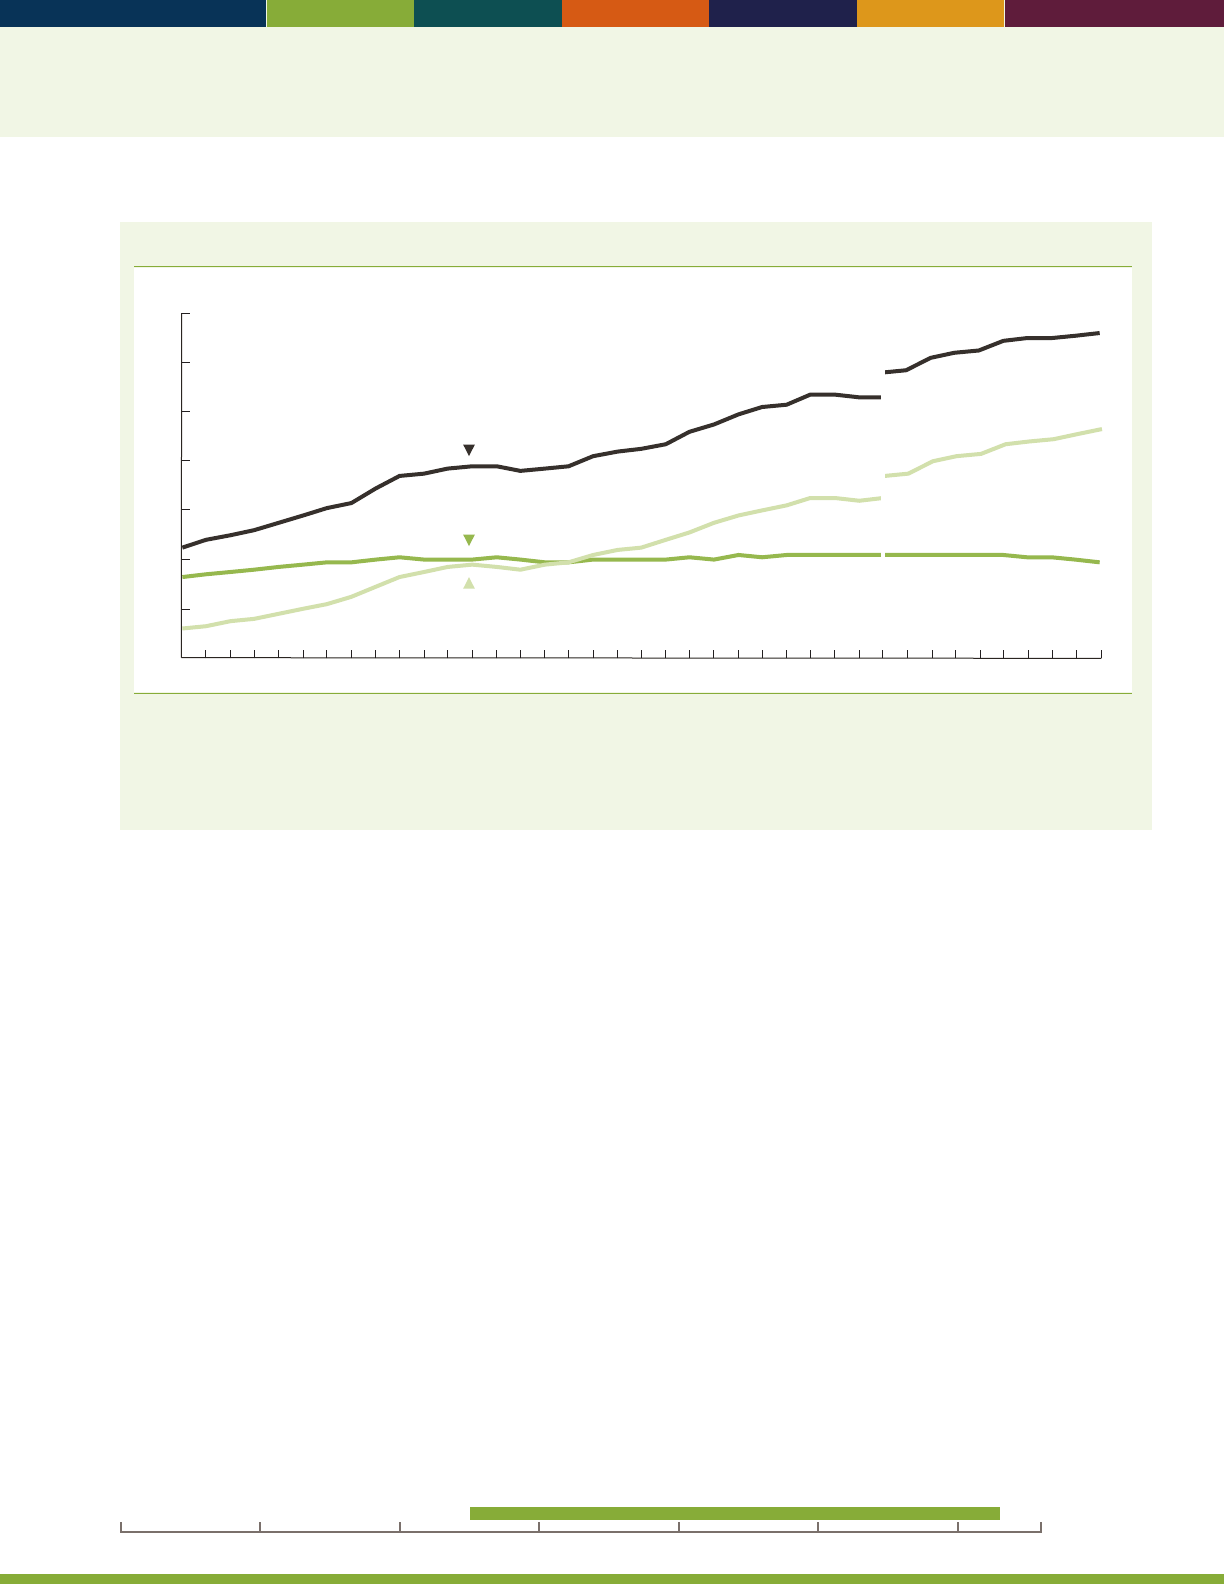
15
Number of participants in private pension plans, by type of plan, 1975–2013
Number (in millions)
0
20
40
60
80
100
120
140
Total
Defined Benefit
Defined Contribution
1980 1985 1990 1995 2000 2005 20101975 2013
NOTE: The methodology for calculating participants was changed beginning with the 2005 Form 5500 series in response to the discontinuance
of the IRS Form 5500 Schedule T. For 2004, the revision increases counts of participants by 9 million. Under the current methodology,
participant counts include all workers eligible to participate in a plan. The term “participants” refers to active, retired, and separated vested
participants not yet in pay status. Workers participating in more than one plan are counted separately for each plan in which they participate.
Reference population: These data refer to counts of participants reported by private pension plans on the Form 5500.
SOURCE: U.S. Department of Labor, Employee Benets Security Administration, Form 5500 lings.
• Retirement savings held in private sector employer-
sponsored retirement plans are an important source of
income for older Americans. Over time, the number
of participants in such plans has grown along with the
rising number of participants in dened contribution
plans such as 401(k) plans. However, the number
of participants in traditional dened benet plans
in the private sector has remained steady, while the
proportion of these participants that are either retired
or separated from their employer has been increasing.
• A growing share of the participants in dened benet
plans participate in hybrid dened benet plans, like
cash balance plans, that have some characteristics
that are similar to dened contribution plans. Among
dened benet plan participants, the share in plans
that are cash balance plans has risen from less than
15percent in 1999 to over 30 percent in 2013.
• Out of the 93 million participants in private sector
employer-sponsored dened contribution plans in
2013, about 77 million were in 401(k)-type plans.
Among participants in 401(k)-type plans, the share in
plans that allow participants to direct all or a portion
oftheir investments has risen from 85 percent in 1999
to 97 percent in 2013.
• Private sector workers most commonly have access
to only a dened contribution plan, while state and
local government workers most commonly have access
to only a dened benet plan. Among private sector
workers in 2015, 47 percent had access to only a
dened contribution plan, 14 percent had access to
both a dened benet and a dened contribution plan,
and 4 percent had access to only a dened benet plan.
e rates for state and local government workers were
6percent, 27 percent, and 57 percent, respectively.
Data for this indicator’s charts and bullets can be found in
Tables 9a through 9f on pages 96–100.
20162000 201019901980197019601950
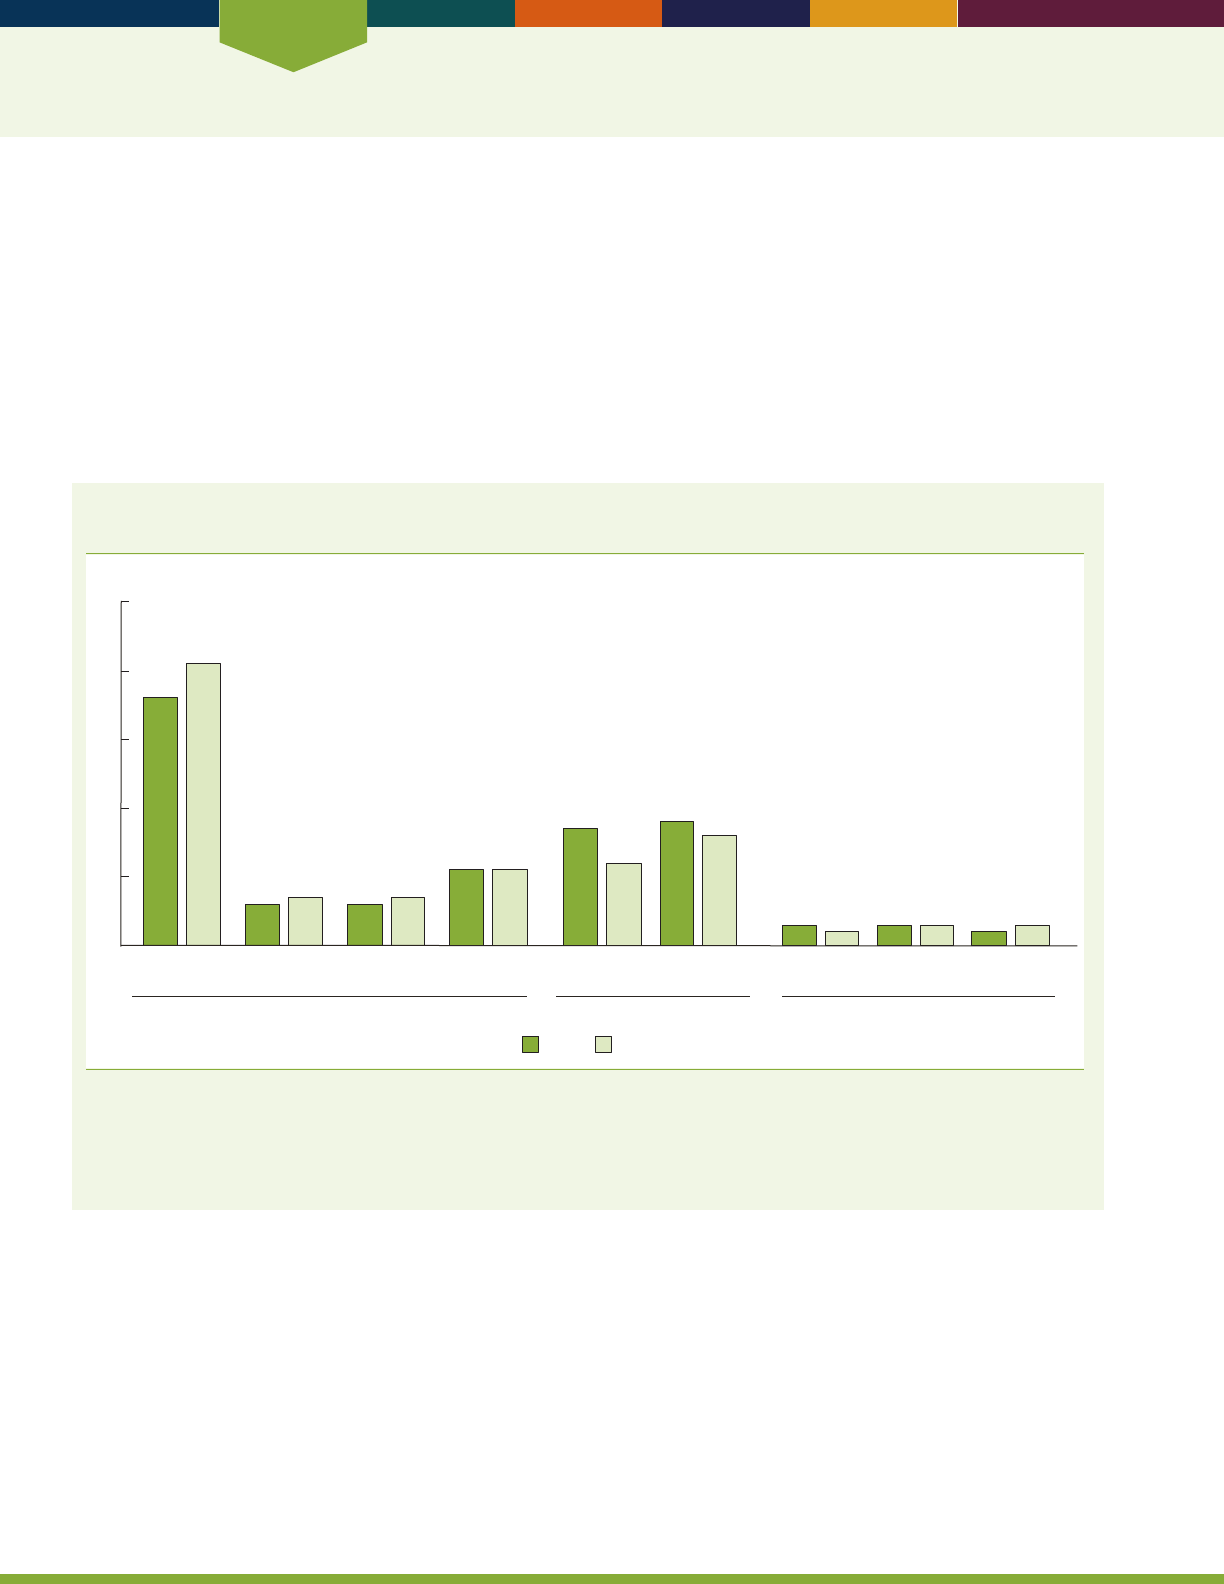
Economics
16
INDICATOR 10: Social Security Beneciaries
Social Security benets provide a baseline for retirement income for the majority of older Americans and are the most
important income source for the aged. In December 2014, 47 million adults age 62 and over received Social Security
benets.
9
About 5.1 million adults ages 62–64 received an average of $1,134 per month in benets and 42 million adults
age 65 and over received an average of $1,309 per month.
In December 2014, most aged beneciaries received retired worker benets (about 60 percent of those ages 62–64 and
86percent of those 65 and over). Social Security provides retired worker benets to workers with full insurance from
work covered by Social Security over a lifetime. Full insurance of the aged usually requires a minimum of 10 years of
covered earnings. About 1.9 million disabled workers ages 62–65 also received benets in 2014, an increase from the
number receiving benets in 2000.
Percentage distribution of people who began receiving Social Security benets in 2014, by age
and sex
Percent
WomenMen
62 63 64 65 66 Disabled Worker
Conversions
a
70 and over
67–69
66
36
41
6
7
6
7
11
11
17
12
18
16
3
3
2
3
3
2
Pre-Full Retirement Age Full Retirement Age Post-Full Retirement Age
0
10
20
30
40
50
a
At Full Retirement Age (FRA), persons formerly receiving disabled worker benets are reclassied and begin receiving retired worker benets.
NOTE: FRA is dened as age 66 for those born between 1943 and 1955. The percentages are not probabilities of a birth cohort claiming at
a particular age. A person begins receiving Social Security benets the month after he or she becomes entitled. Totals may not sum to 100
percent because of rounding.
Reference population: Persons fully insured for Social Security retired worker benets who became entitled to benets in 2014.
SOURCE: Social Security Administration, Master Beneciary Record.
• In 2014, the majority (59 percent) of new Social
Security retired worker beneciaries became entitled
to benets prior to Full Retirement Age (FRA) at age
66 and, thus, started receiving reduced monthly Social
Security benets. Few received a greater amount of
benets by waiting to claim benets until after reaching
FRA. Persons begin receiving benets the month after
entitlement.
• Of new Social Security retired worker beneciaries in
2014, over one-third of men and two-fths of women
became entitled at age 62 and about one-quarter of
men and women became entitled at ages 63–65. In
contrast, 17 percent of men and 12 percent of women
became entitled at FRA, and few (8 percent of both
men and women) became entitled post-FRA.
• Of new Social Security retired worker beneciaries in
2014, 18 percent of men and 16 percent of women
converted from receiving disabled worker benets to
receiving retired worker benets.
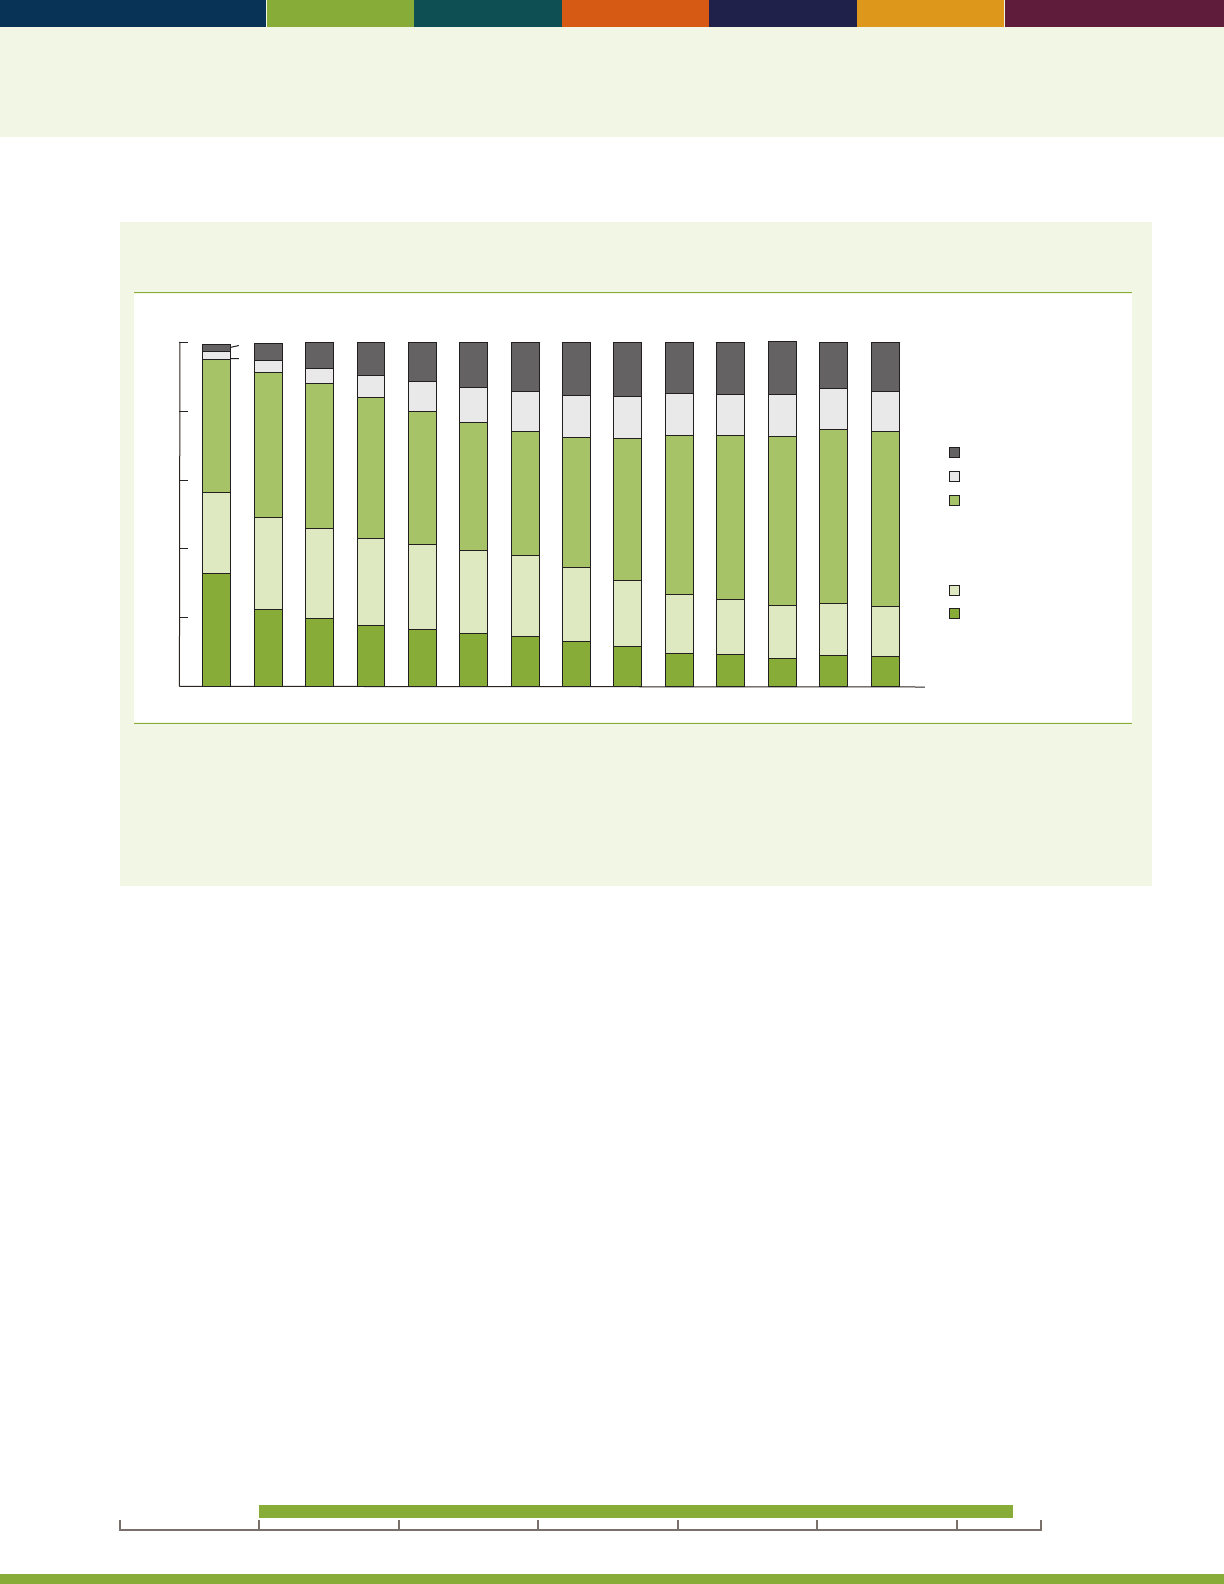
17
Percentage distribution of female Social Security beneciaries age 62 and over, by type of benet
received, selected years 1960–2014
0
20
40
60
80
100
Percent
1960
23
39
33
2
2
1970
27
42
22
5
3
1975
26
42
20
7
4
1980
25
41
18
10
6
1985
25
39
16
12
9
1990
24
37
15
13
10
1995
24
36
14
14
12
2000
22
38
13
16
12
2005
19
41
11
16
12
2010
17
46
10
16
12
2011
16
48
9
15
12
2012
15
49
8
15
12
2013
15
50
9
12
12
2014
14
51
9
15
12
Spouse only
Widow only
b
Worker only
Dually entitled spouse
Dually entitled widow
Worker benefits
a
Spouse or widow
benefit only
a
Worker benets include retired and disabled worker benets.
b
Widow-only beneciaries include disabled workers and mothers of surviving children under age 19.
NOTE: All data for 2005 and dual-entitlement data for 1995 and 2000 are based on a 10 percent sample of administrative records. All other
estimates are based on 100 percent of available data. Benets exclude special age-72 beneciaries and disabled adult children and include
disabled workers. Totals may not sum to 100 percent because of rounding.
Reference population: These data refer to the civilian noninstitutionalized population.
SOURCE: Social Security Administration, Master Beneciary Record.
• In 2014, 77 percent of women beneciaries age 62and
over received earned worker benets.
• e remaining portion of women (23 percent) received
benets only as the spouse or surviving widow of an
entitled worker. In 2014, about 9 percent of women
received spouse-only benets and 14 percent received
widow-only benets.
• Women entitled to their own earned worker benets
and to higher auxiliary benets, such as spouse or
widow benets, are considered dually entitled. Of
female Social Security beneciaries age 62 and over in
2014, about 51 percent received only earned worker
benets, 12 percent received both earned worker and
spouse benets, and 15 percent received both earned
worker and widow benets.
• e type of benets received by women age 62 and
over dramatically changed between 1960 and 2014.
e percentage of female Social Security beneciaries
who received spouse-only benets decreased from
33percent to 9percent, and the percentage receiving
widow-only benets decreased from 23 percent to
14percent. In contrast, the percentage of female
Social Security beneciaries who received earned
worker benets increased from 43percent in 1960
to77percent in 2014.
Data for this indicator’s charts and bullets can be found in
Tables 10a and 10b on page 101.
20162000 201019901980197019601950
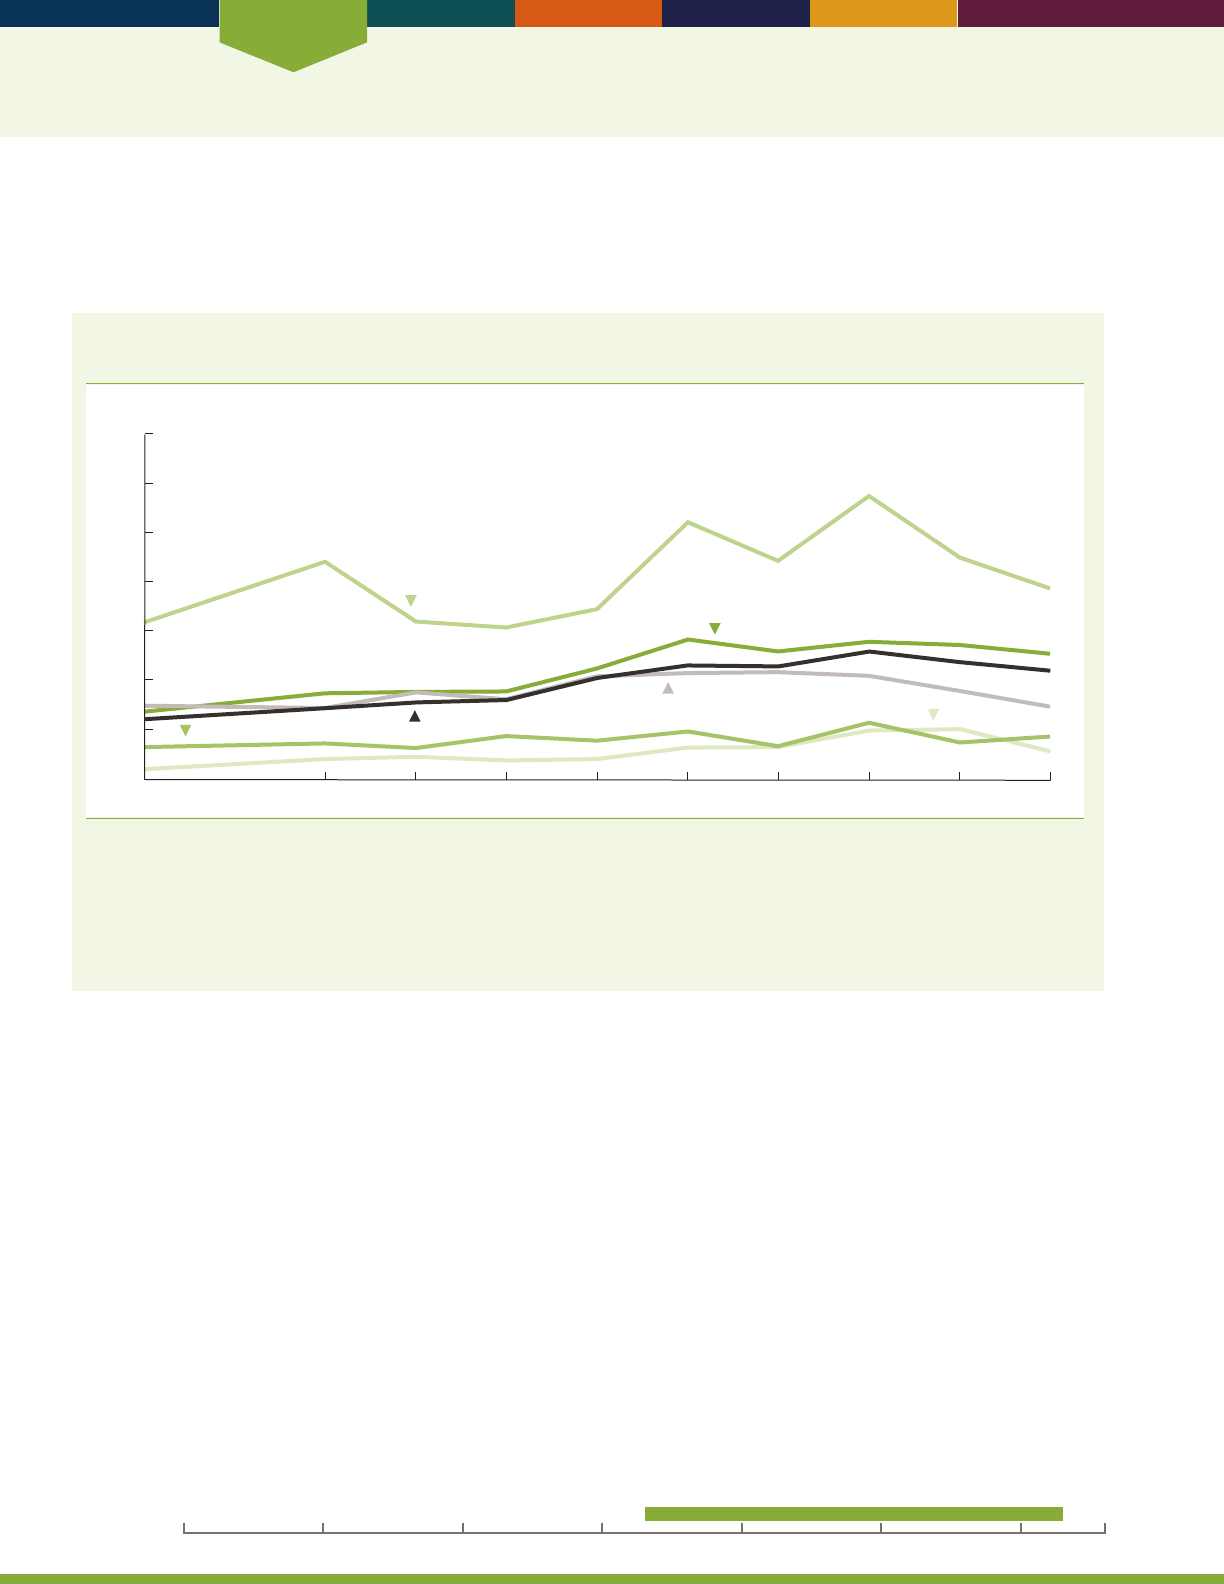
Economics
18
INDICATOR 11: Net Worth
Net worth (the value of real estate, stocks, bonds, retirement investment accounts, and other assets minus debts) is an
important indicator of economic security and well-being. Greater net worth allows a family to maintain its standard of
living when income falls due to job loss, health problems, or family changes such as divorce.
Median household net worth, in 2013 dollars, by race and educational attainment of head of
household age 65 and over, selected years, 1983–2013
Dollars (in thousands)
0
$700
White
Some college or more
High school diploma only
Black
No high school diploma
2013
Total
1983
1989 1992 1995 1998 2001 2004 2007 2010
100
200
300
400
500
600
NOTE: Median net worth is measured in constant 2013 dollars. Net worth includes assets held in investment retirement accounts such as
individual retirement accounts, Keoghs, and 401(k)-type plans. All observations are weighted for analysis. The term “household” in this
indicator is from the codebook of the 2013 Survey of Consumer Finance (www.federalreserve.gov/econresdata/). The data are for the “primary
economic unit” (PEU). The PEU consists of an economically dominant single individual or couple (married or living partners) in a household
and all other members of the household who are nancially interdependent with the individual or couple. In the majority of cases, the PEU and
household are identical.
Reference population: These data refer to the civilian noninstitutionalized population.
SOURCE: Survey of Consumer Finances.
• Overall between 1983 and 2013, the median net
worth, in 2013 dollars (including the value of
retirement investment accounts), of households headed
by people age 65 and over almost doubled, from
$116,500 to $210,500. e rate of change was quite
variable over this time period. e largest increase
was between 1995 and 1998. In addition, there was a
decrease between 2001 and 2004 and between 2007
and 2013.
• Between 1983 and 2013, the median net worth of
households headed by White people age 65 and over
almost doubled, from $137,300 to $255,000. e
median net worth of households headed by Black
people age 65 and over almost tripled over the same
period, increasing from $20,200 to $56,700.
• In 1983, the median net worth of households headed
by White people age 65 and over was almost seven
times that of households headed by Black people
age 65 and over. In 2013, the median net worth of
households headed by older White people was about
four and a half times that of households headed by
older Black people.
• In 2013, the median net worth of households headed
by married people age 65 and over ($319,800)
was more than twice as high as that of households
headed by unmarried people in the same age group
($119,300).
• Between 1983 and 2013, the median net worth of
people age 65 and over either without a high school
diploma or with some college had similar increases
(33percent and 22 percent, respectively). In2013,
households headed by persons age 65 and over who
attended college had a median net worth almost four
and a half times greater than persons without a high
school diploma.
20162000 201019901980197019601950
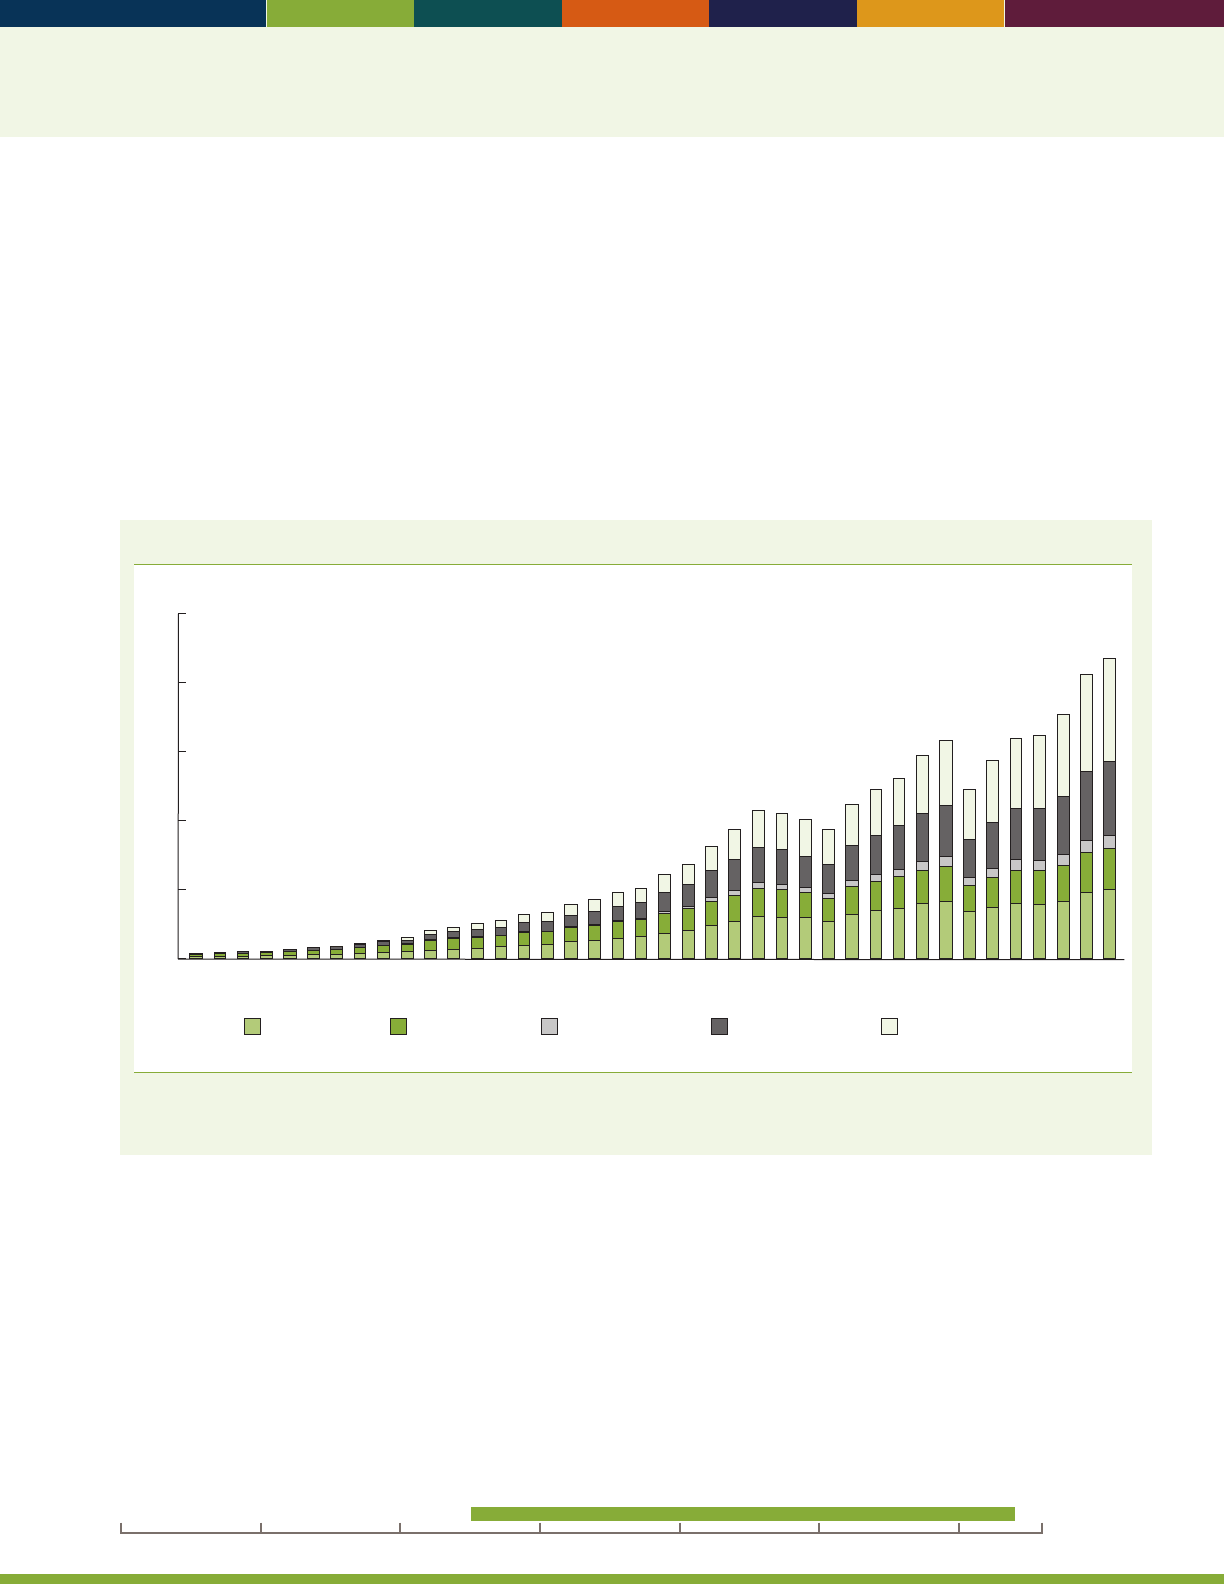
19
• With the shift from traditional dened benet pension
plans to investment retirement accounts such as
401(k)-type Individual Retirement Accounts (IRAs),
nancial assets held in individual retirement accounts
have become prevalent among older Americans. Data
from the Survey of Consumer Finances show public
and private retirement assets for all ages, broken out by
age group. e proportion of American families headed
by people age 65 and over with retirement accounts
to all households headed by people age 65 and over
remained about two-fths in 2007 and 2013.
• e median retirement account value for households
headed by a person age 65 and over almost doubled
between 2007 and 2013, increasing from $68,000
to $118,000. (ese retirement accounts are more
likely to be held by later birth cohorts.) People seldom
withdraw account money as annuity payments or
regular payments; rather, most are taken as ad hoc
distributions. Tax laws require that the account funds
be distributed based on life expectancy beginning in
the year after 70 and a half years of age.
Amount of funds held in retirement assets, by sector and type of plan, 1975–2014
5
10
15
20
$25
Dollars (in trillions)
0
1975
1976
1977
1978
1979
1980
1981
1982
1983
1984
1985
1986
1987
1988
1989
1990
1991
1992
1993
1994
1995
1996
1997
1998
1999
2000
2001
2002
2003
2004
2005
2006
2007
2008
2009
2010
2011
2012
2013
2014
Individual retirement
account
Private defined
contribution plan
Public defined
contribution plan
Private defined
benefit plan
a
Public defined
benefit plan
a
a
Public and private dened benet plans do not include claims of pension funds on sponsor.
Reference population: Public and private retirement assets for total population.
SOURCE: Federal Reserve Board Z.1 Statistical Release for Dec. 10, 2015.
• Retirement savings held in public and private pension
plans or IRAs play a large role in the net worth of older
Americans. In 2014, IRAs held about $7.4 trillion in
assets, public and private dened contribution plans
held about $6.3 trillion in assets, and public and private
dened benet plans held about $8.0 trillion in assets.
• Over time, an increasing proportion of retirement
assets has shifted from traditional dened benet plans
to individual account-based retirement vehicles such
asdened contribution plans and IRAs.
• While dened contribution plans are more commonly
provided in the private sector, dened benet plans
have been largely dominant in the public sector.
Data for this indicator’s charts and bullets can be found in
Tables 11a through 11c on pages 102–104.
20162000 201019901980197019601950
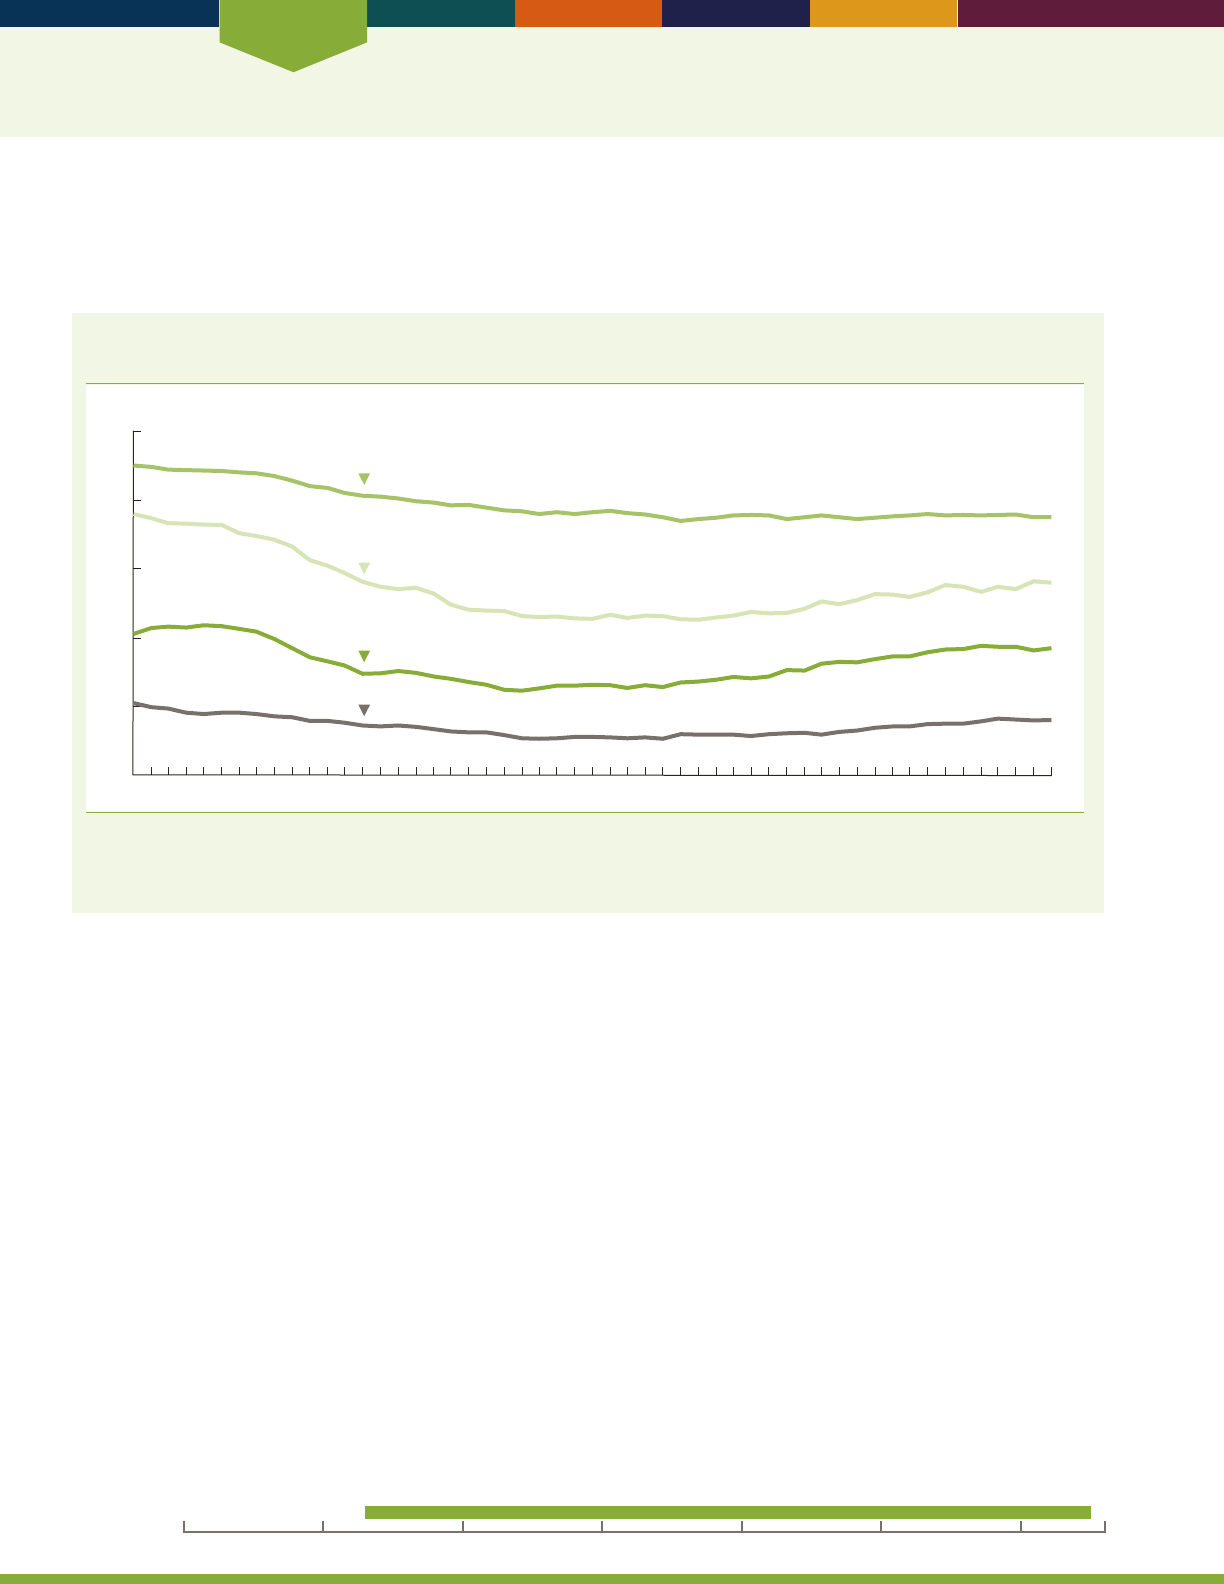
Economics
20
INDICATOR 12: Participation in Labor Force
e labor force participation rate is the percentage of a population that is in the labor force—that is, either working
(employed) or actively looking for work (unemployed). Some older Americans work out of economic necessity. Others
may be attracted by the social contact, intellectual challenges, or sense of value that work often provides.
Labor force participation rates (annual averages) of men age 55 and over, by age group,
1963–2015
Percent
0
20
40
60
80
100
1963 1970 1975 1980 1985 1990 1995 2000 2005 2015
55–61
62–64
65–69
70 and over
2010
NOTE: Data for 1994 and later years are not strictly comparable with data for 1993 and earlier years due to a redesign of the survey and
methodology of the Current Population Survey.
Reference population: These data refer to the civilian noninstitutionalized population.
SOURCE: Bureau of Labor Statistics, Current Population Survey.
• In 2015, the labor force participation rate for men
ages 55–61 was 75 percent, far below the rate in 1963
(90percent). e participation rate for men ages
62–64 declined from 76 percent in 1963 to a low of
45percent in 1995. In 2015, the participation rate for
men ages 62–64 increased to 56 percent.
• Men ages 65–69 also experienced a gradual rise in labor
force participation following a period of decline in the
late 1960s and 1970s. e labor force participation rate
for men ages 65–69 declined from a high of 43 percent
in 1967 to 24 percent in 1985. eir participation rate
from the mid-1980s to the early 1990s remained in the
range of 24 to 26 percent. In the mid-1990s, the labor
force participation rate for men in this age group began
to increase and reached 37 percent in 2011; it has
remained mostly unchanged since then.
• From 1963 to 2015, the participation rate for men age
70 and over showed a somewhat similar pattern as men
ages 65–69. In 1993, the labor force participation rate
for men age 70and over reached a low of 10 percent
after declining from 21 percent in 1963. Since the
mid-1990s, the participation rate for men ages 70 and
over has trended higher but has leveled o in recent
years. e rate was 16 percent in 2015.
20162000 201019901980197019601950
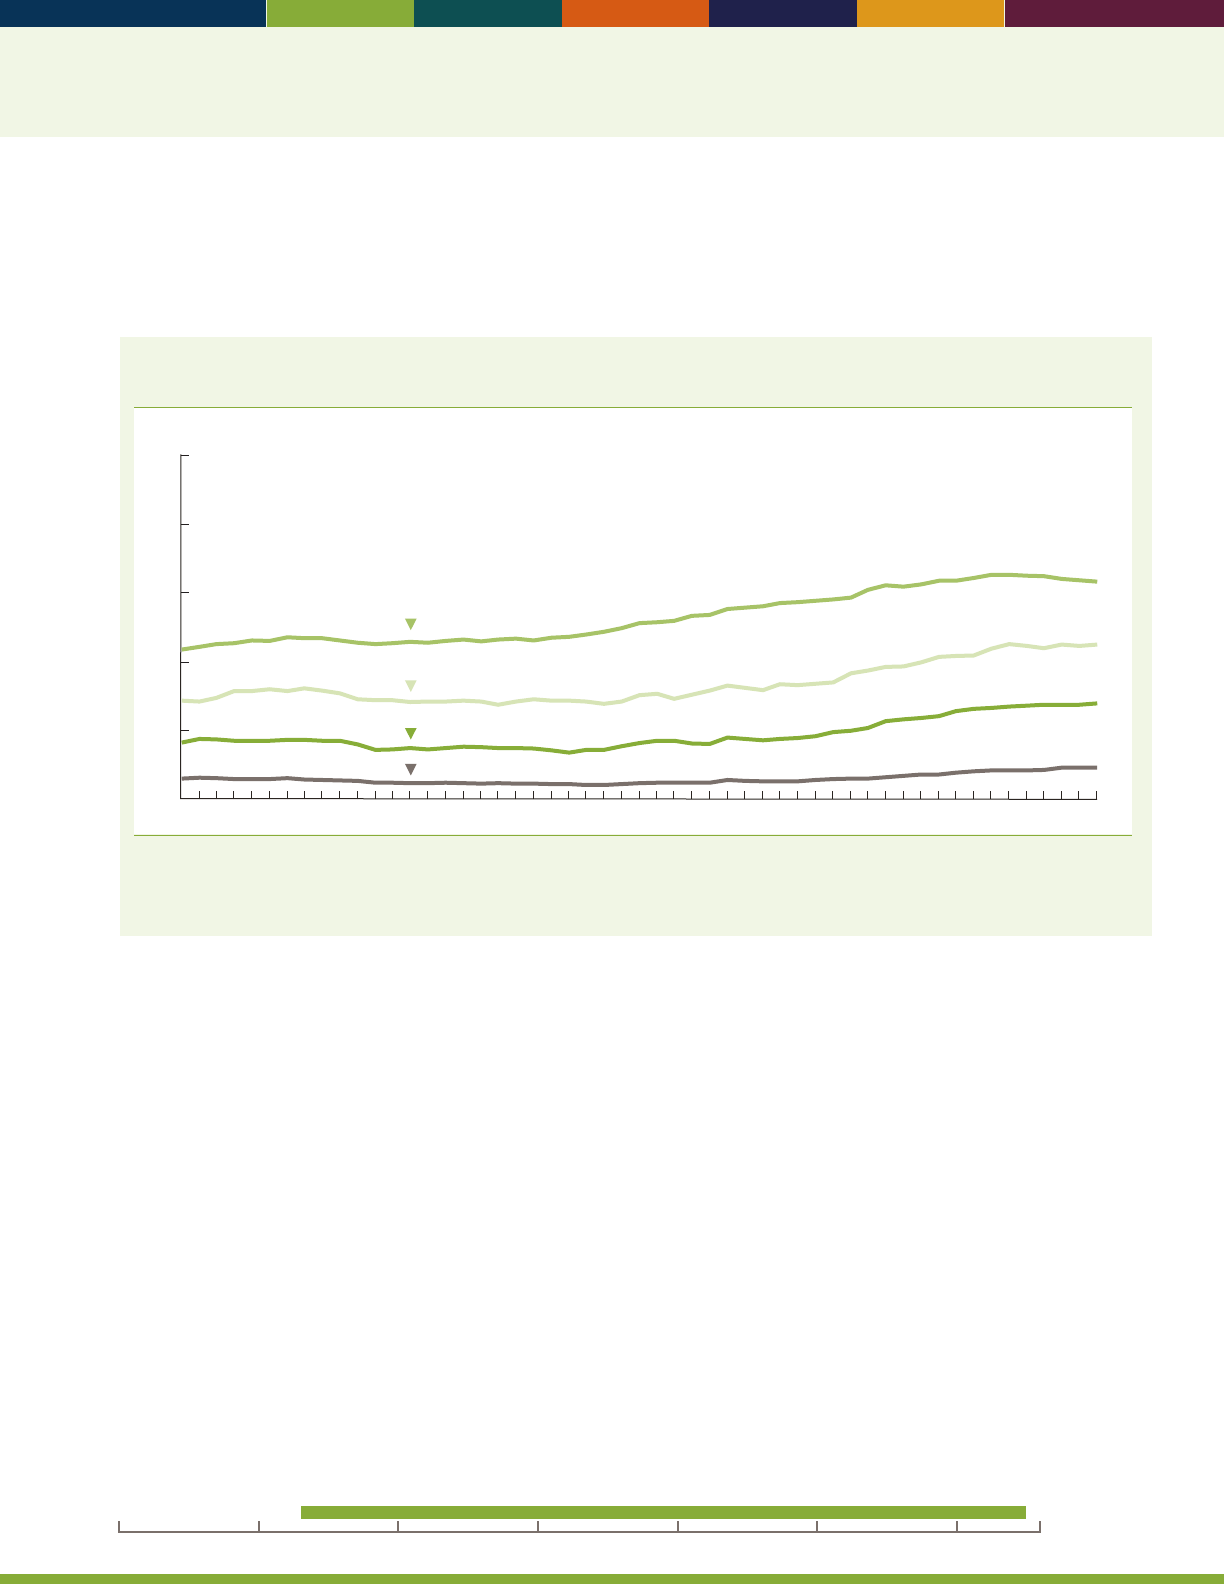
21
e labor force participation rate for older women reects changes in the work experience of successive generations of
women. Many women now in their 60s and 70s did not work outside the home when they were younger, or they moved
in and out of the labor force. As new cohorts of women Baby Boomers approach older ages, they are participating in the
labor force at higher rates than in previous generations.
Labor force participation rates (annual averages) of women age 55 and over, by age group,
annual averages, 1963–2015
Percent
0
20
40
60
80
100
1963 1970 1975 1980 1985 1990 1995 2000 2005 2015
55–61
62–64
65–69
70 and over
2010
NOTE: Data for 1994 and later years are not strictly comparable with data for 1993 and earlier years due to a redesign of the survey and
methodology of the Current Population Survey.
Reference population: These data refer to the civilian noninstitutionalized population.
SOURCE: Bureau of Labor Statistics, Current Population Survey.
• Among women age 55 and over, the labor force
participation rate rose over the past four decades. e
increase has been largest among women ages 55–61,
rising from 44 percent in 1963 to 66 percent in 2010,
with a majority of the increase occurring after 1985.
For women ages 62–64, 65–69, and 70 and over, labor
force participation rates began increasing in the mid-
1980s but have leveled o in recent years.
• In 2015, 64 percent of women ages 55–61 were in the
labor force, compared with 44 percent in 1963. Over
the same period, the labor force participation rate for
women ages 62–64 increased from 29 percent to 45
percent, and the rate for women ages 65–69 increased
from 17 percent to 28 percent.
• e dierence between labor force participation rates
for men and women has narrowed over time. Among
those ages 55–61, for example, the gap between men’s
and women’s rates in 2015 was 11 percentage points,
compared with 46 percentage points in 1963.
Data for this indicator’s charts and bullets can be found in
Table 12 on pages 105–106.
20162000 201019901980197019601950
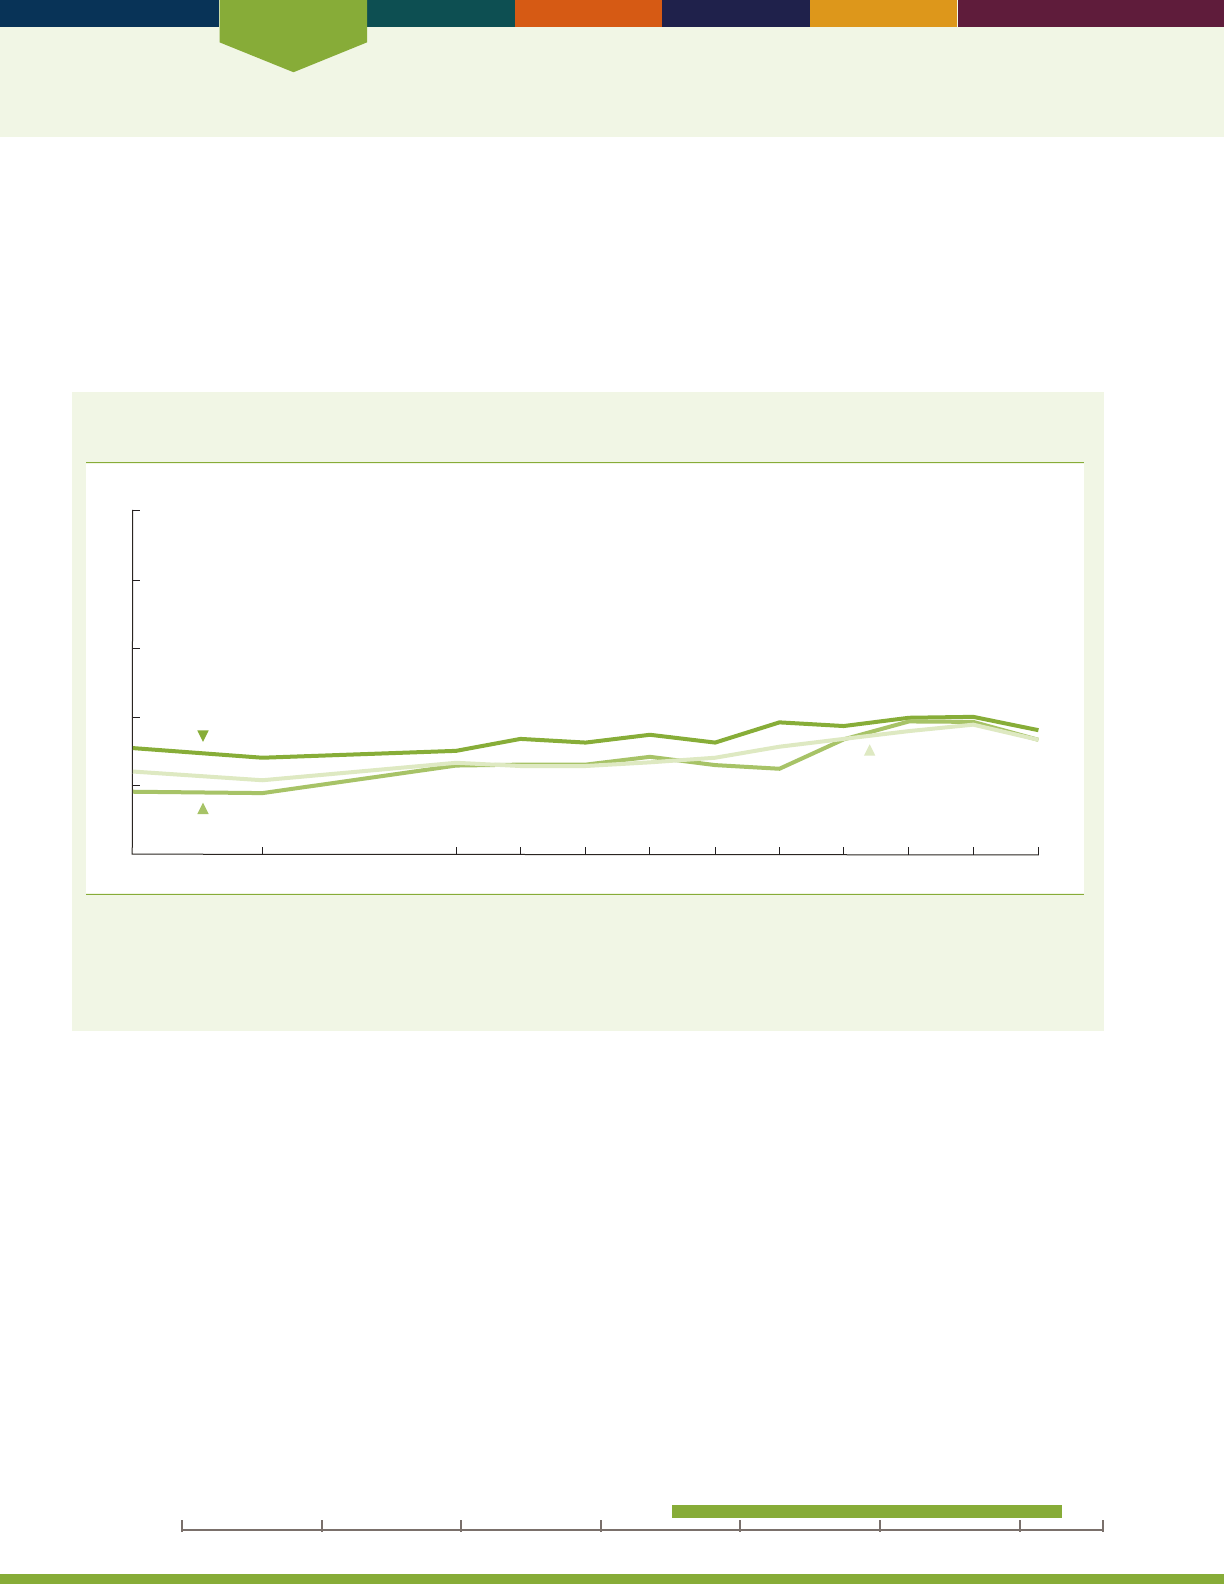
Economics
22
INDICATOR 13: Housing Problems
Most older Americans live in adequate, aordable housing. Some, however, live in costly, physically inadequate, and
crowded housing, which can pose serious problems for an older person’s physical or psychological well-being. While
housing cost burden has remained the most prevalent housing problem for all older American households over the years,
some older American households and intergenerational households continue to face physically inadequate housing
problems, such as housing that lacks complete plumbing or has multiple and major upkeep problems. ese households
also have crowded housing situations, which are households that have more than one person per room.
Percentage of older American households and all other U.S. households that report housing cost
burden, selected years 1985–2013
Percent
0
20
40
60
80
100
All older-member households (not householder or spouse)
All older-owner/renter households
All other households
1985 1989 1995 1997 1999 2001 2003 2005 2011 20132007 2009
NOTE: Housing cost burden refers to expenditures on housing and utilities that exceed 30 percent of household income. All older-owner/
renter households are households with a householder or spouse age 65 and over; all older-member households are households with a
member age 65 and over who is not the householder or spouse; and all other households are households without one or more persons age
65 and over. Some data for 2009 have been revised and differ slightly from previous editions of
Older Americans.
Reference population: These data refer to the resident noninstitutionalized population. People residing in noninstitutional group homes are excluded.
SOURCE: U.S. Department of Housing and Urban Development, American Housing Survey.
• Approximately 39 percent of both older-owner/
renter households (households with a householder or
spouse age 65 and over) and older-member households
(households with a member age 65 and over who
is not the householder or spouse) have housing
problems. e most prevalent housing problem
remains cost burden (expenditures on housing and
utilities that exceed 30 percent of household income).
• While cost burden has generally increased over
time, between 2009 and 2013 the prevalence of cost
burden decreased from 40 to 36 percent for older-
owner/renter households and from 39 to 34 percent
for older-member households. In comparison, the
prevalence of housing cost burden for all other U.S.
households (households without one or more persons
age 65 and over) decreased from 36 to 34 percent over
the same time period.
20162000 201019901980197019601950
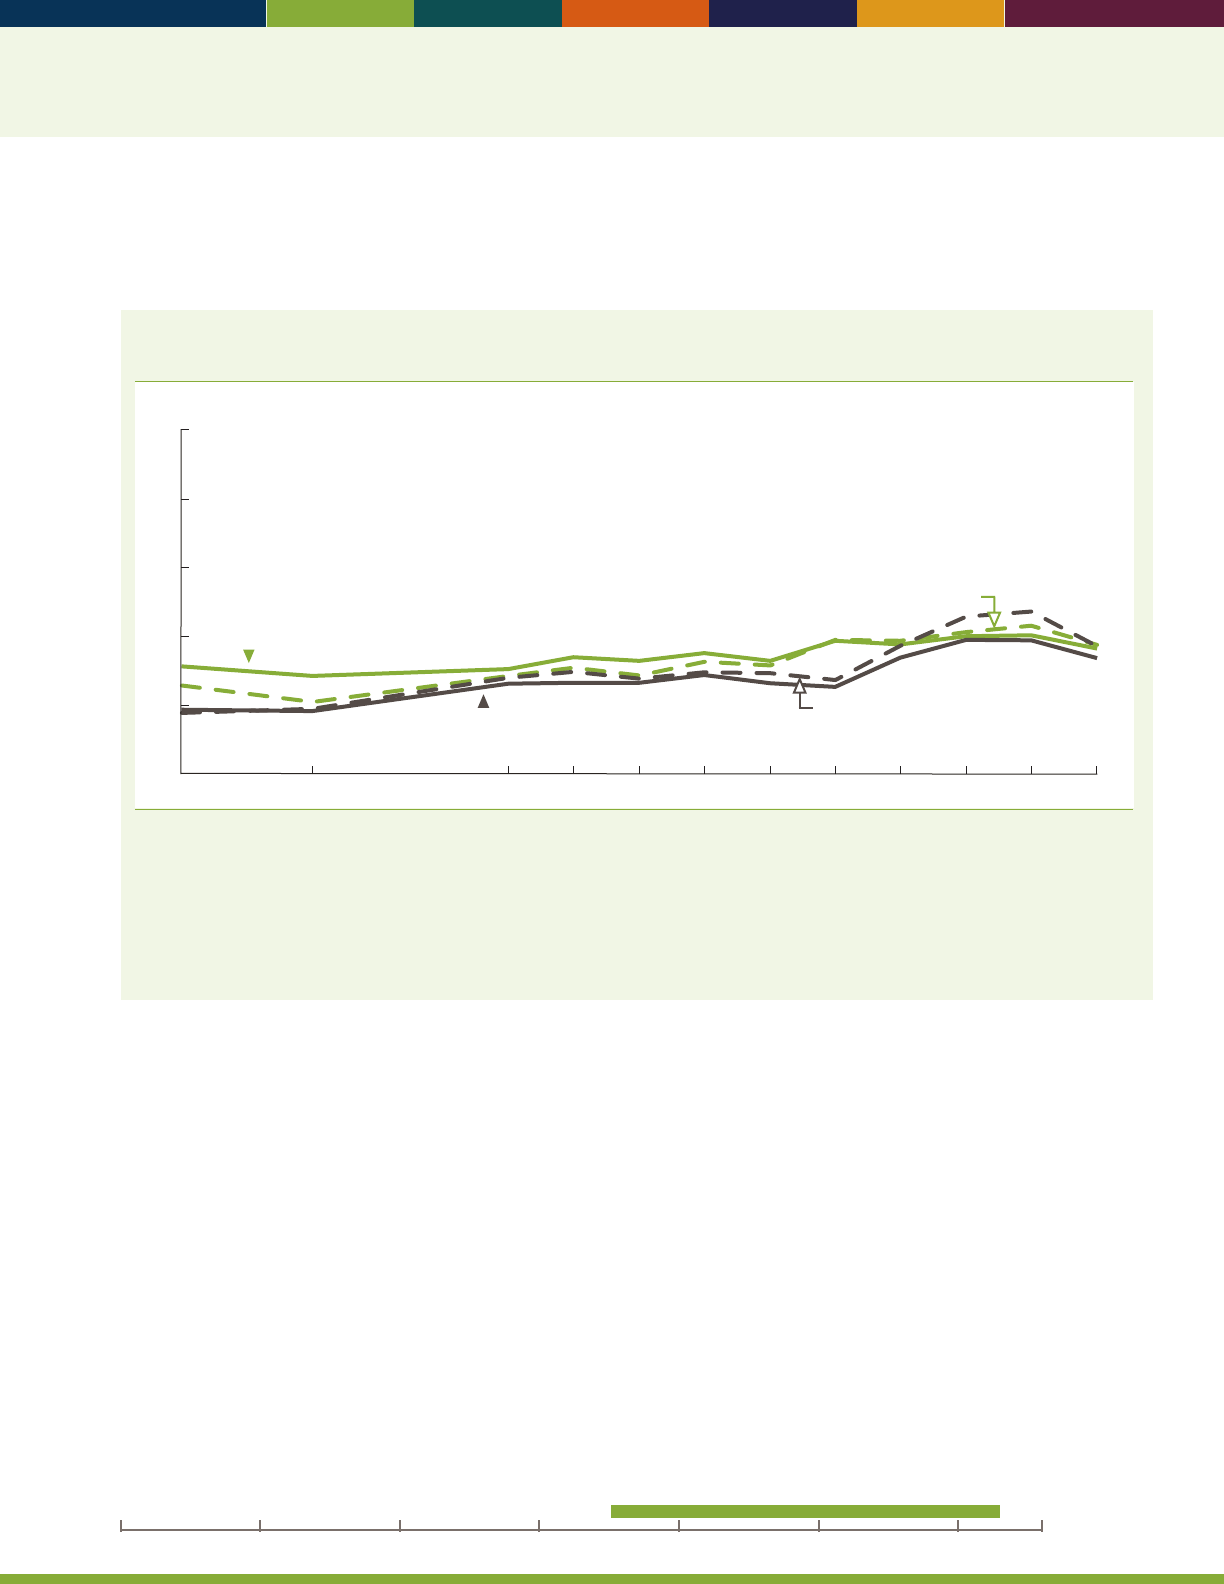
23
Cost burden is also the most dominant housing problem for intergenerational households, or households with older
people (age 65 and over) and children (age 19 or younger) living in the household. For some intergenerational
households, crowded housing continues to be fairly prevalent.
Percentage of older American households and intergenerational households that report housing
cost burden, selected years 1985–2013
Percent
1985 1989 1995 1997 1999 2001 2003 2005 2011 20132007 2009
0
20
40
60
80
100
All older-member households
Older-owner/renter households with children
All older-owner/renter households
Older-member households
with children
NOTE: Housing cost burden refers to expenditures on housing and utilities that exceed 30 percent of household income. All older-owner/
renter households are households with a householder or spouse age 65 and over; all older-member households are households with
a member age 65 and over who is not the householder or spouse; older-owner/renter households with children are households with a
householder or spouse age 65 and over and children (age 19 or younger); and older-member households with children are households with
a member age 65 and over and children (age 19 or younger). Some data for 2009 have been revised and differ slightly from previous editions
of
Older Americans.
Reference population: These data refer to the resident noninstitutionalized population. People residing in noninstitutional group homes are
excluded.
SOURCE: U.S. Department of Housing and Urban Development, American Housing Survey.
• Older-owner/renter and older-member
intergenerational households are likely to represent
households where grandparents are helping to raise
their grandchildren or where three generations are
living within the same household. From 2009 to
2013, housing cost burden remained relatively the
same at approximately 40 percent for older-owner/
renter intergenerational households. Forolder-member
intergenerational households, housing problems
overall decreased, largely as a result of housing cost
burden decreasing from 46 to 37percent between
2009 and 2013.
Data for this indicator’s charts and bullets can be found in
Tables 13a through 13f on pages 107–109.
20162000 201019901980197019601950
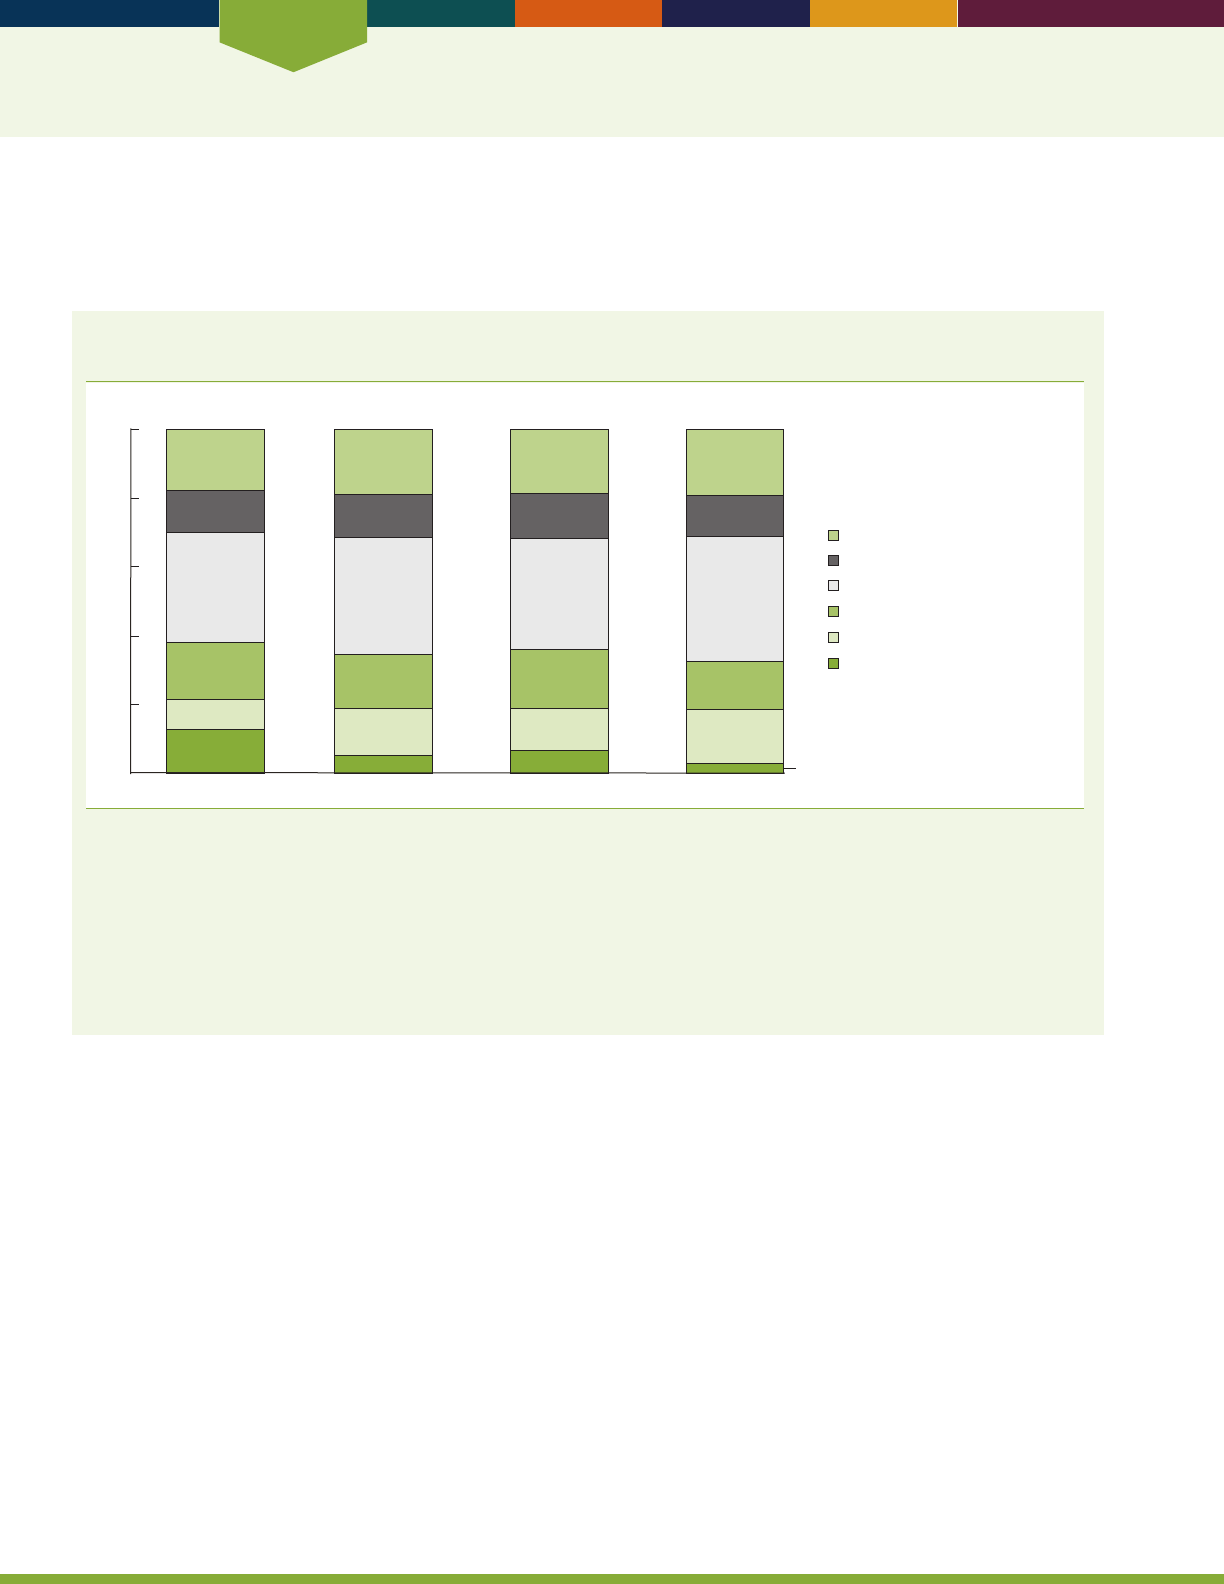
Economics
24
INDICATOR 14: Total Expenditures
Household expenditures are another indicator of economic well-being and show how the older population allocates
resources to food, housing, health care, and other needs. Expenditures may vary with changes in work status, health
status, or income.
Percentage distribution of total household annual expenditures, by expenditure category and
age group of reference person, 2014
Percent
65–74 75 and over65 and 55–64
0
20
40
60
80
100
13
9
17
32
12
18
5
13
16
34
13
19
7
12
17
32
13
19
3
16
14
37
12
19
Personal insurance and pensions
Health care
Transportation
Housing
Food
Other
NOTE: Other expenditures include apparel, personal care, entertainment, reading, education, alcohol, tobacco, cash contributions, and
miscellaneous expenditures. Data from the Consumer Expenditure Survey by age group represent average annual expenditures for consumer
units by the age of the reference person, that is the person listed as the owner or renter of the home. For example, the data on people
age 65 and over reect consumer units with a reference person age 65 and over. The Consumer Expenditure Survey collects and publishes
information from consumer units, which are generally dened as a person or group of people who live in the same household and are related
by blood, marriage, or other legal arrangement (i.e., a family) or people who live in the same household who are unrelated but make nancial
decisions together. A household usually refers to a physical dwelling and may contain more than one consumer unit (e.g., roommates who are
sharing an apartment but who are nancially independent from each other). However, for convenience, the term “household” is substituted for
“consumer unit” in this text.
Reference population: These data refer to the resident noninstitutionalized population.
SOURCE: Bureau of Labor Statistics, Consumer Expenditure Survey.
• Housing accounted for the largest share (nearly one-
third or more on average) of total expenditures for all
groups of households with a reference person (i.e., a
selected household owner or renter) age 55 and over. In
2014, the share was 37 percent for households with a
reference person age 75 and over.
• As a share of total expenditures, health care
expenditures increased dramatically with age. For the
group age 75 and over, the share (16 percent) was
nearly twice as high as it was for the group age 55–64
(9 percent); in addition, the share that those age 75
and over allocated to health care was slightly higher
than this group allocated to transportation (4 percent).
• Among the age groups studied, the share of total
expenditures allocated to food ranged between 12and
13 percent.
Data for this indicator’s charts and bullets can be found in
Table 14 on page 110.

Health Status
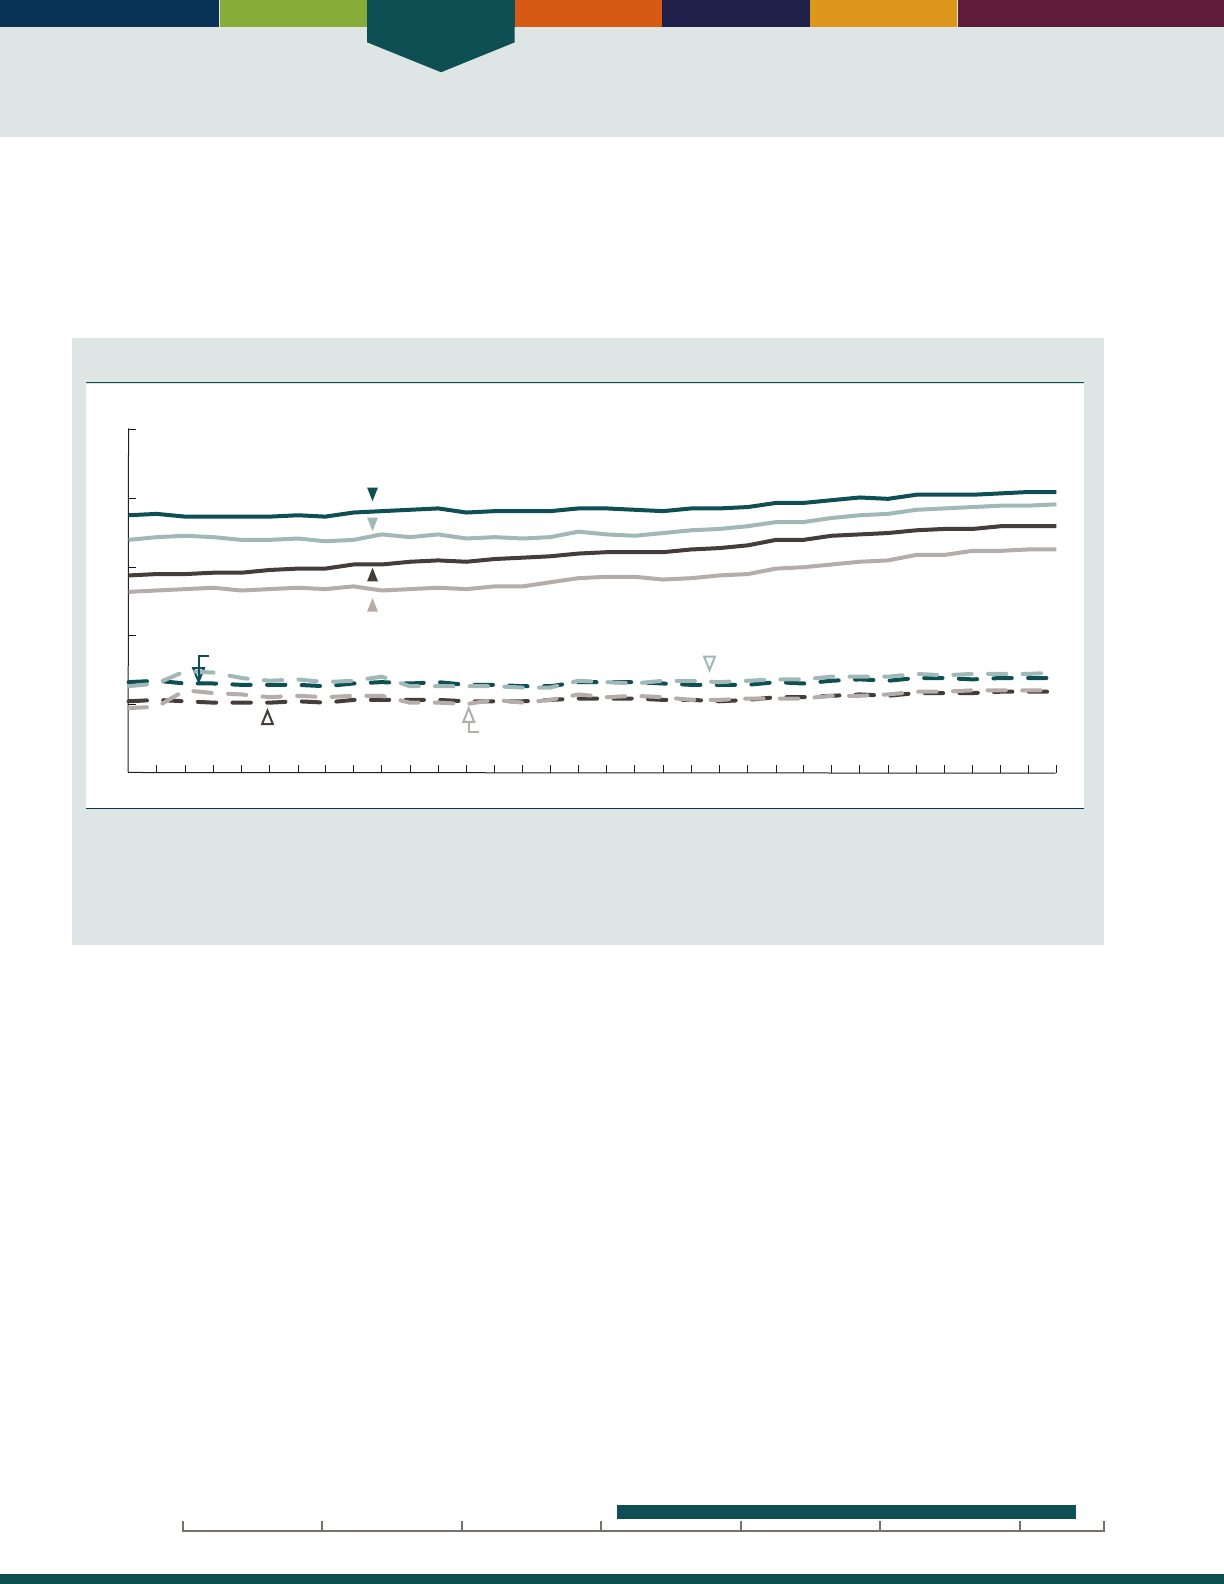
Health Status
26
INDICATOR 15: Life Expectancy
Life expectancy is a summary measure of the overall health of a population. It represents the average number of years of
life remaining to a person at a given age if death rates remain constant. Improvements in health have resulted in increased
life expectancy. However, there are dierences in life expectancy by socioeconomic status, and these dierences have been
increasing over time.
10
Life expectancy in the United States is lower than in many other industrialized countries.
11
Life expectancy at ages 65 and 85, by race and sex 1981–2014
1985 1990 1995 2000 2005 20101981 2014
Years of life
0
5
10
15
20
25
White men, at age 65
White women, at age 65
White men, at age 85
White women, at age 85
Black or African American men, at age 65
Black or African American women, at age 65
Black or African American men, at age 85
Black or African American women, at age 85
NOTE: Life expectancy estimates are from annual life tables produced by the National Center for Health Statistics found at http://www.cdc.
gov/nchs/products/life_tables.htm. Some estimates have been revised and may differ from previous editions of
Older Americans
due to
changes in methodology and to the use of intercensal population estimates for 2001–2009. See Appendix II, Life Expectancy, of
Health, United
States, 2015
for a description of the changes in life table methodology.
Reference population: These data refer to the resident population.
SOURCE: Centers for Disease Control and Prevention, National Center for Health Statistics, National Vital Statistics System.
• Americans are living longer than ever before. Life
expectancies at both age 65 and age 85 have increased.
Under current mortality conditions, people who
survive to age 65 can expect to live an average of
19.3more years. In 2014, the life expectancy of people
who survive to age 85 was 7.0 years for women and
5.9years for men.
• Life expectancy varies by race, but the dierence
decreases with age. In 2014, life expectancy at birth
was 3.4 years higher for White people than for Black
people. At age 65, White people can expect to live
an average of 1.1 years longer than Black people.
Among those who survive to age 85, however, the
life expectancy for Black people is slightly higher
(6.9years) than White people (6.5 years).
• In 2014, women had higher life expectancy than men.
At age65, women can expect to live 2.5 years longer.
At age 85, women can expect to live 1.1 years longer.
Dierences by sex are seen among the White, Black,
and Hispanic populations.
• Life expectancy in 2014 among the Hispanic
population was higher than among non-Hispanic
Whitesor non-Hispanic Blacks. Hispanic people who
survive to age 65 can expect to live 1.8 years longer
than non-Hispanic Whites and 3.0 years longer than
non-Hispanic Blacks.
Data for this indicator’s charts and bullets can be found in
Tables 15a and 15b on pages 111–113.
20162000 201019901980197019601950
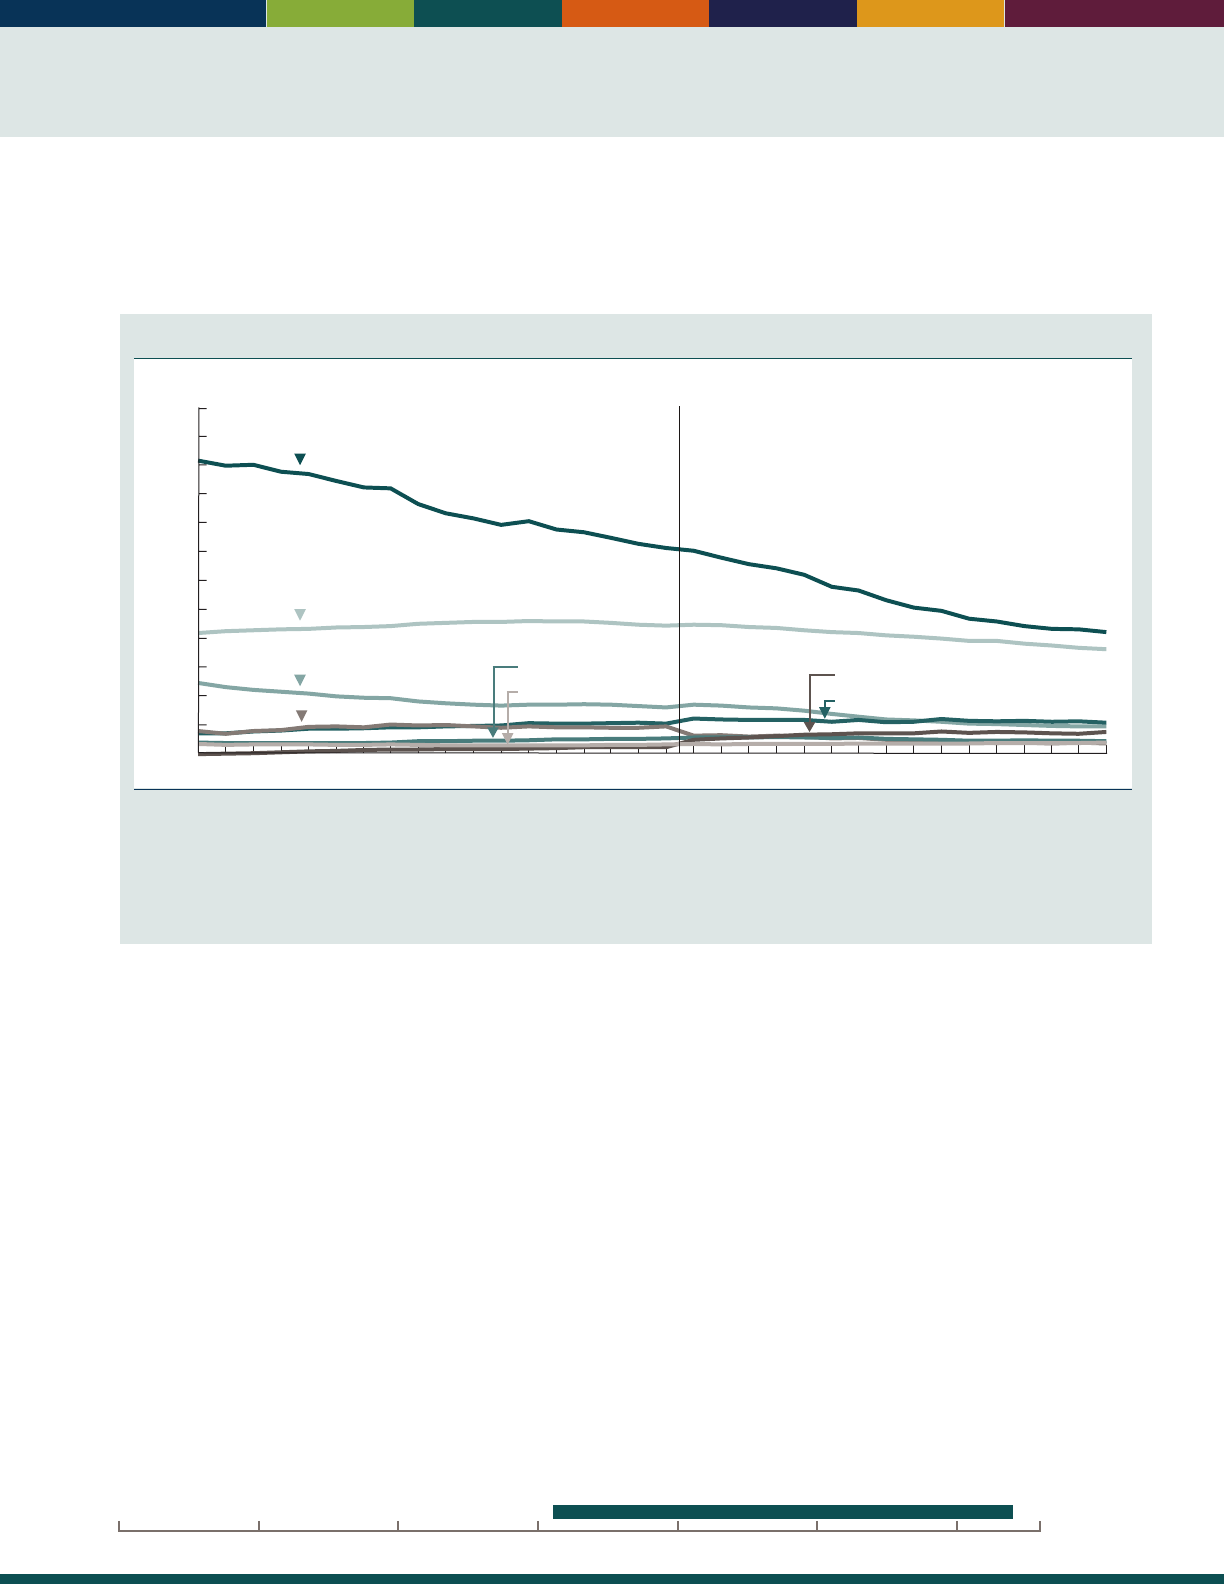
27
INDICATOR 16: Mortality
Overall, death rates for the population age 65 and over have declined in recent decades. However, for some causes of
death, rates among older Americans have increased in recent years. ere are dierences in death rates by sex and race
and Hispanic origin for many causes of death.
Death rates among people age 65 and over, by selected leading causes of death, 1981–2014
Per 100,000
3,000
1981 1985 1990 1995 2000 2010 2014
0
250
500
750
1,000
1,250
1,500
1,750
2,000
2,250
2,500
2,750
Heart disease
ICD-10ICD-9
Cancer
Stroke
Chronic lower respiratory diseases
Influenza and pneumonia
Diabetes
Alzheimer’s disease
Unintentional injuries
2005
NOTE: Death rates for 1981–1998 are based on the 9th revision of the International Classication of Diseases (ICD-9). Starting in 1999,
death rates are based on ICD-10. For the period 1981–1998, causes were coded using ICD-9 codes that are more comparable with codes for
corresponding ICD-10 categories and may differ from other published estimates. See http://www.cdc.gov/nchs/data/nvsr/nvsr49/nvsr49_02.
pdf for information on the comparability of death rates between ICD-9 and ICD-10. Some data from 2000–2009 have been revised and differ
from previous versions of
Older Americans.
Rates are age adjusted using the 2000 standard population.
Reference population: These data refer to the resident population.
SOURCE: Centers for Disease Control and Prevention, National Center for Health Statistics, National Vital Statistics System.
• In 2014, the leading cause of death among people
age 65 and over was heart disease (1,062 deaths
per 100,000 people), followed by cancer (915 per
100,000), chronic lower respiratory diseases (277per
100,000), stroke (247 per 100,000), Alzheimer’s
disease (200 per 100,000), diabetes (119 per 100,000),
unintentional injuries (105 per 100,000), and inuenza
and pneumonia (97 per 100,000).
• Between 1999 and 2014, age-adjusted death rates
for all causes of death among people age 65 and over
declined by 20 percent. Death rates declined for heart
disease, cancer, chronic lower respiratory disease,
stroke, diabetes, and inuenza and pneumonia. Death
rates for Alzheimer’s disease and unintentional injuries
increased over the same period.
• Heart disease and cancer were the top two leading
causes of death in 2014 among all people age 65 and
over. ey were also the top two leading causes of
death for both men and women as well as for non-
Hispanic Whites, non-Hispanic Blacks, and Hispanics.
Diabetes was the seventh leading cause of death among
non-Hispanic Whites, but the fourth leading cause
among non-Hispanic Blacks and Hispanics.
• Other causes of death varied among older Americans
by sex and race and Hispanic origin. For example, in
2014 women had higher death rates from Alzheimer’s
disease than men (222 per 100,000 compared with
161 per 100,000), while men had higher rates of
death from unintentional injuries (131 per 100,000
compared with 86 per 100,000). Rates of death for
heart disease and stroke were higher among non-
Hispanic Blacks than among non-Hispanic Whites and
Hispanics.
Data for this indicator’s charts and bullets can be found in
Tables 16a and 16b on pages 114–115.
20162000 201019901980197019601950
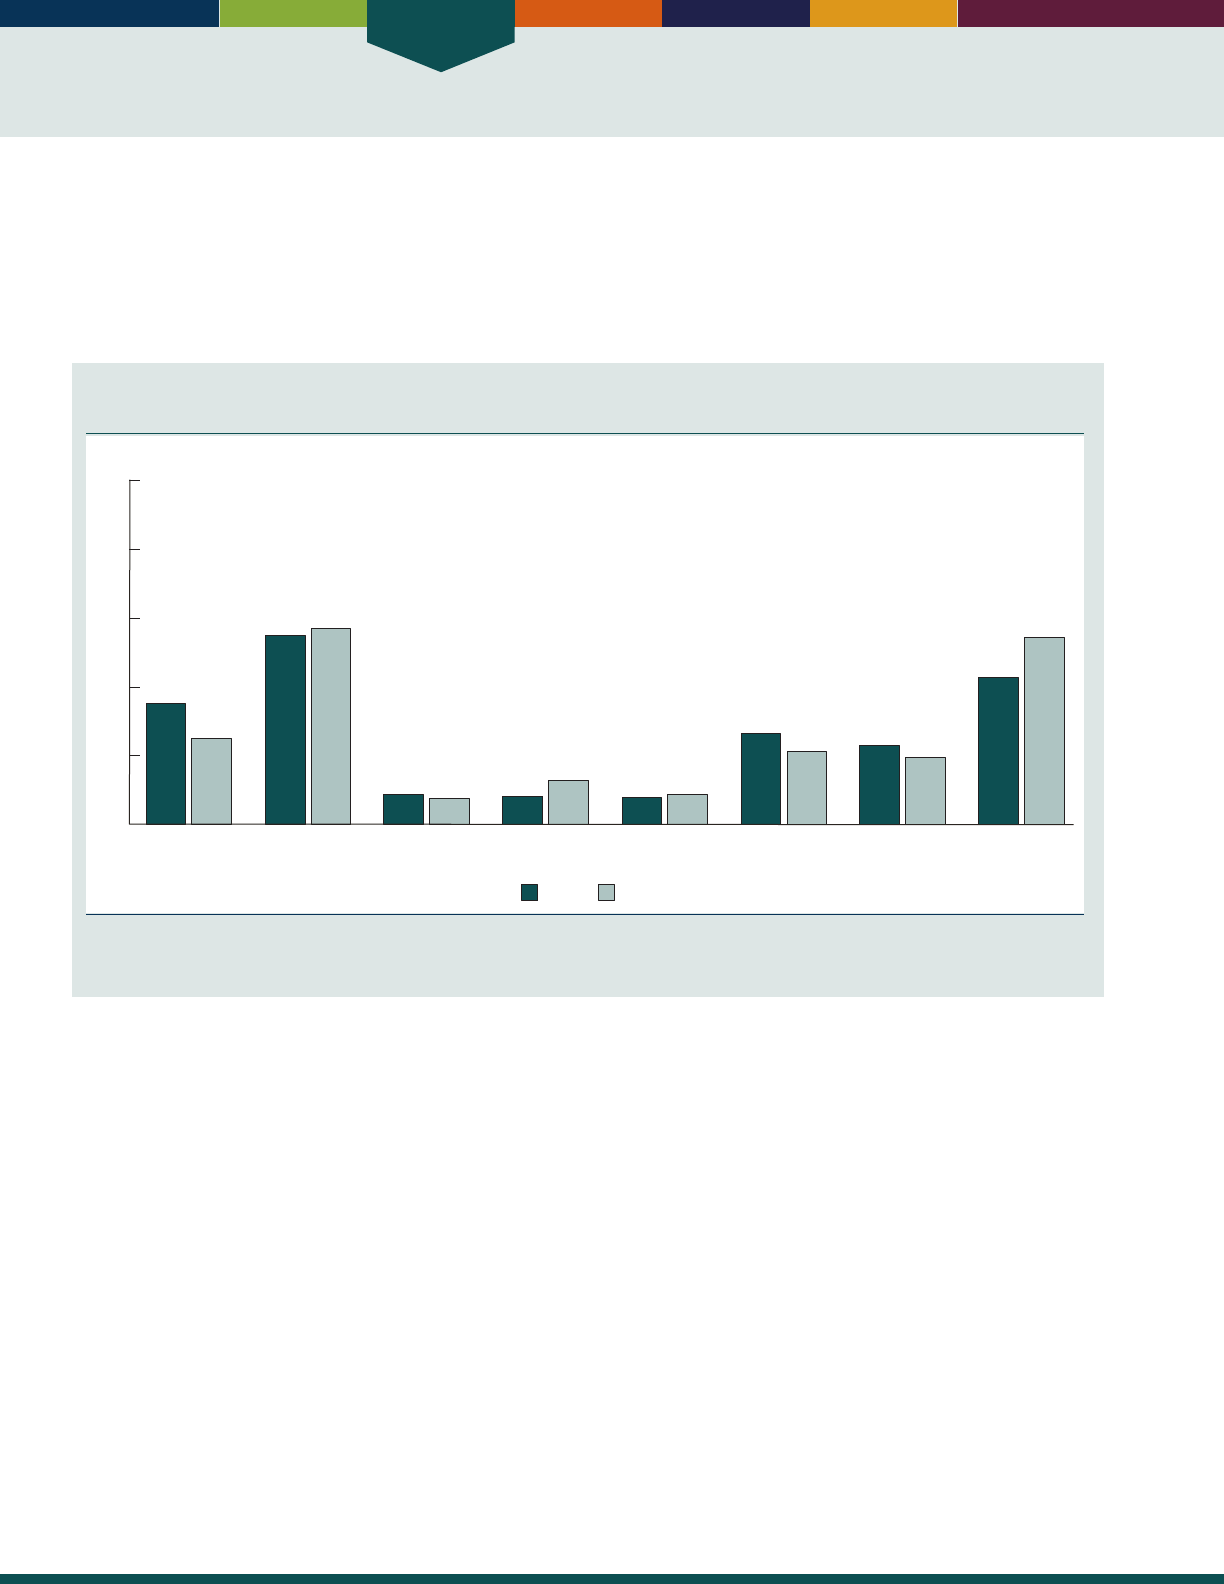
Health Status
28
INDICATOR 17: Chronic Health Conditions
Chronic diseases and conditions such as heart disease, stroke, cancer, diabetes, and arthritis are among the most common
and costly health conditions.
12
e majority of older adults have multiple chronic conditions, which contribute to
frailty and disability.
13
Many of the negative eects of chronic conditions are caused by health risk behaviors that can
be changed.
12
e six leading causes of death among older Americans in 2014 were chronic diseases (see “Indicator 16:
Mortality”).
Percentage of people age 65 and over who reported having selected chronic health conditions,
by sex, 2013–2014
Percent
WomenMen
0
20
40
60
80
100
Heart disease Hypertension Stroke Asthma Chronic bronchitis
or emphysema
Cancer Diabetes Arthritis
35
25
55
57
8
7
8
13
8
9
26
21
23
19
43
54
NOTE: Data are based on a 2-year average from 2013–2014.
Reference population: These data refer to the civilian noninstitutionalized population.
SOURCE: Centers for Disease Control and Prevention, National Center for Health Statistics, National Health Interview Survey.
• e prevalence of certain chronic health conditions
diered by sex. Women reported higher levels of
asthma and arthritis than men. Men reported higher
levels of heart disease, cancer, and diabetes than
women.
• ere were dierences by race and ethnicity in the
prevalence of certain chronic health conditions. In
2013–2014, among people age 65 and over, non-
Hispanic Blacks reported higher levels of hypertension
and diabetes than non-Hispanic Whites (71 percent
compared with 54 percent for hypertension, and
32 percent compared with 18 percent for diabetes).
Hispanics also reported higher levels of diabetes
(32percent) than non-Hispanic Whites, but lower
levels of arthritis than non-Hispanic Whites (44
percent compared with50percent).
• e prevalence of some chronic health conditions
among people age 65 and over has increased over time.
e percentage of people who reported hypertension,
asthma, cancer, and diabetes was higher in 2013–2014
compared with 1997–1998.
Data for this indicator’s charts and bullets can be found in
Tables 17a and 17b on page 116.
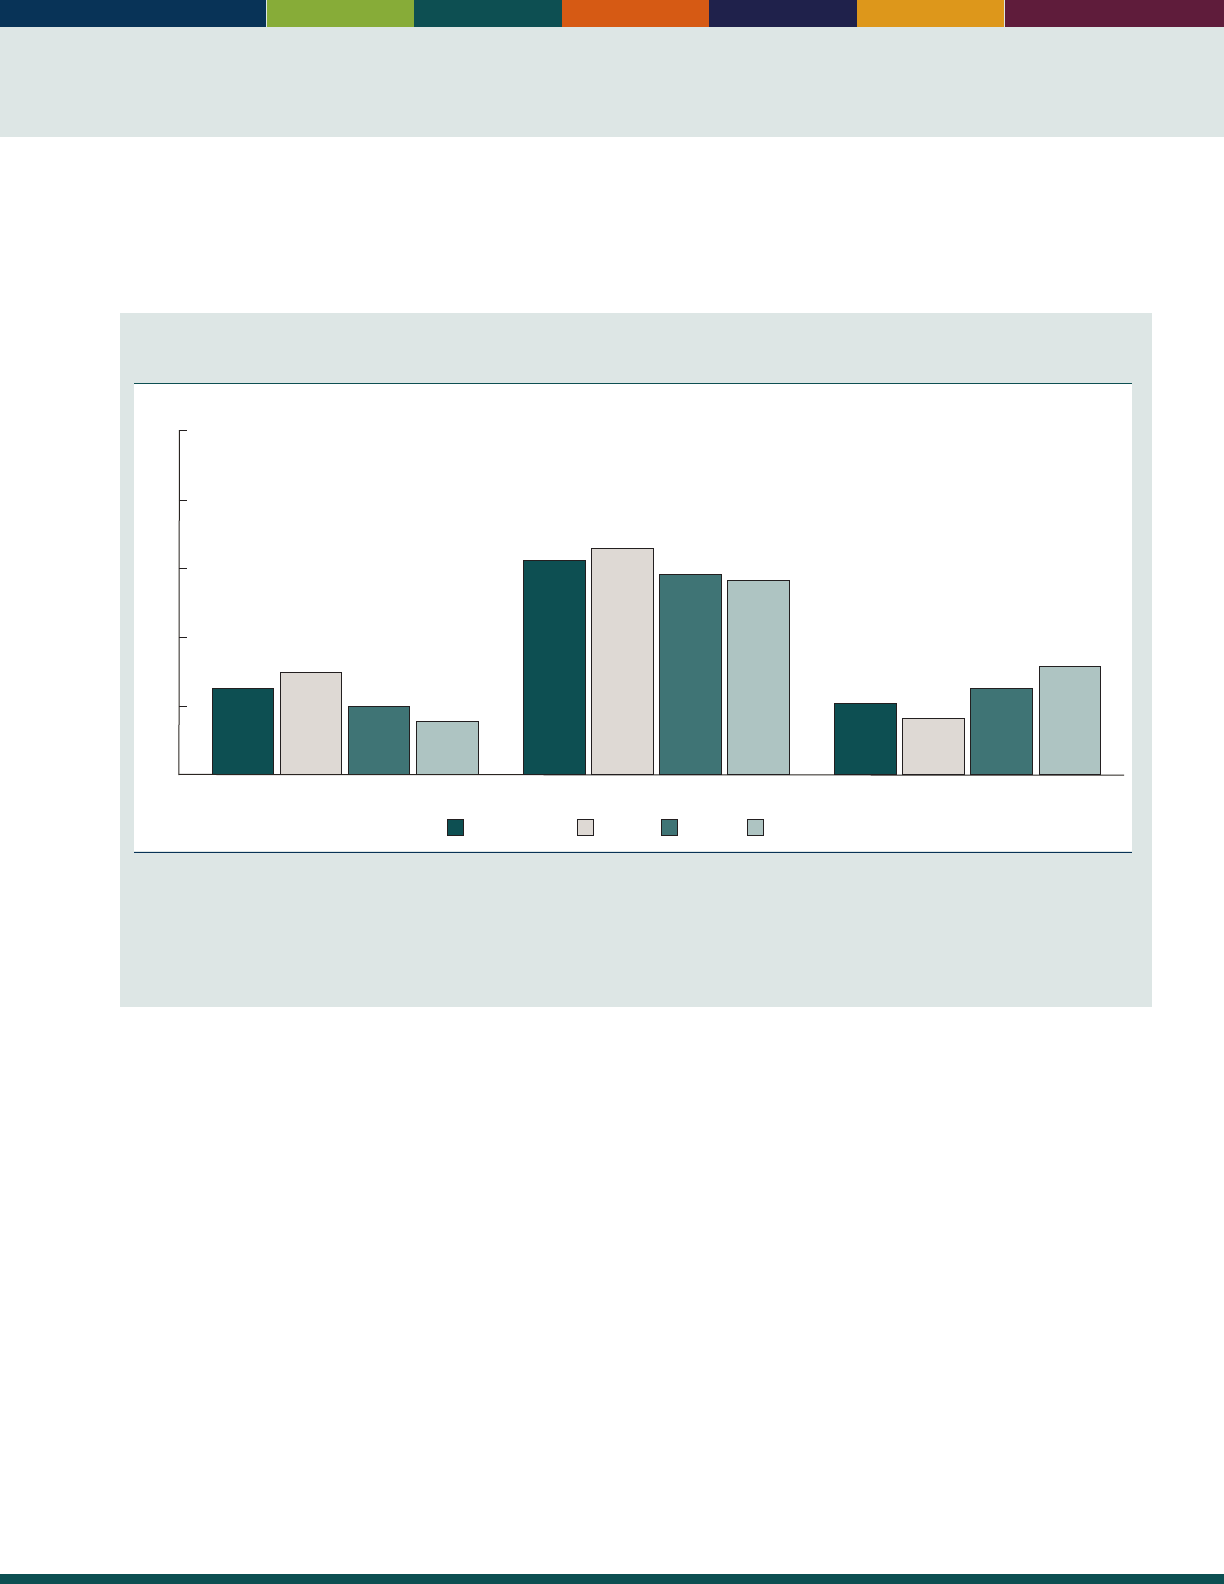
29
INDICATOR 18: Oral Health
Oral health is an important component of an older person’s general health and well-being. Oral health reects overall
health status and is related to the risk and treatment of various chronic conditions.
14
Regular dental care is not covered
under Medicare.
Percentage of people age 65 and over who had dental insurance, had a dental visit in the past
year, and had no natural teeth, by age group, 2014
Percent
65–7465 and over 85 and over75–84
Dental insurance
25
30
20
16
Dental visit in past year
62
66
58
56
No natural teeth
21
16
25
31
0
20
40
60
80
100
NOTE: Dental insurance is estimated from questions on whether the respondent’s private health insurance plan covers dental care and
whether the respondent has a single service plan covering dental care. Dental visits in the past year were estimated from responses to the
question, “About how long has it been since you last saw or talked to a dentist?” The percentage with no natural teeth was estimated from
responses to the question, “Have you lost all of your upper and lower natural (permanent) teeth?” All estimates were calculated from the
sample adult component of the National Health Interview Survey.
Reference population: These data refer to the civilian noninstitutionalized population.
SOURCE: Centers for Disease Control and Prevention, National Center for Health Statistics, National Health Interview Survey.
• About 25 percent of people age 65 and over reported
having dental insurance in 2014. e percentage with
dental insurance declines with age, from 30 percent
among people ages 65–74 to 16 percent among people
age 85 and over.
• In 2014, about 62 percent of people age 65 and over
had a dental visit in the past year. e percentage
visiting a dentist was higher among people ages 65–74
than among people age 85 and over (66 percent versus
56 percent).
• e prevalence of edentulism, having no natural teeth,
was nearly twice as high among people age 85 and over
(31 percent) as among people ages 65–74 (16 percent).
• e percentage of older women with dental insurance
was lower than the percentage of older men with dental
insurance. Similar percentages of men and women age
65 and over had adental visit in the past year and had
no natural teeth.
• Non-Hispanic Black people age 65 and over had higher
levels of edentulism and lower levels of dental visits
than non-Hispanic Whites and Hispanics.
Data for this indicator’s charts and bullets can be found in
Tables 18a and 18b on page 117.
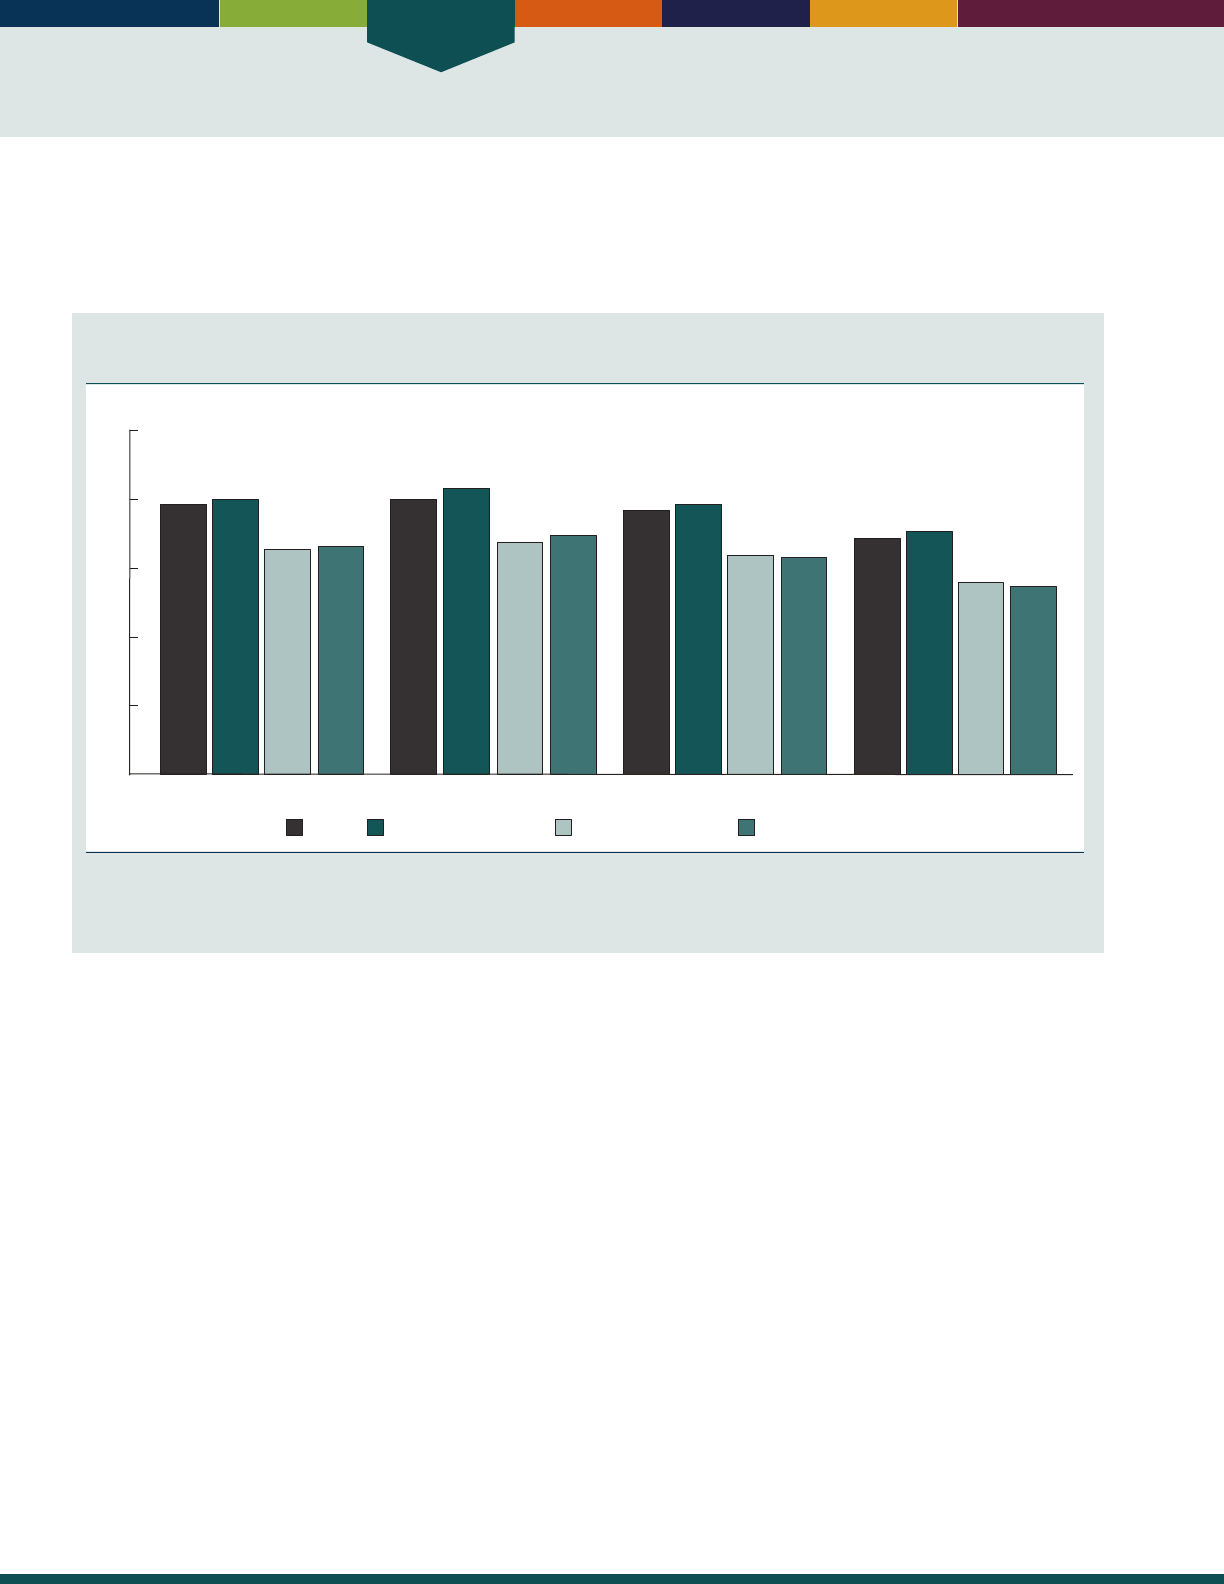
Health Status
30
INDICATOR 19: Respondent-Assessed Health Status
Asking people to rate their health as excellent, very good, good, fair, or poor provides an indicator of health status easily
measured in surveys. It represents physical, emotional, and social aspects of health and well-being. Self-rated health has
been shown to predict mortality and health care expenditures.
15,16
Percentage of people age 65 and over with respondent-assessed good to excellent health status,
by age group and race and Hispanic origin, 2012–2014
78
80
65
66
80
83
67
69
76
78
64
63
68
71
56
55
65 and over 65–74 75–84 85 and over
0
20
40
60
80
100
Non-Hispanic Black
Hispanic (of any race)Non-Hispanic WhiteTotal
Percent
NOTE: Data are based on a 3-year average from 2012–2014. Total includes all other races not shown separately. See data sources for the
denition of race and Hispanic origin in the National Health Interview Survey.
Reference population: These data refer to the civilian noninstitutionalized population.
SOURCE: Centers for Disease Control and Prevention, National Center for Health Statistics, National Health Interview Survey.
• During the period 2012–2014, 78 percent of people
age 65 and over rated their health as good, very good,
or excellent. e levels of health reported by older men
and older women were similar.
• e proportion of people reporting good to excellent
health was lower among the oldest age groups. About
80 percent of those age 65–74 reported good or better
health. At age 85 and over, 68 percent of people
reported good or better health. is pattern was also
evident within racial and ethnic groups.
• Regardless of age, older non-Hispanic White men and
women were more likely to report good to excellent
health than their non-Hispanic Black and Hispanic
counterparts. Non-Hispanic Blacks and Hispanics were
similar to one another in the percentages of positive
health evaluations that they reported.
Data for this indicator’s charts and bullets can be found in
Table 19 on page 118.
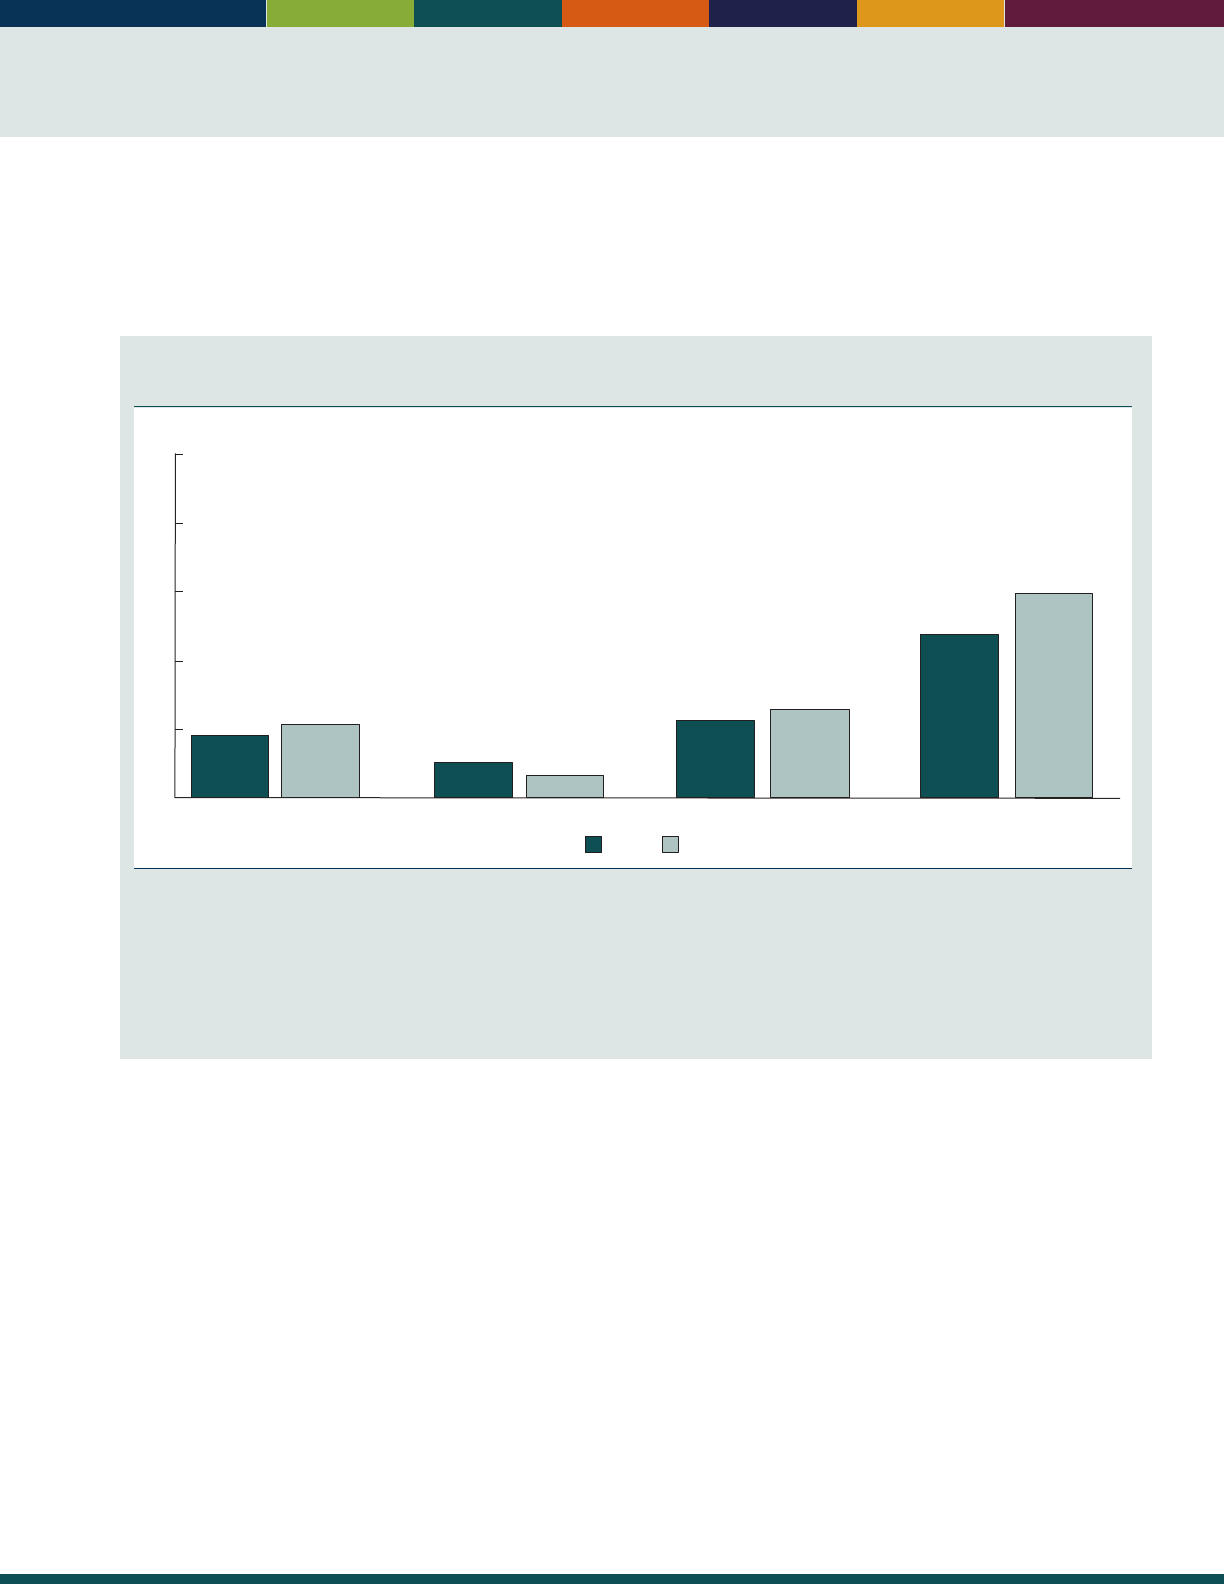
31
INDICATOR 20: Dementia
Dementias, including Alzheimer’s disease and other related disorders that cause memory impairment and cognitive
decline, aect the health and well-being of the U.S. population (see “Indicator 16: Mortality”).
17
Dementia is a condition
overwhelmingly faced by older adults, although there are some conditions in which the onset is seen in people under age
65. Increasing age is one of the strongest risk factors for dementia.
Percentage of the non-nursing home population age 65 and over with dementia, by age group
and sex, 2011
85 and over65–74 75–8465 and over
Percent
WomenMen
0
10
20
30
40
50
9
11
5
3
11
13
24
30
NOTE: The estimate of dementia presented here includes Alzheimer’s disease and other related dementias such as frontotemporal, Lewy
body, mixed, and vascular dementia, which are often indistinguishable from Alzheimer’s disease in their presentation and outcomes.
Dementia status in the National Health and Aging Trends Study (NHATS) was determined using three types of information: (1) a report (by
the respondent or proxy) that a doctor told the sample person that he or she had dementia or Alzheimer’s disease; (2) a score indicating
probable dementia on a screening instrument administered to proxy respondents during the interview; and (3) cognitive tests that evaluate
memory, orientation, and executive function administered to the respondent during the interview. See http://nhats.org/scripts/documents/
DementiaTechnicalPaperJuly_2_4_2013_10_23_15.pdf for details on dementia measurements in NHATS.
Reference population: These data refer to Medicare beneciaries not living in nursing homes.
SOURCE: National Health and Aging Trends Study.
• ere are sex dierences in the prevalence of dementia.
Although women overall are more likely than men
to have dementia, this pattern is not consistent
at all age groups. In 2011, for those people ages
65–74, men were more likely to have dementia than
women (5percent versus 3 percent, respectively).
For those adults age 85and over, women were more
likely to have dementia than men (30 percent versus
24percent).
• In addition to the higher prevalence of dementia
among women age 85 and over, the size of the
population of women in this age group is larger than
that of men. As a result, far more women than men
age 85 and over have dementia. Over 900,000 women
in this age group have dementia, compared with just
under 400,000 men.
• Most people with dementia live in the community.
However, the prevalence of dementia among nursing
home residents is higher than among the non-nursing
home population. It is estimated that in 2011, between
41 percent and 68 percent of nursing home residents
had moderate or severe cognitive impairment.
18
• e prevalence of dementia decreased with educational
level. In 2011, among people age 65 and over,
21percent with less than a high school education had
dementia, compared with 5 percent of people who
had a bachelor’s degree or more. ese dierences by
educational level are seen for both men and women
and in all age groups.
Data for this indicator’s charts and bullets can be found in
Tables 20a through 20d on page 119.

Health Status
32
INDICATOR 21: Depressive Symptoms
Depressive symptoms are an important indicator of general well-being and mental health among older adults. People
who report many depressive symptoms often experience higher rates of physical illness, greater functional disability,
higher health care resource utilization,
19
and dementia.
20
Percentage of people age 51 and over with clinically relevant depressive symptoms, by sex and
age group, selected years, 1998–2014
65 and over51–64
Men
1212
12
11
12 12
13
11
14
10
13
11
14
9
14
9
12
10
1998 2000 2002 2004 2006 2008 2010 2012 2014
Percent
0
10
20
30
40
50
Women
1998 2000 2002 2004 2006 2008 2010 2012 2014
17
19
18
19
18
18
17
17
19
18
16
15
17
14
17
15
17
15
Percent
0
10
20
30
40
50
NOTE: The denition of “clinically relevant depressive symptoms” is four or more symptoms out of a list of eight depressive symptoms from
an abbreviated version of the Center of Epidemiological Studies Depression Scale (CES-D), adapted by the Health and Retirement Study (HRS).
The CES-D scale is a measure of depressive symptoms and is not to be used as a diagnosis of clinical depression. A detailed explanation
concerning the “four or more symptoms” cut-off can be found in the following documentation: http://hrsonline.isr.umich.edu/sitedocs/userg/
dr_005.pdf. Percentages are based on weighted data using the preliminary respondent weights from the 2014 Early Release HRS Tracker File.
Some data for 1998–2008 have been revised and differ from previous editions of
Older Americans.
Reference population: These data refer to the civilian noninstitutionalized population.
SOURCE: Health and Retirement Study.
• Older women were more likely to report clinically
relevant depressive symptoms than were older men. In
2014, 15 percent of women age 65 and over reported
depressive symptoms, compared with 10 percent of
men. ere was no signicant change in this dierence
between the sexes from 1998 to 2014.
• e percentage of people age 51 and over reporting
clinically relevant symptoms has remained relatively
stable over the past few years. Between 1998 and 2014,
the percentage of men in this age group who reported
depressive symptoms ranged between 11and 12
percent. For women in this age group, the percentage
reporting these symptoms ranged between 16 and
19percent.
20162000 201019901980197019601950
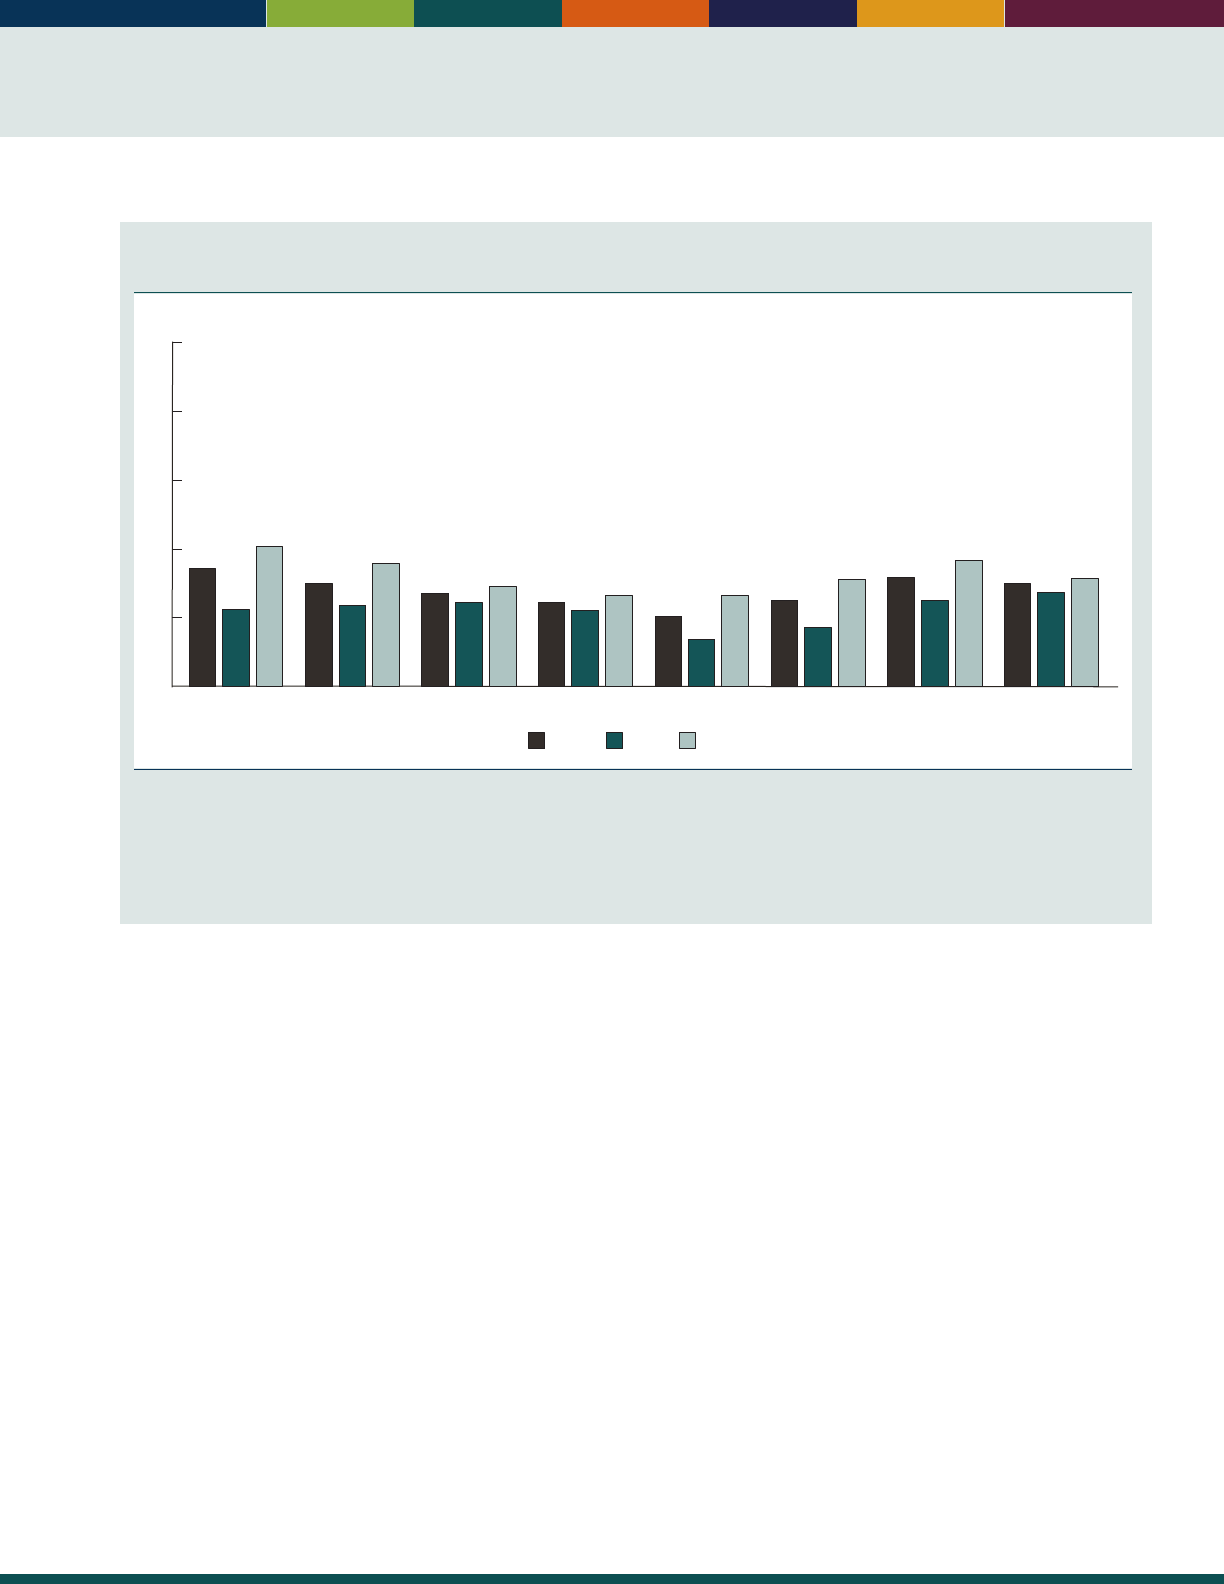
33
Percentage of people age 51 and over with clinically relevant depressive symptoms, by age group
and sex, 2014
Percent
WomenMenTotal
65–69 70–74 75–79 80–84 85 and over55–59 60–6451–54
17
11
21
15
14
16
15
12
18
14
13
15
13
11
13
10
7
13
13
9
16
16
13
19
0
10
20
30
40
50
NOTE: The denition of “clinically relevant depressive symptoms” is four or more symptoms out of a list of eight depressive symptoms from an
abbreviated version of the Center of Epidemiological Studies Depression Scale (CES-D), adapted by the Health and Retirement Study (HRS). The
CES-D scale is a measure of depressive symptoms and is not to be used as a diagnosis of clinical depression. A detailed explanation concerning
the “four or more symptoms” cut-off can be found in the following documentation: http://hrsonline.isr.umich.edu/sitedocs/userg/dr_005.pdf.
Percentages are based on weighted data using the preliminary respondent weight from HRS 2014.
Reference population: These data refer to the civilian noninstitutionalized population.
SOURCE: Health and Retirement Study.
• e prevalence of depressive symptoms varies by age.
In 2014, the proportion of people age 51 and over with
clinically relevant symptoms was higher for the younger
age group (17percent among those ages 51–54) and
the older age group (15 to 16 percent among those
age 80 and over) than for people ages 65–79 (10 to
13percent).
• In 2014, the percentage of men 85 and over
(14percent) reporting clinically relevant depressive
symptoms was almost twice that of men in their 70s
(about 8 percent), and was slightly higher than those in
their 50s and 60s (roughly 12 percent). Prevalence of
clinically relevant depressive symptoms among women
age 51 and over shows a clear U-shaped pattern, with
the highest rates among those ages 51–54 (21 percent)
and those ages 80–84 (19percent).
Data for this indicator’s charts and bullets can be found in
Tables 21a and 21b on page 120.
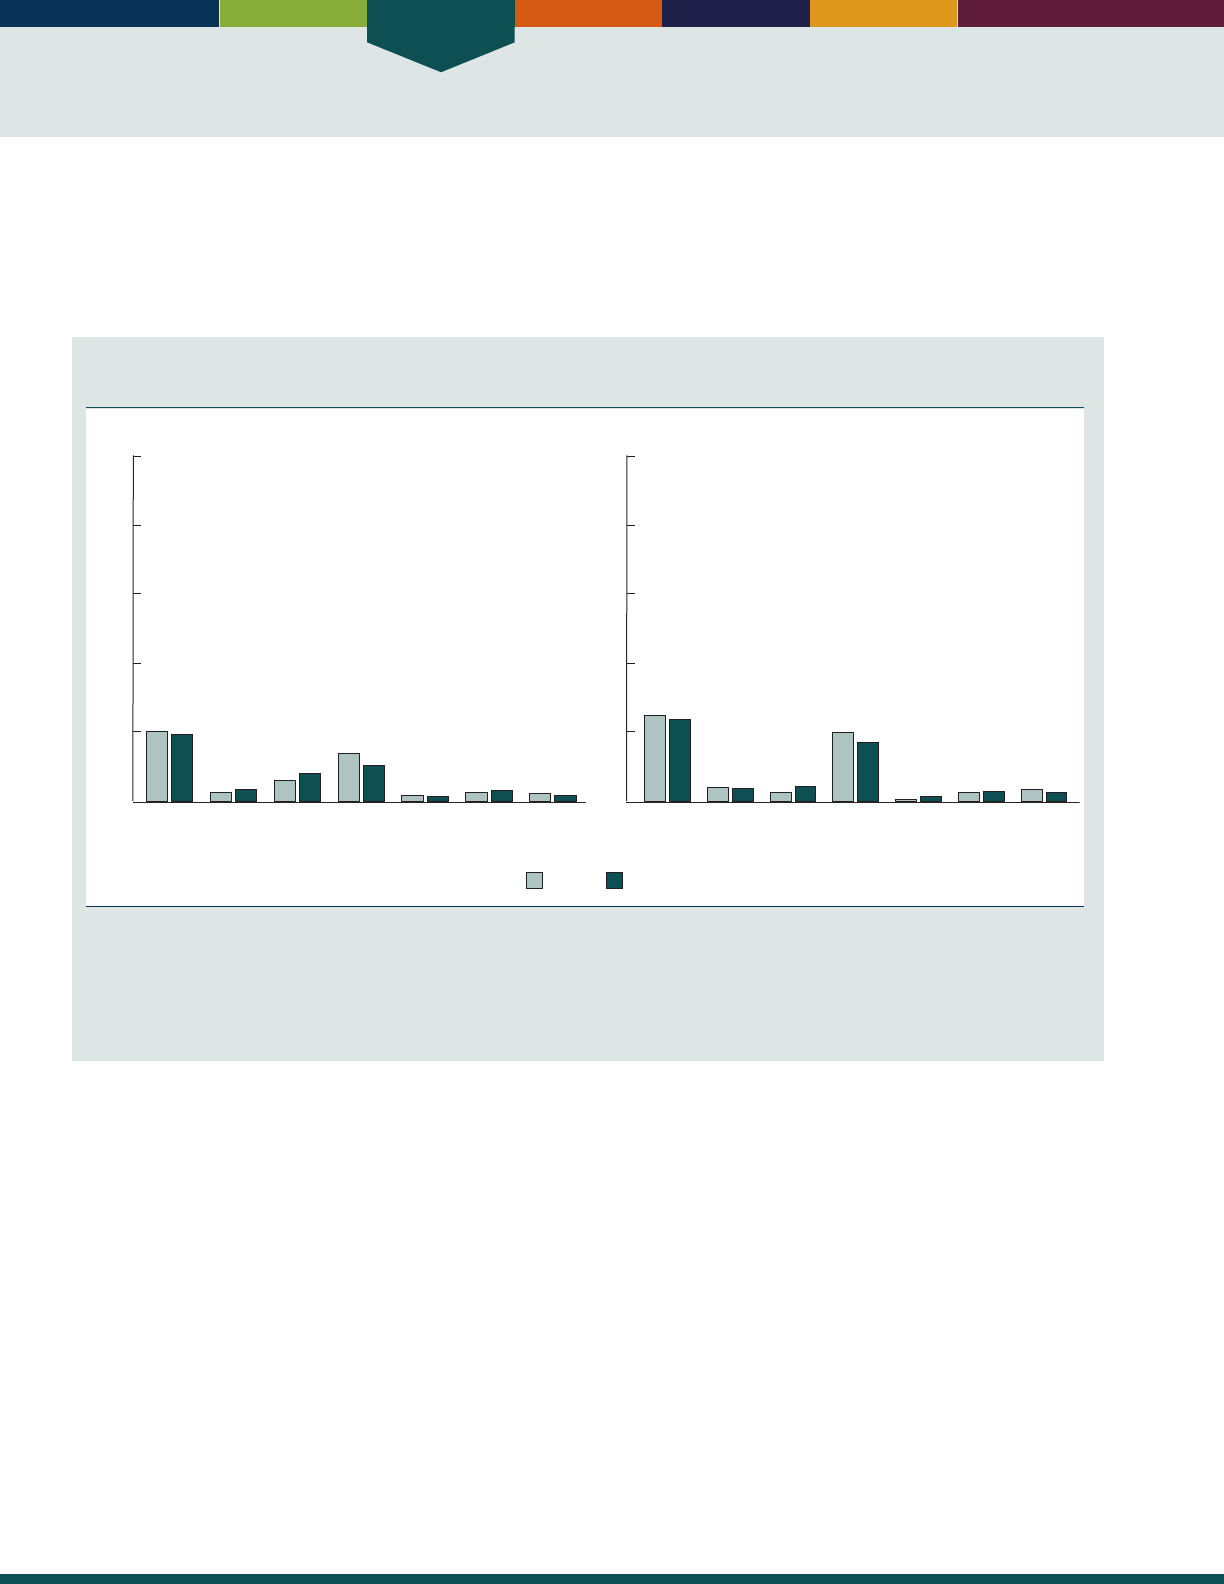
Health Status
34
INDICATOR 22: Functional Limitations
As people age, illness or injury may result in disability, including limitations in vision, hearing, mobility, communication,
cognition, or self-care. ese changes may have important implications for work and retirement policies, health and long-
term care needs, and policies aecting the built environment, all of which aect the well-being of the older population
and the ability to fully and independently participate in society.
Percentage of people age 65 and over with a disability, by sex and functional domain, 2010 and
2014
20142010
Any
disability
Vision Hearing Mo-
bility
Commu-
nication
Cog-
nition
Self−
care
Men
20
19
3
3
6
8
14
11
2
2
3
3
2
2
Percent
0
20
40
60
80
100
Any
disability
Vision Hearing Mo-
bility
Commu-
nication
Cog-
nition
Self−
care
Women
25
24
44
3
4
20
17
1
1
3
3
4
3
Percent
0
20
40
60
80
100
NOTE: Disability is dened as “a lot” or “cannot do/unable to do” when asked about difculty with seeing, even if wearing glasses (vision);
hearing, even if wearing hearing aids (hearing); walking or climbing steps (mobility); communicating, for example, understanding or being
understood by others (communication); remembering or concentrating (cognition); and self-care, such as washing all over or dressing (self-
care). Any disability is dened as having difculty with at least one of these activities. The data source and measures presented have changed
from previous editions of
Older Americans.
Data labels in this chart are based on rounded values.
Reference population: These data refer to the civilian noninstitutionalized population.
SOURCE: Centers for Disease Control and Prevention, National Center for Health Statistics, National Health Interview Survey.
• In 2014, 22 percent of the population age 65 and over
reported having a disability as dened by limitations in
vision, hearing, mobility, communication. cognition,
and self-care. Women were more likely to report any
disability than men (24 percent versus 19 percent).
• Diculties with mobility (walking or climbing stairs)
were the most commonly reported disability for those
age 65 and over in 2014 (17 percent of women and
11percent of men).
• Between 2010 and 2014, the percentage of the total
population age 65 and over with hearing diculties
increased, while the percentage with mobility
diculties decreased.
• Disability increases with age. In 2014, 42 percent
of people age 85 and over reported any disability,
compared with 17 percent of people ages 65–74.
People age 85 and over also had higher levels of
disability than people ages 65–74 in all the individual
domains of functioning.
• Non-Hispanic Blacks age 65 and over were more likely
to report having any disability than non-Hispanic
Whites (26 percent compared with 21 percent).
e percentage of those age 65 and over reporting
diculties with cognition and self-care was higher
among Hispanics compared with non-Hispanic Whites
(6 percent versus 3 percent, and 5 percent versus
2percent, respectively).
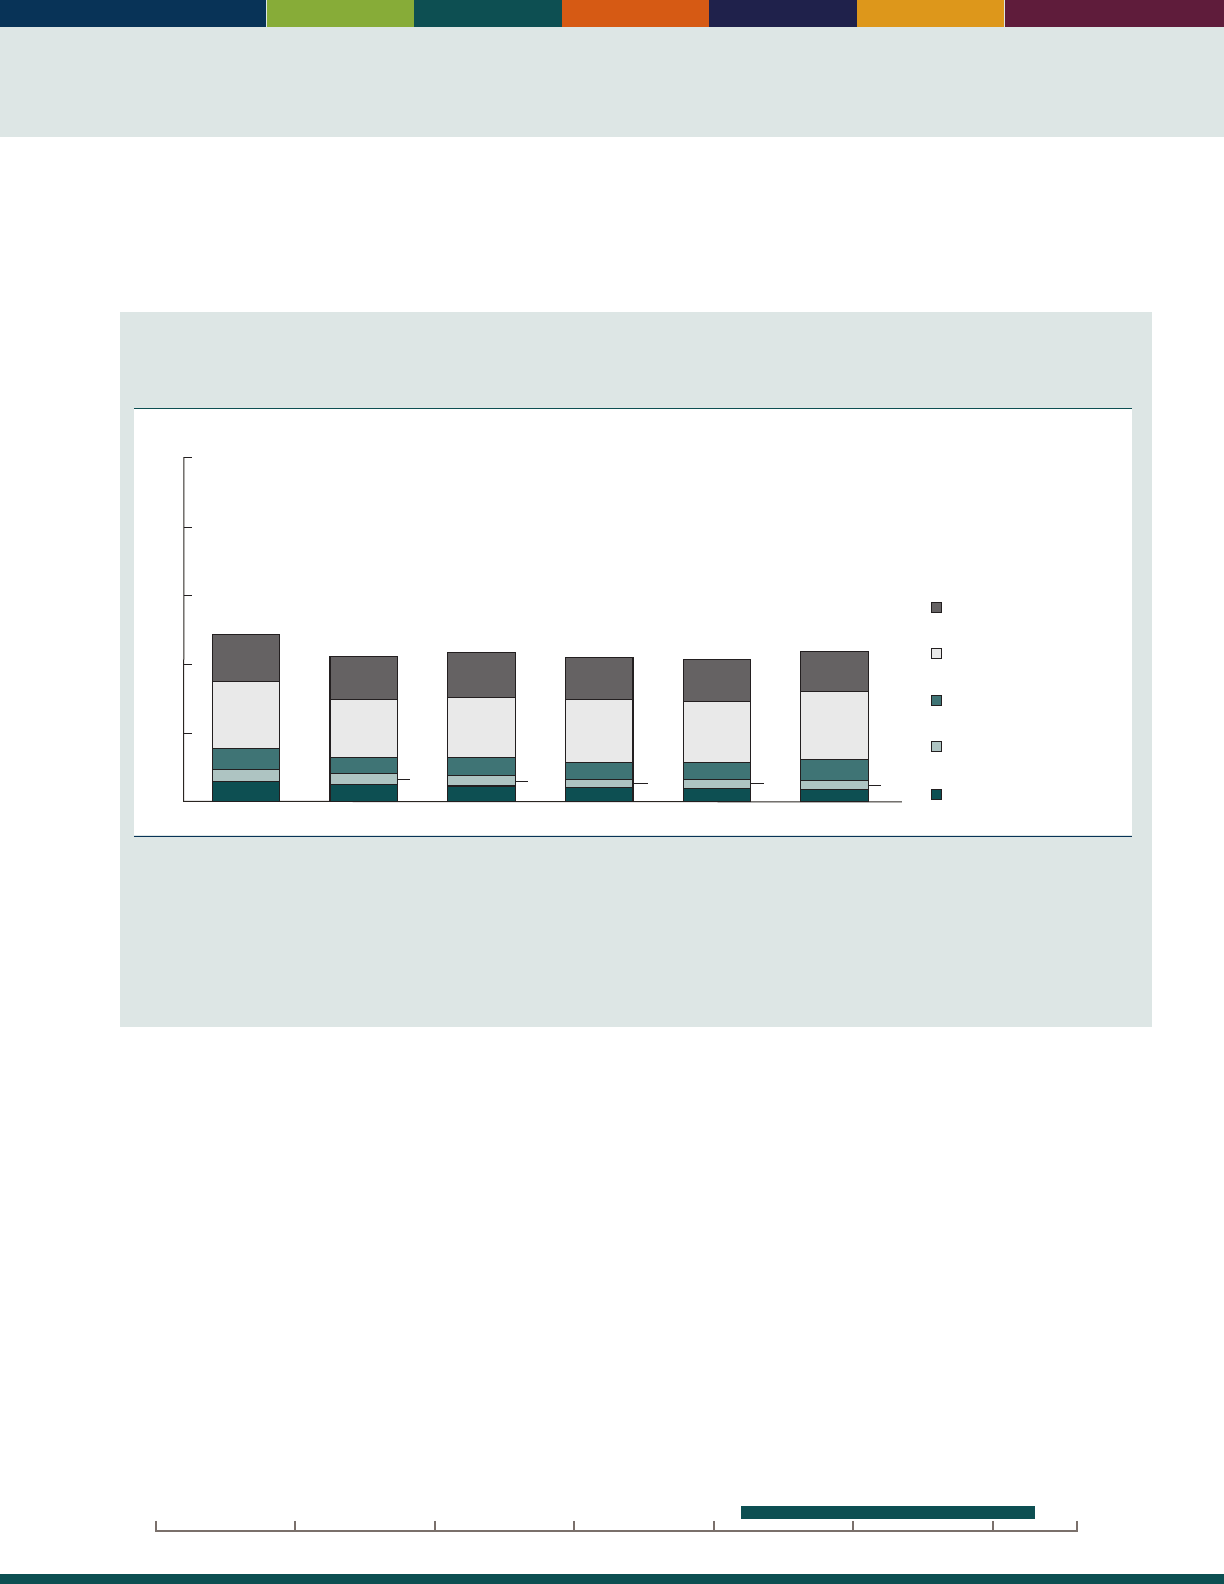
35
Diculties performing activities of daily living (ADLs), such as bathing, dressing, and toileting, and instrumental
activities of daily living (IADLs), such as housework, shopping, and managing money, aect the ability to live
independently. Tracking these changes over time is helpful to planning for the care needs of the older population.
Percentage of Medicare beneciaries age 65 and over who have limitations in performing
activities of daily living (ADLs) or instrumental activities of daily living (IADLs), or who are in a
long-term care facility, selected years 1992–2013
Percent
0
20
40
60
80
100
Limitations in
performing IADLs only
Limitations in
performing 1‒2 ADLs
Limitations in
performing 3‒4 ADLs
Limitations in
performing 5‒6 ADLs
In long-term care facility
6
4
6
20
49
14
1992
3
3
5
5
17
43
13
1997
3
5
5
17
44
13
2001
3
4
5
18
42
12
2005
3
4
5
18
41
12
2009
3
4
6
20
44
12
2013
NOTE: A residence is considered a long-term care facility if it is certied by Medicare or Medicaid; has three or more beds, is licensed as a
nursing home or other long-term care facility, and provides at least one personal care service; or provides 24-hour, 7-day-a-week supervision
by a caregiver. Limitations in performing activities of daily living (ADL) refer to difculty performing (or inability to perform for a health reason)
one or more of the following tasks: bathing, dressing, eating, getting in/out of chairs, walking, or using the toilet. Limitations in performing
instrumental activities of daily living (IADL) refer to difculty performing (or inability to perform for a health reason) one or more of the
following tasks: using the telephone, light housework, heavy housework, meal preparation, shopping, or managing money. Percentages are
age adjusted using the 2000 standard population. Estimates may not sum to the totals because of rounding.
Reference population: These data refer to Medicare beneciaries.
SOURCE: Centers for Medicare & Medicaid Services, Medicare Current Beneciary Survey, Access to Care.
• In 2013, 44 percent of people age 65 and over enrolled
in Medicare reported limitations in activities of daily
living, instrumental activities of daily living, or were
living in a long-term care facility. Roughly 12 percent
had diculty performing one or more IADLs but had
no ADL limitations. Approximately 29 percent had
diculty performing at least one ADL, and 4 percent
were ina facility.
• e age-adjusted proportion of people age 65 and over
with limitations in activities of daily living, instrumental
activities of daily living, or who were living in a long-
term care facility was lower in 2013 than in 1997
(44 percent compared with 49 percent). ere was a
decrease in the percentage with limitations from 1992 to
1996. From 1996 to 2013, the overall percentages did
not signicantly change, although a smaller proportion
of this population was in a facility than in earlier years.
• Women reported higher levels of limitations than
men. In 2013, about 49 percent of female Medicare
beneciaries age 65 and over had diculty performing
ADLs or IADLs, or were in a long-term care
facility, compared with 37 percent of male Medicare
beneciaries in this age group.
• Levels of limitation varied by age. Among Medicare
beneciaries age 85 and over, 74 percent had diculty
performing ADLs or IADLs or were in a long-term
care facility, compared with 48 percent of people ages
75–84 and 34 percent of people ages 65–74.
Data for this indicator’s charts and bullets can be found in
Tables 22a through 22e on pages 121–123.
20162000 201019901980197019601950

36

Health Risks
and Behaviors
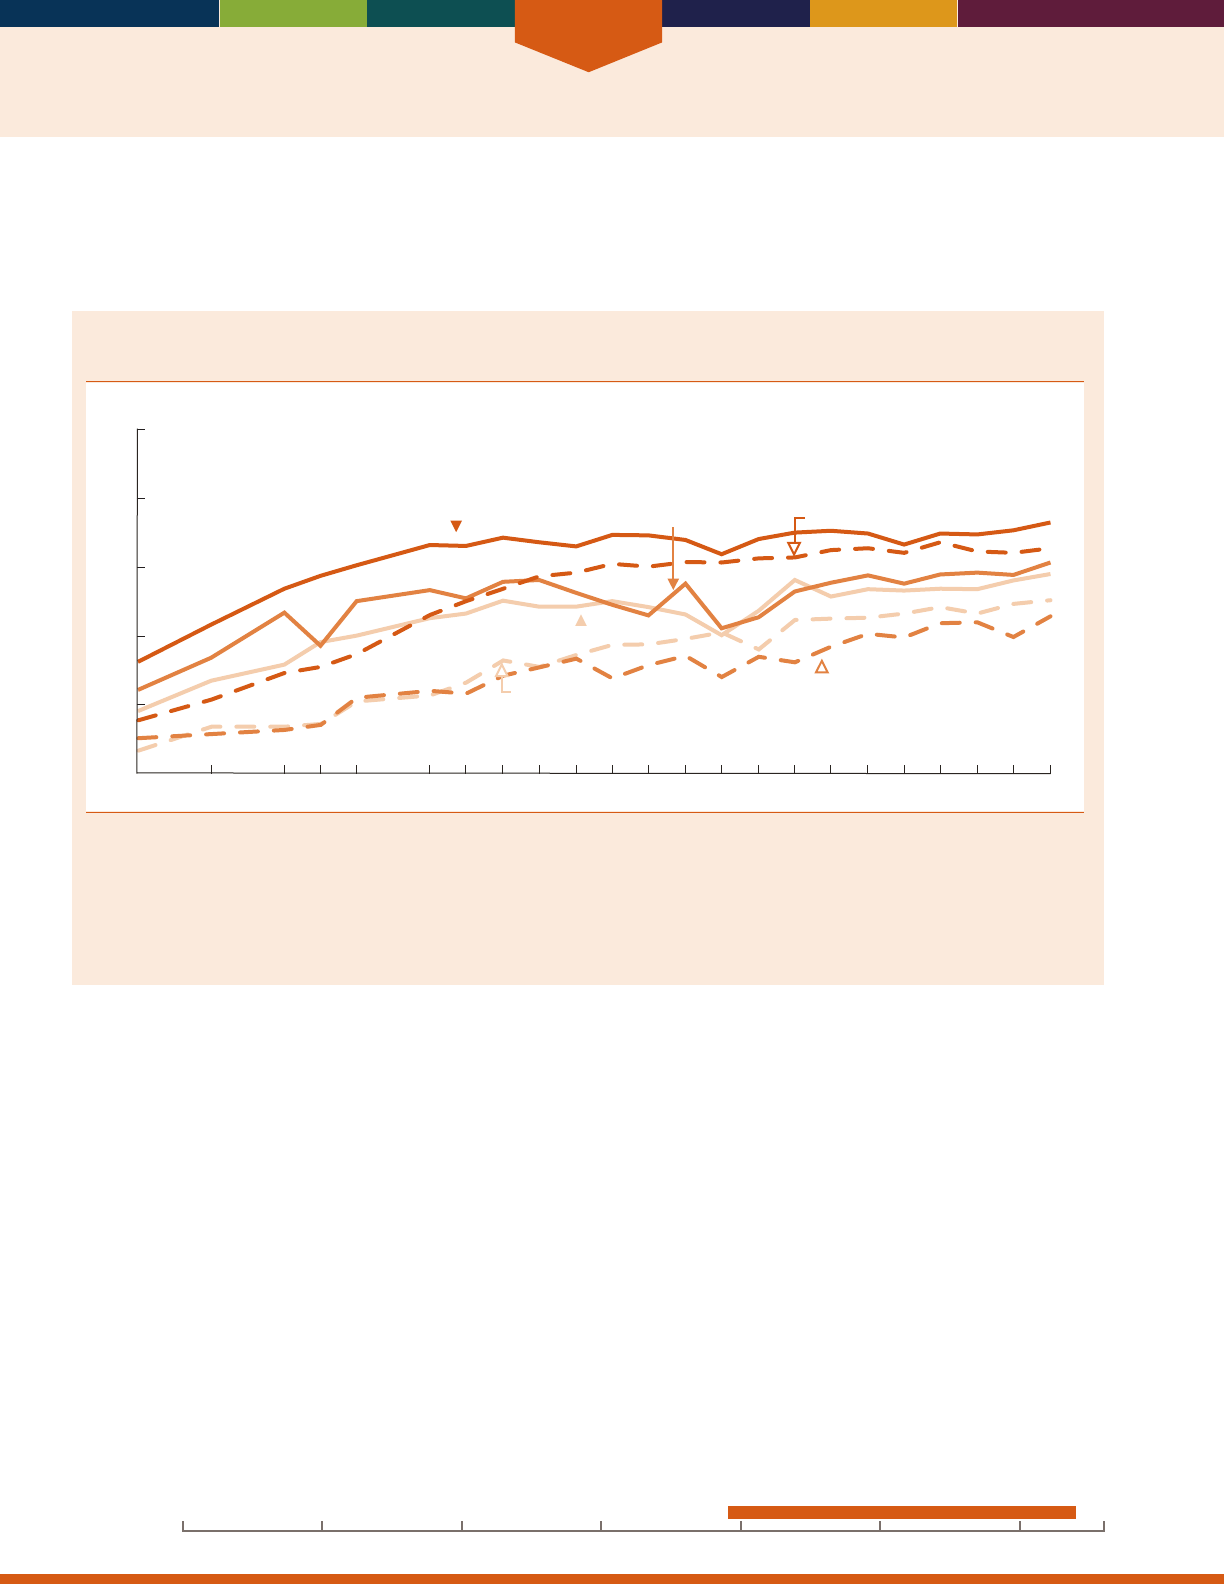
Health Risks and Behaviors
38
INDICATOR 23: Vaccinations
Vaccinations against inuenza and pneumococcal disease are recommended for older Americans, who are at increased
risk for these diseases and their complications as they age.
21,22,23
Inuenza (u) vaccinations are given annually, and
pneumococcal (pneumonia) vaccinations are usually given once or twice in a lifetime.
Percentage of people age 65 and over who reported having been vaccinated against inuenza
and pneumococcal disease, by race and Hispanic origin, selected years 1989–2014
Percent
0
20
40
60
80
100
Influenza
non-Hispanic White
Influenza
non-Hispanic Black
Influenza
Hispanic
Pneumococcal disease
non-Hispanic White
Pneumococcal disease
non-Hispanic Black
Pneumococcal disease
Hispanic
1989 1991 1993 1994 1995 1997 2000 2005 2014
2010
NOTE: For inuenza, the percentage vaccinated consists of people who reported having a u shot during the past 12 months. Beginning with
data from 2005, receipt of nasal spray u vaccine is included in the estimate of u vaccinations. For pneumococcal disease, the percentage
refers to people who reported ever having a pneumonia vaccination. Questions concerning the use of inuenza and pneumonia vaccinations
differed slightly on the National Health Interview Survey across the years for which data are shown. For details, see
Health, United States, 2015
Appendix II. See data sources for the denition of race and Hispanic origin in the National Health Interview Survey. Some data for 2005–2010
have been revised and differ from previous editions of
Older Americans.
Reference population: These data refer to the civilian noninstitutionalized population.
SOURCE: Centers for Disease Control and Prevention, National Center for Health Statistics, National Health Interview Survey.
• In 2014, 70 percent of people age 65 and over reported
receiving a u shot in the past 12 months; however,
there were dierences by race and ethnicity. About
72percent of non-Hispanic Whites reported receiving
a u shot, compared with 57 percent of non-Hispanic
Blacks and 61 percent of Hispanics.
• In 2014, about 61 percent of people age 65 and over
had ever received a pneumonia vaccination. Despite
increases in the rates for all groups over time, non-
Hispanic Whites (65 percent) were more likely to
have received a pneumonia vaccination in 2014
than non-Hispanic Blacks (50 percent) or Hispanics
(45percent).
• e percentage of older people receiving vaccinations
increased with age. In 2014, about 78 percent of
persons age 85 and over had received a u shot,
compared with 73 percent of persons age 75–84 and
67 percent of persons age 65–74. In that same year,
69 percent of persons 85 and over had ever received a
pneumonia vaccination compared with 56 percent of
persons age 65–74.
• In 2014, people age 65 and over who had not
graduated from high school were less likely to be
vaccinated against both u and pneumonia than were
people who had more education (64 percent versus
72percent for the u vaccination and 55 percent
versus 63 percent for the pneumonia vaccination).
Data for this indicator’s charts and bullets can be found in
Tables 23a and 23b on page 124.
20162000 201019901980197019601950
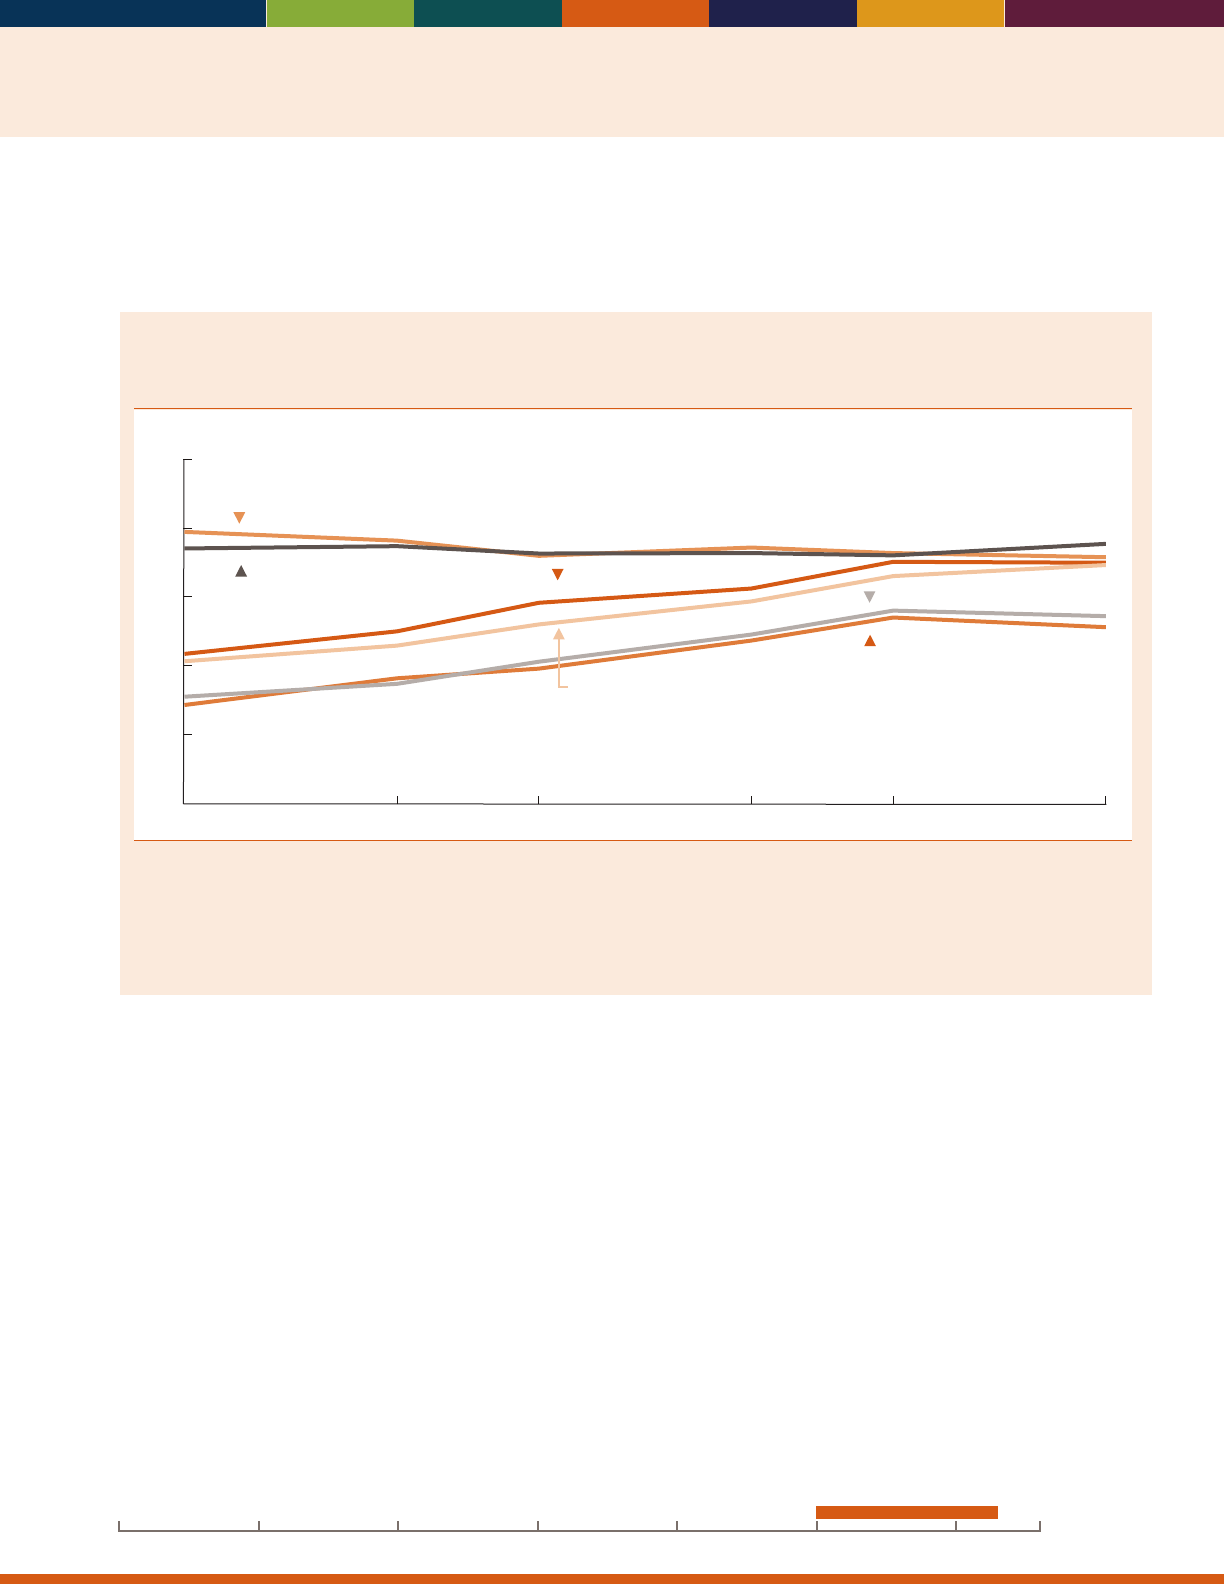
39
INDICATOR 24: Cancer Screenings
Health care services and screenings can help prevent disease or detect it at an early, treatable stage. e U.S. Preventive
Services Task Force recommends colorectal cancer screenings for people ages 50–75 and breast cancer screenings (i.e.,
mammography) for women ages 50–74.
24,25
Percentage of women ages 50–74 who had breast cancer screening and percentage of people
age 50–75 who had colorectal cancer (CRC) screening, by sex and age group, selected years,
2000–2013
100
80
60
40
20
0
Percent
2000 2003 2005 2008 2010 2013
CRC screening, male (50−64)
CRC screening, female (50−64)
CRC screening, male (65−75)
CRC screening, female (65−75)
Breast cancer screening, female (50−64)
Breast cancer screening, female (65−74)
NOTE: Breast cancer screening is dened as reporting having had a mammogram in the last 2 years. Colorectal cancer screening (CRC) is
dened as reporting a fecal occult blood test (FOBT) in the past year, a sigmoidoscopy procedure in the past 5 years with FOBT in the past 3
years, or a colonoscopy in the past 10 years. Questions concerning use of CRC screening and mammography differed slightly on the National
Health Interview Survey across the years for which data are shown. For details, see
Health, United States, 2015,
Appendix II. Breast cancer
screening is reported for women ages 50–74, and CRC screening is reported for men and women ages 50–75.
Reference population: These data refer to the civilian noninstitutionalized population.
SOURCE: Centers for Disease Control and Prevention, National Center for Health Statistics, National Health Interview Survey.
• e percentage of people ages 50–75 who received
colorectal cancer screening increased from 2000 to
2013. e percentage increased for both men and
women.
• In 2013, the percentage receiving colorectal cancer
screening was higher among people ages 65–75 than
among people ages 50–64 (70 percent versus 51
percent for men and 69 percent versus 54 percent
forwomen).
• Women ages 50–64 were slightly more likely than
men of the same age to have received colorectal cancer
screening in 2013 (54 percent versus 51 percent). ere
were no dierences by sex among people ages 65–75.
• e percentage of women ages 50–64 who received a
mammogram in the past 2 years declined from 2000
to 2013 (79 percent versus 71 percent). ere were no
signicant changes in the percentage of women ages
65–74 receiving a mammogram.
• A higher proportion of women in 2013 received a
mammogram in the past 2 years than met colorectal
cancer screening guidelines. For example, 71 percent of
women ages 50–64 received a mammogram compared
with 54 percent who met colorectal cancer screening
guidelines.
Data for this indicator’s charts and bullets can be found in
Table 24 on page 125.
20162000 201019901980197019601950
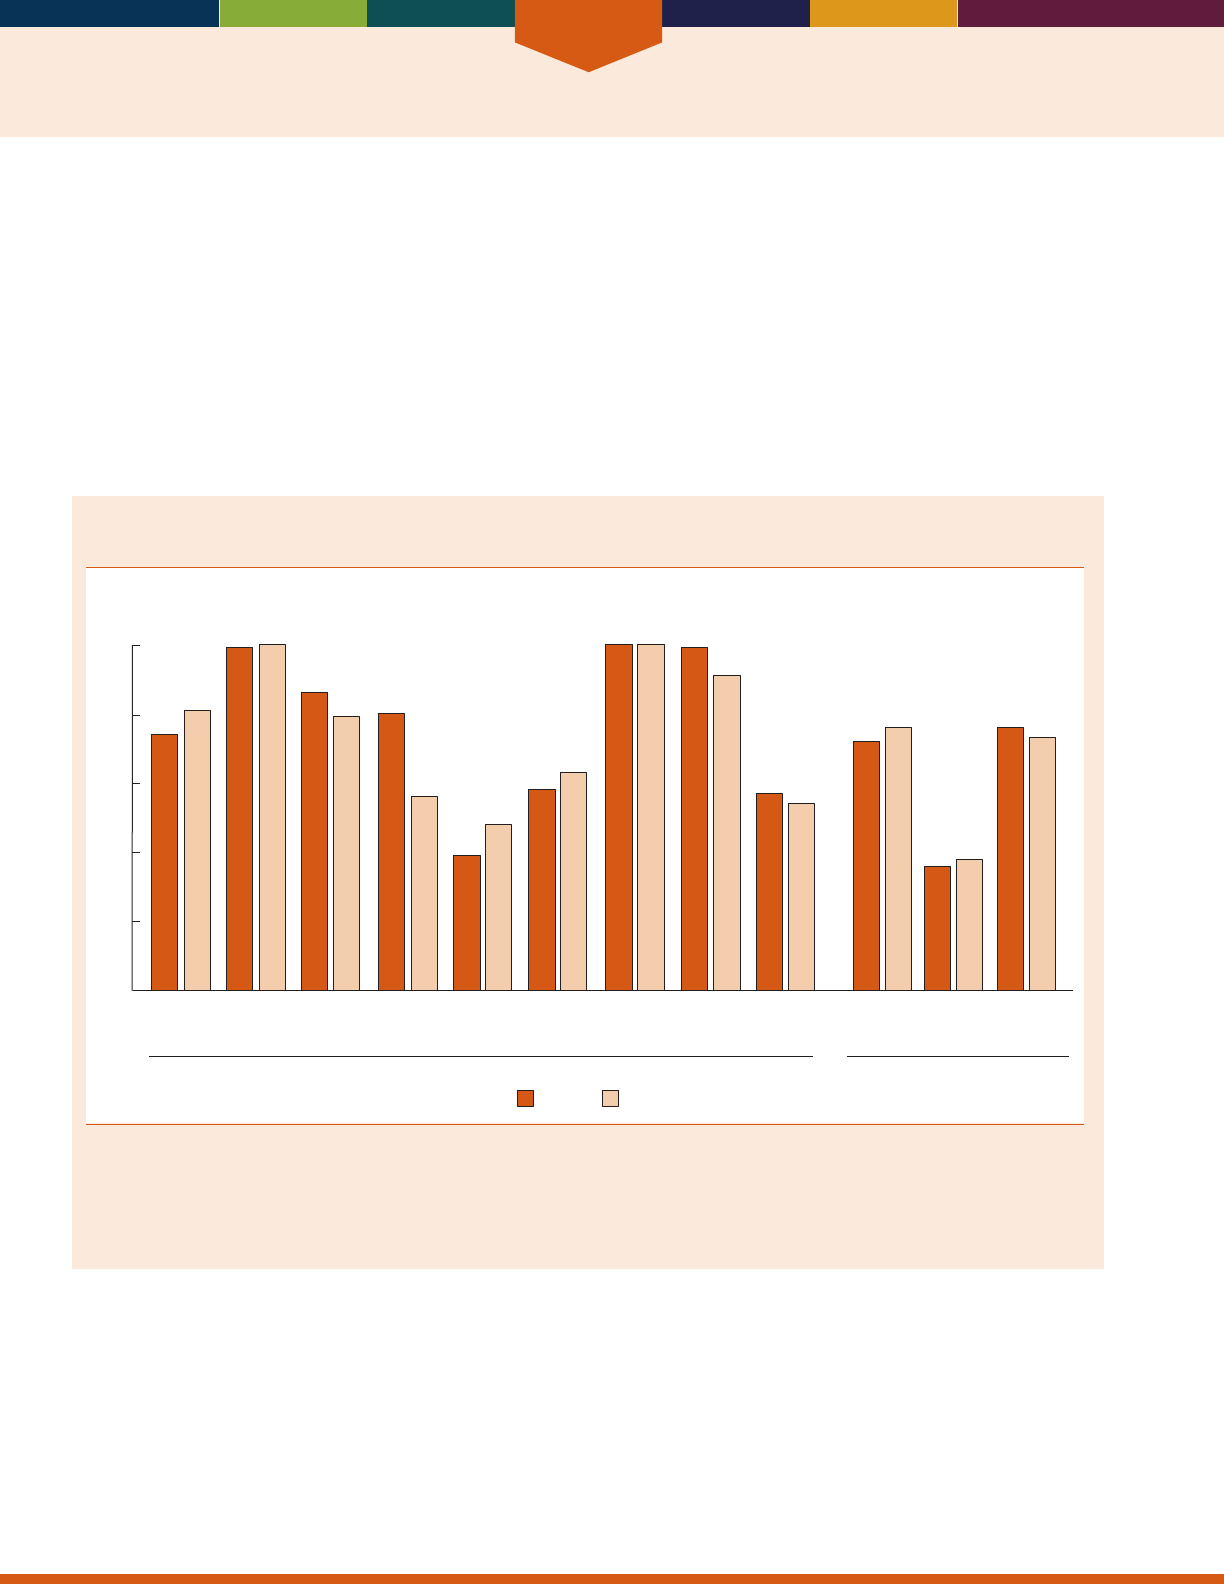
Health Risks and Behaviors
40
INDICATOR 25: Diet Quality
e majority of older Americans report a variety of chronic health conditions,
26
many of which are related to poor
quality diet. Healthy eating helps to prevent and reduce risk for many of the most common chronic conditions including
hypertension, heart disease, diabetes, osteoporosis, some cancers and obesity.
27,28
Among older adults, healthy eating is
also associated with a sense of well-being and improved quality of life.
27,28,29,30
e Healthy Eating Index (HEI) provides
a comprehensive analytic approach to characterizing complex diets and allows researchers to make associations between
total diet and health outcomes.
e HEI-2010
31
has 12 components, nine of which are adequacy components and three are moderation components.
Intakes of the various components of a healthy diet that are equal to or better than the standards set for each component
are assigned a maximum score. A higher score indicates a higher quality diet that aligns with the 2010 Dietary Guidelines
for Americans. Scores are averaged across all adults based on usual dietary intakes.
Healthy Eating Index-2010 average component scores expressed as a percentage of the HEI
maximum score for the population age 65 and over, by age group, 2011–2012
Total
fruit
Whole
fruit
Total
vegetables
Greens
and
beans
Whole
grains
Dairy Total
protein
foods
Seafood
and plant
proteins
Fatty
acids
Refined
grains
Dietary moderation
components
b
Dietary adequacy components
a
Sodium Empty
calories
c
99
100
39
48
99
91
74
86
79
80
56
38
58
100
72
36
63
100
57
54
76
81
76
73
Percent
75 and over65–74
0
20
40
60
80
100
[A higher score reflects an average diet that is closer to the standard.]
a
Higher scores reect higher intakes.
b
Higher scores reect lower intakes.
c
Empty calories are calories from solid fats (i.e., sources of saturated fats and trans fats) and added sugars (i.e., sugars not naturally occurring).
Reference population: These data refer to the resident noninstitutionalized population.
SOURCE: Centers for Disease Control and Prevention, National Center for Health Statistics, National Health and Nutrition Examination Survey,
and U.S. Department of Agriculture, Center for Nutrition Policy and Promotion, and National Cancer Institute. Healthy Eating Index-2010.
• During 2011–2012, total HEI-2010 scores for age
groups age 65 and over, 65–74, and 75 and over were
68.3, 68.4, and 67.8, respectively.
• Older Americans age 75 and over, met the dietary
recommendations for whole fruits, while Americans
from the age groups 65 and over, 65–74, and 75 and
over met the dietary recommendations for total protein
foods.
• e diet quality of older Americans can better align
with the 2010 Dietary Guidelines for Americans by
increasing dietary intakes of whole grains, vegetables
and legumes, fat-free or low-fat milk products, and
foods and beverages that are lower in sodium and have
fewer calories from solid fats and added sugars.
Data for this indicator’s charts and bullets can be found in
Table 25 on page 126.
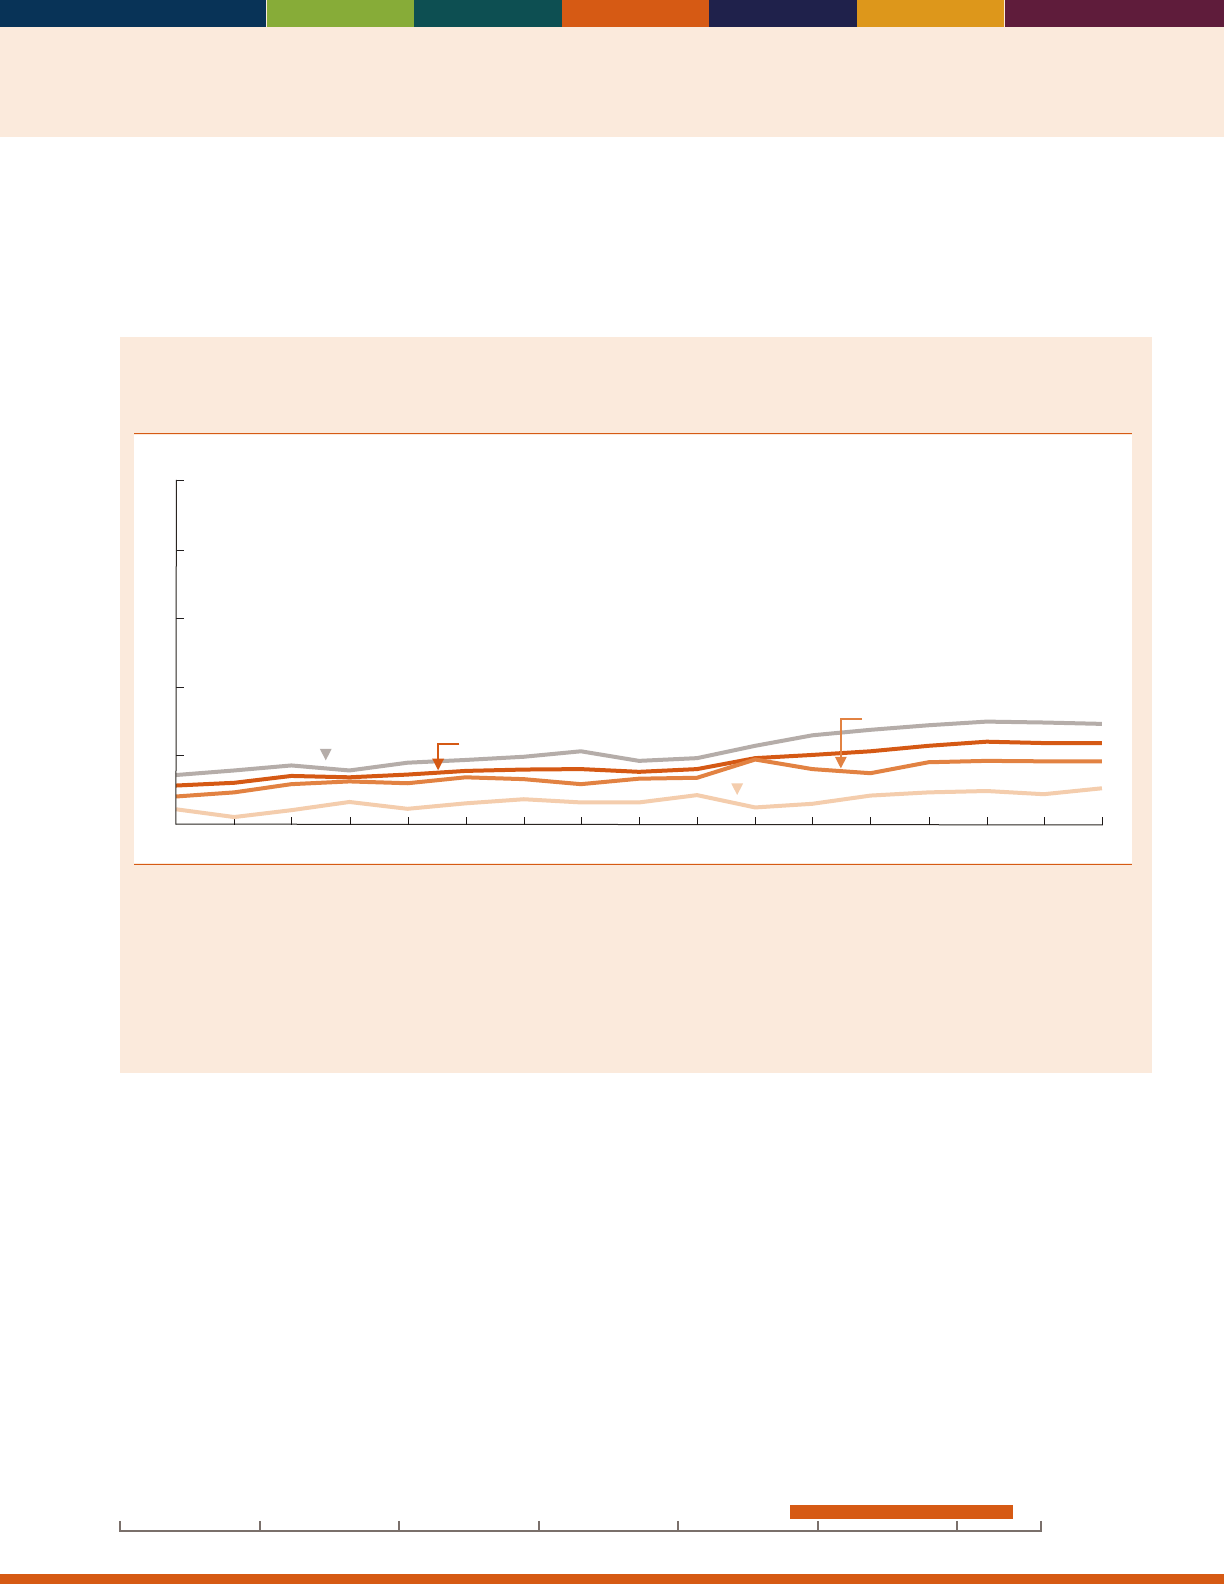
41
INDICATOR 26: Physical Activity
Physical activity is important for people of all ages. It improves overall health and reduces the risk of many health
problems.
32
For older adults, exercise can reduce the risk of certain chronic diseases and may oer psychological and
cognitive benets.
33
Physical activity can reduce pain and improve functioning.
34
Exercise is recommended as an
intervention to prevent falls in older adults.
35
Percentage of people age 65 and over who reported participating in leisure-time aerobic and
muscle-strengthening activities that meet the 2008 Federal physical activity guidelines, by age
group, 1998–2014
Percent
0
10
20
30
40
50
65–74
65 and over
75–84
85 and over
1998 2000 2002 2004 2006 2014
20122008 2010
NOTE: This measure of physical activity reects the 2008 Federal physical activity guidelines for Americans (available from: http://www.health.
gov/PAGuidelines/). The 2008 Federal guidelines recommend that adults age 65 and over who are t and have no limiting chronic conditions
perform at least 150 minutes (2 hours and 30 minutes) a week of moderate-intensity, or 75 minutes (1 hour and 15 minutes) a week of
vigorous-intensity aerobic physical activity or an equivalent combination of moderate- and vigorous-intensity aerobic activity. Aerobic activity
should be performed in episodes of at least 10 minutes, and preferably, it should be spread throughout the week. In addition, they should
perform muscle-strengthening activities that are moderate or high intensity and involve all major muscle groups on two or more days a week,
because these activities provide additional health benets. The measure shown here presents the percentage of people who fully met both the
aerobic activity and muscle-strengthening guidelines, irrespective of their chronic condition status.
Reference population: These data refer to the civilian noninstitutionalized population.
SOURCE: Centers for Disease Control and Prevention, National Center for Health Statistics, National Health Interview Survey.
• In 2014, about 12 percent of people age 65 and over
reported participating in leisure-time aerobic and
muscle-strengthening activities that met the 2008
Federal physical activity guidelines. e percentage of
older people meeting the physical activity guidelines
decreased with age, ranging from 15 percent among
people ages 65–74 to 5 percent among people age
85and over.
• Men age 65 and over were more likely than women
in the same age group to meet the physical activity
guidelines in 2014 (15 percent versus 9 percent). Non-
Hispanic Whites age 65 and over reported higher levels
of physical activity than their non-Hispanic Black and
Hispanic counterparts (13 percent compared with
9percent and 7percent, respectively).
• e percentage of older Americans meeting the 2008
Federal physical activity guidelines increased over time.
In 1998, about 6 percent of people age 65 and over
met the guidelines, compared with 12 percent in 2014.
• Although only 12 percent of people age 65 and over
met the guidelines for both aerobic and muscle-
strengthening activities in 2014, 37 percent met the
guidelines for aerobic activity and 17 percent met the
guidelines for muscle-strengthening activities that year.
Data for this indicator’s charts and bullets can be found in
Tables 26a and 26b on pages 127–128.
20162000 201019901980197019601950
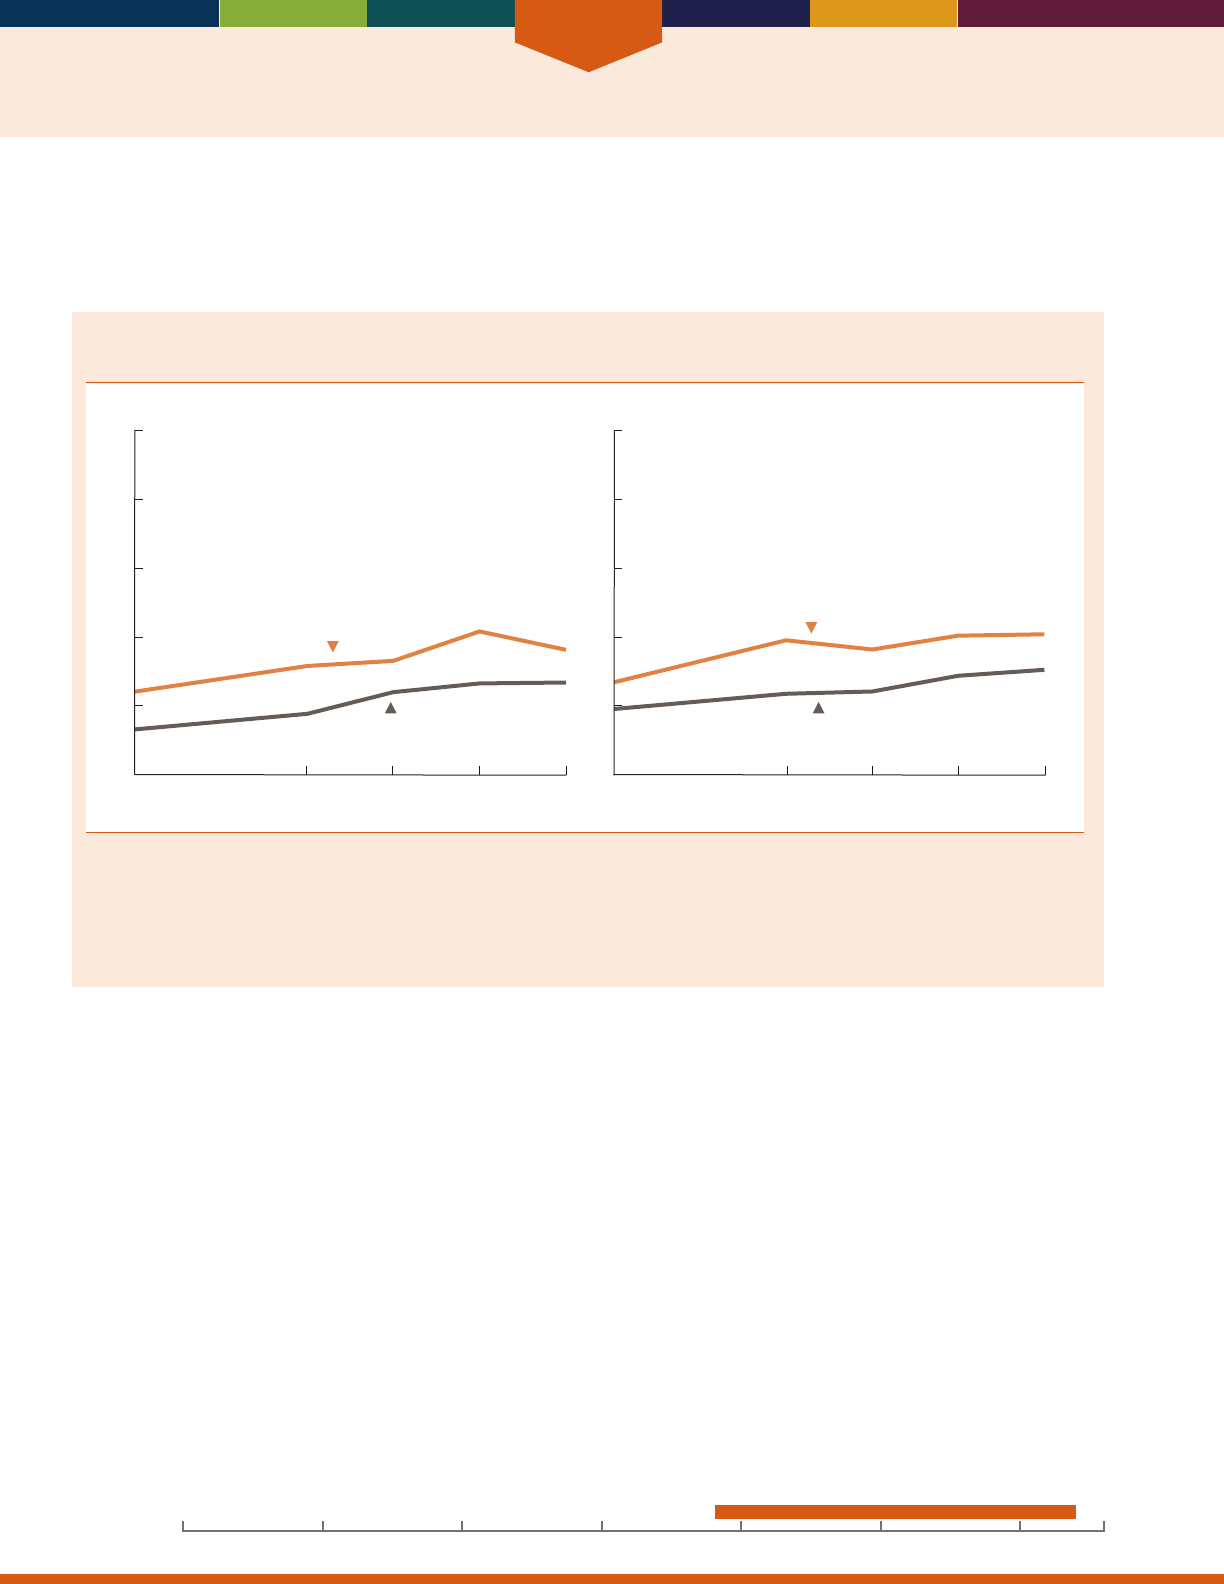
Health Risks and Behaviors
42
INDICATOR 27: Obesity
Obesity is a major cause of preventable disease and premature death.
36
It is associated with increased risk of coronary
heart disease; Type 2 diabetes; endometrial, colon, postmenopausal breast, and other cancers; asthma and other
respiratory problems; osteoarthritis; and disability.
37,38
Percentage of people age 65 and over with obesity, by sex and age group, selected years,
1988–2014
0
20
40
60
80
100
Men
1988–
1994
2003–
2006
2007–
2010
2011–
2014
1999–
2002
65–74
75 and over
Percent Percent
0
20
40
60
80
100
Women
1988–
1994
2003–
2006
2007–
2010
2011–
2014
1999–
2002
75 and over
65–74
NOTE: Data are based on measured height and weight. Height was measured without shoes. Obese is dened by a BMI of 30 kilograms/
meter
2
or greater. The percentage of people with obesity is a subset of the percentage of those who are overweight. See glossary for the
denition of BMI. Beginning in 1999, the National Health and Nutrition Examination Survey has been in the eld continuously with data
released every 2 years. Two survey cycles are often combined to create increased sample size, especially for subgroup estimates. Some data
have been revised and differ from previous editions of
Older Americans.
Reference population: These data refer to the civilian noninstitutionalized population.
SOURCE: Centers for Disease Control and Prevention, National Center for Health Statistics, National Health and Nutrition Examination Survey.
• As with other age groups, the percentage of people age
65 and over with obesity increased since 1988–1994.
In 2011–2014, about 35 percent of people age 65
and over had obesity, compared with 22 percent in
1988–1994.
• In 2011–2014, approximately 41 percent of women
ages 65–74 and 31 percent of women age 75 and over
had obesity. is is an increase from 1988–1994, when
27 percent of women ages 65–74 and 19 percent of
women age 75 and over had obesity.
• Older men followed similar trends. About 24 percent
of men ages 65–74 and 13 percent of men age 75 and
over had obesity in 1988–1994, compared with 36
percent of men ages 65–74 and 27 percent of men age
75 and over in 2011–2014.
• Over the past 15 years between 1999–2002 and 2011–
2014, there has been an increase in the prevalence of
obesity for both men and women.
Data for this indicator’s charts and bullets can be found in
Table 27 on page 129.
20162000 201019901980197019601950
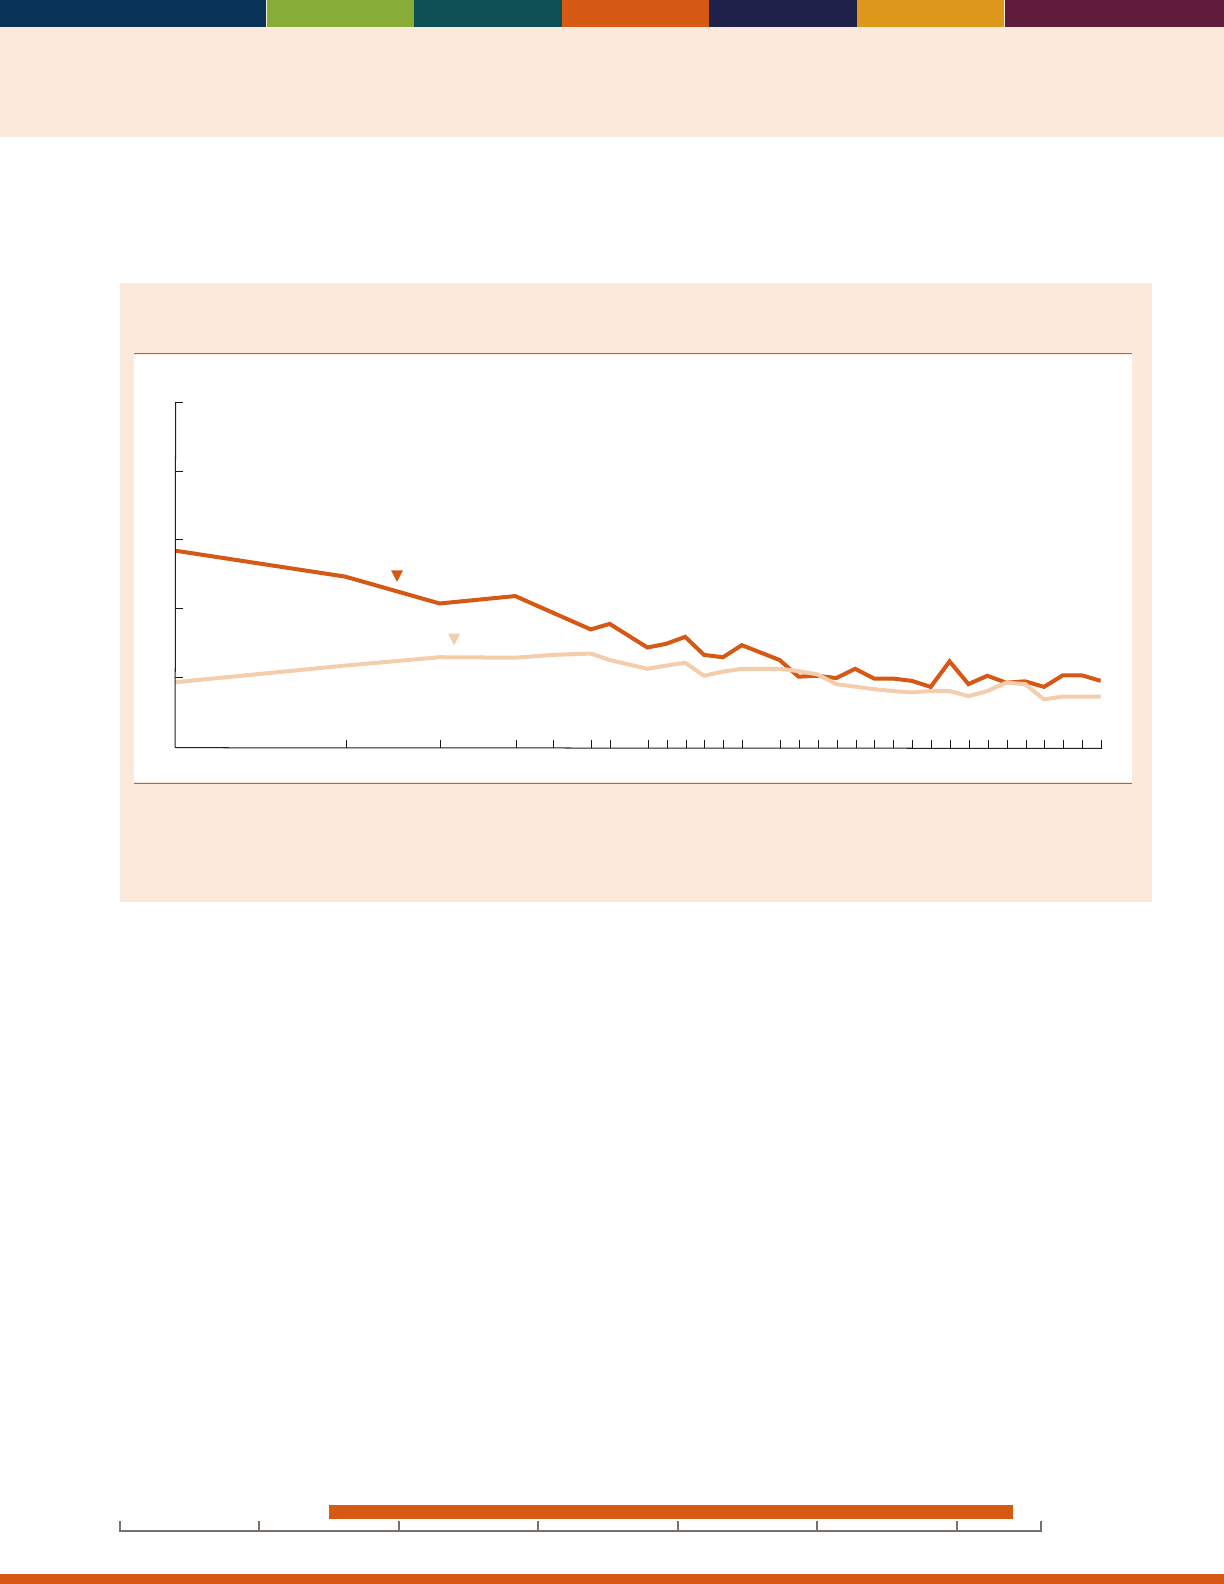
43
INDICATOR 28: Cigarette Smoking
Smoking aects nearly every organ of the body; it causes diminished health status and diseases such as cancer,
cardiovascular disease, and chronic obstructive lung diseases.
39
Percentage of people age 65 and over who are current cigarette smokers, by sex, selected years,
1965–2014
1974 1979 1983 1990 1995 2000 2005 2010
Men
Women
1965 2014
Percent
0
10
20
30
40
50
NOTE: Questions concerning cigarette smoking differed slightly on the National Health Interview Survey across the years for which data are
shown. Data starting in 1997 are not strictly comparable with data for earlier years due to the 1997 National Health Interview Survey (NHIS)
questionnaire redesign. For details, see
Health, United States, 2015,
Appendix II.
Reference population: These data refer to the civilian noninstitutionalized population.
SOURCE: Centers for Disease Control and Prevention, National Center for Health Statistics, National Health Interview Survey.
• e percentage of people age 65 and over who were
current cigarette smokers declined between 1965 and
2014, with larger declines among men than women.
Levels of cigarette smoking have been stable in the past
decade. In 2014, 10 percent of men and 8 percent of
women age 65 and over were current smokers.
• In 2014, the percentage of older men who were
current smokers was higher among Blacks than Whites
(14percent versus 9 percent). e percentages for older
women were similar for Whites and Blacks (both were
8 percent).
• A large percentage of both men and women age 65 and
over were former smokers. In 2014, about 50 percent
of older men previously smoked cigarettes, while
30 percent of women age 65 and over were former
smokers.
• e percentage of people age 65 and over who were
current smokers was higher among those that lived
below the poverty threshold than among those with
incomes above the poverty threshold. In 2014,
14percent of people age 65 and over with incomes less
than 100 percent of the poverty threshold were current
smokers, compared with7 percent of people in the 200
percent or more ofpoverty threshold income category.
Data for this indicator’s charts and bullets can be found in
Tables 28a through 28c on pages 130–131.
20162000 201019901980197019601950

44

Health Care
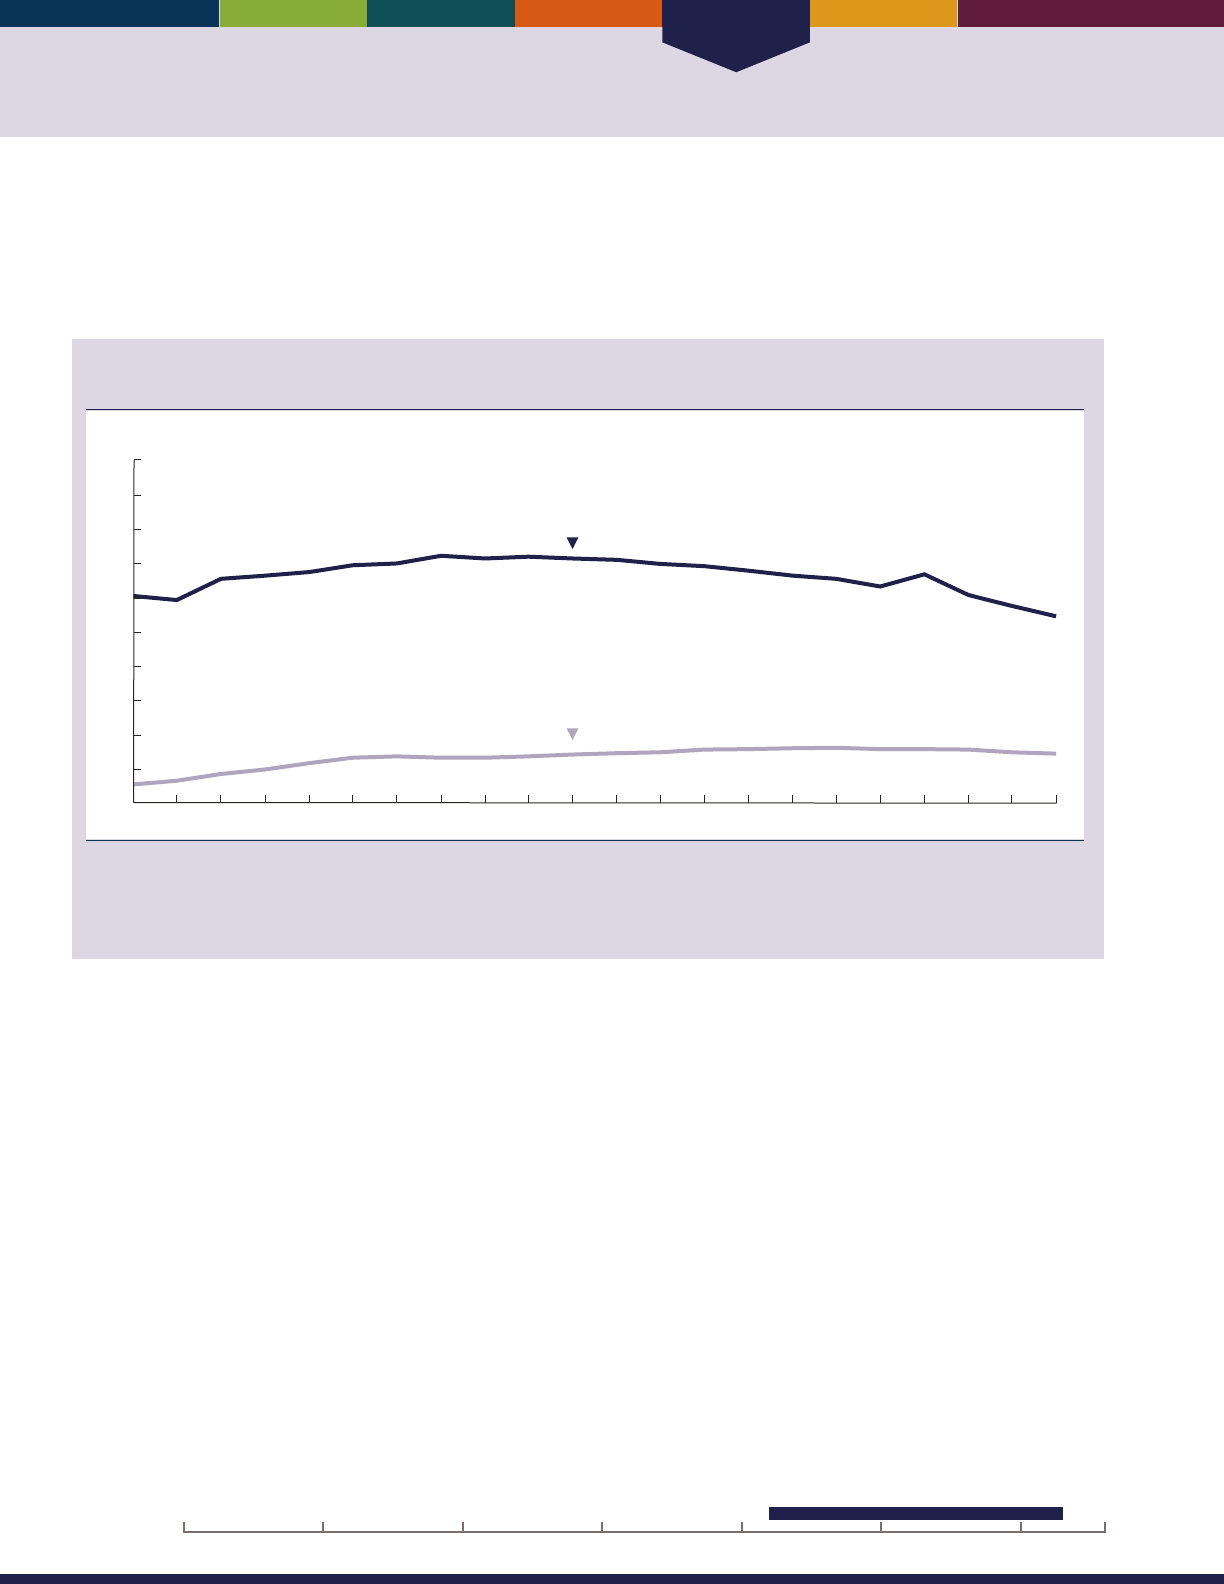
Health Care
46
INDICATOR 29: Use of Health Care Services
Most older Americans have health insurance through Medicare. Medicare covers a variety of services, including inpatient
hospital care, physician services, hospital outpatient care, home health care, skilled nursing facility care, hospice services,
and (beginning in January 2006) prescription drugs. Utilization rates for many services change over time because of
changes in physician practice patterns, medical technology, Medicare payment amounts, and patient demographics.
Medicare-covered hospital and skilled nursing facility stays per 1,000 Medicare beneciaries age
65 and over in fee-for-service, 1992–2013
1992 1995 2000 2005 2010 2013
0
50
100
150
200
250
300
350
400
450
500
Stays per 1,000 beneficiaries
Hospital stays
Skilled nursing facility stays
NOTE: Data are for Medicare beneciaries in fee-for-service only. Beginning in 1994, managed care beneciaries were excluded from the
denominator of all utilization rates because utilization data are not available for them. Prior to 1994, managed care beneciaries were included
in the denominators; they made up 7 percent or less of the Medicare population. See glossary for denition of fee-for-service.
Reference population: These data refer to the Medicare beneciaries.
SOURCE: Centers for Medicare & Medicaid Services, Medicare claims and enrollment data.
• Between 1992 and 1999, the hospitalization rate
increased from 306 hospital stays per 1,000 Medicare
beneciaries to 365 per 1,000. After 1999, the rate
decreased until 2009 and then increased slightly to
338 per 1,000 beneciaries in 2010. Since 2010, the
rate has continued to decrease, reaching 276 per 1,000
beneciaries in 2013. e average length of a hospital
stay decreased from 8.4 days in 1992 to 5.3 days in
2013.
• Skilled nursing facility stays increased from 28 per
1,000 Medicare beneciaries in 1992 to 80per 1,000
in 2010. Much of the increase occurred from 1992 to
1997. e number of skilled nursing facility stays has
dropped slightly after 2011, decreasing to 73per 1,000
beneciaries in 2013.
20162000 201019901980197019601950
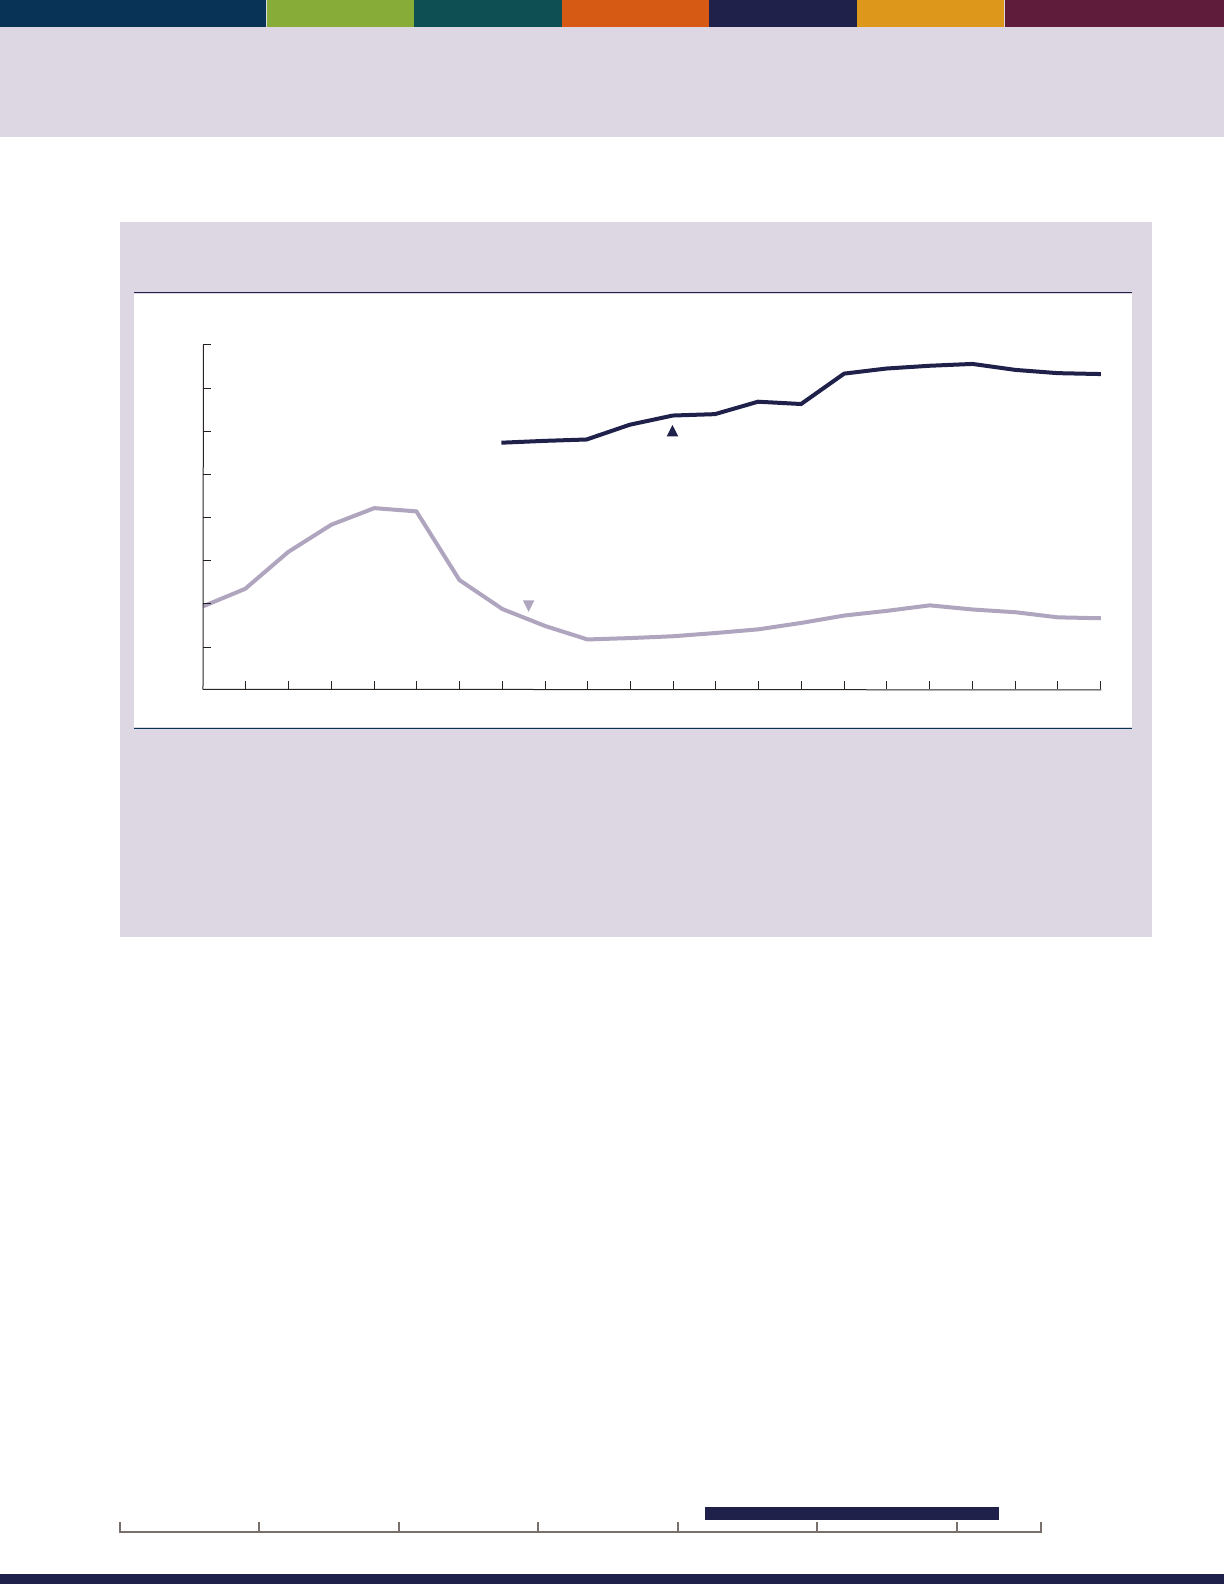
47
Medicare-covered physician and home health care visits per 1,000 Medicare beneciaries age 65
and over in fee-for-service, 1992–2013
1995 2000 2005 2010 20131992
0
2,000
4,000
6,000
8,000
10,000
12,000
14,000
16,000
Visits per 1,000 beneficiaries
Physician visits and consultations
Home health care visits
NOTE: Data are for Medicare beneciaries in fee-for-service only. Physician visits and consultations include all settings, such as physician
ofces, hospitals, emergency rooms, and nursing homes. The database used to generate rates of physician visits and consultations in previous
Older Americans
reports is no longer available. This chart uses two different databases based on the availability of data to estimate rates
of physician visits and consultations. The rst database provides data that begins with 1999 data through 2006 and the second database
provides data beginning with 2007. As a result, some data for 2007–2009 have been revised and differ from previous editions of
Older
Americans.
Beginning in 1994, managed care beneciaries were excluded from the denominator of all utilization rates because utilization data
are not available for them. Prior to 1994, managed care beneciaries were included in the denominators; they made up 7 percent or less of the
Medicare population. See glossary for denition of fee-for-service.
Reference population: These data refer to Medicare beneciaries.
SOURCE: Centers for Medicare & Medicaid Services, Medicare claims and enrollment data.
• e number of physician visits and consultations
increased from 11,395 per 1,000 Medicare beneciaries
in 1999 to 14,587 per 1,000 Medicare beneciaries
in2013.
• e number of home health care visits increased
from 3,822 per 1,000 Medicare beneciaries in 1992
to 8,376 per 1,000 Medicare beneciaries in 1996.
Home health care use increased during this period in
part because of an expansion in the coverage criteria
for the Medicare home health care benet.
40
Home
health care visits declined after 1997 to 2,295 per
1,000 beneciaries in 2001. e decline coincided
with changes in Medicare payment policies for home
health care resulting from implementation of the
Balanced Budget Act of 1997. Since 2001, the visit
rate increased to 3,864 per 1,000 beneciaries in 2009
and has declined since that time to 3,276 per 1,000
beneciaries in 2013.
• Use of skilled nursing facility and home health
care increased with age. In 2013, there were about
67skilled nursing facility stays per 1,000 Medicare
beneciaries ages 65–74, compared with about 204
per 1,000 beneciaries age 85 and over. Home health
care agencies made 1,475 visits per 1,000 beneciaries
ages 65–74, compared with 8,604 visits per 1,000
beneciaries for those age 85and over.
Data for this indicator’s charts and bullets can be found in
Tables 29a and 29b on page 132.
20162000 201019901980197019601950
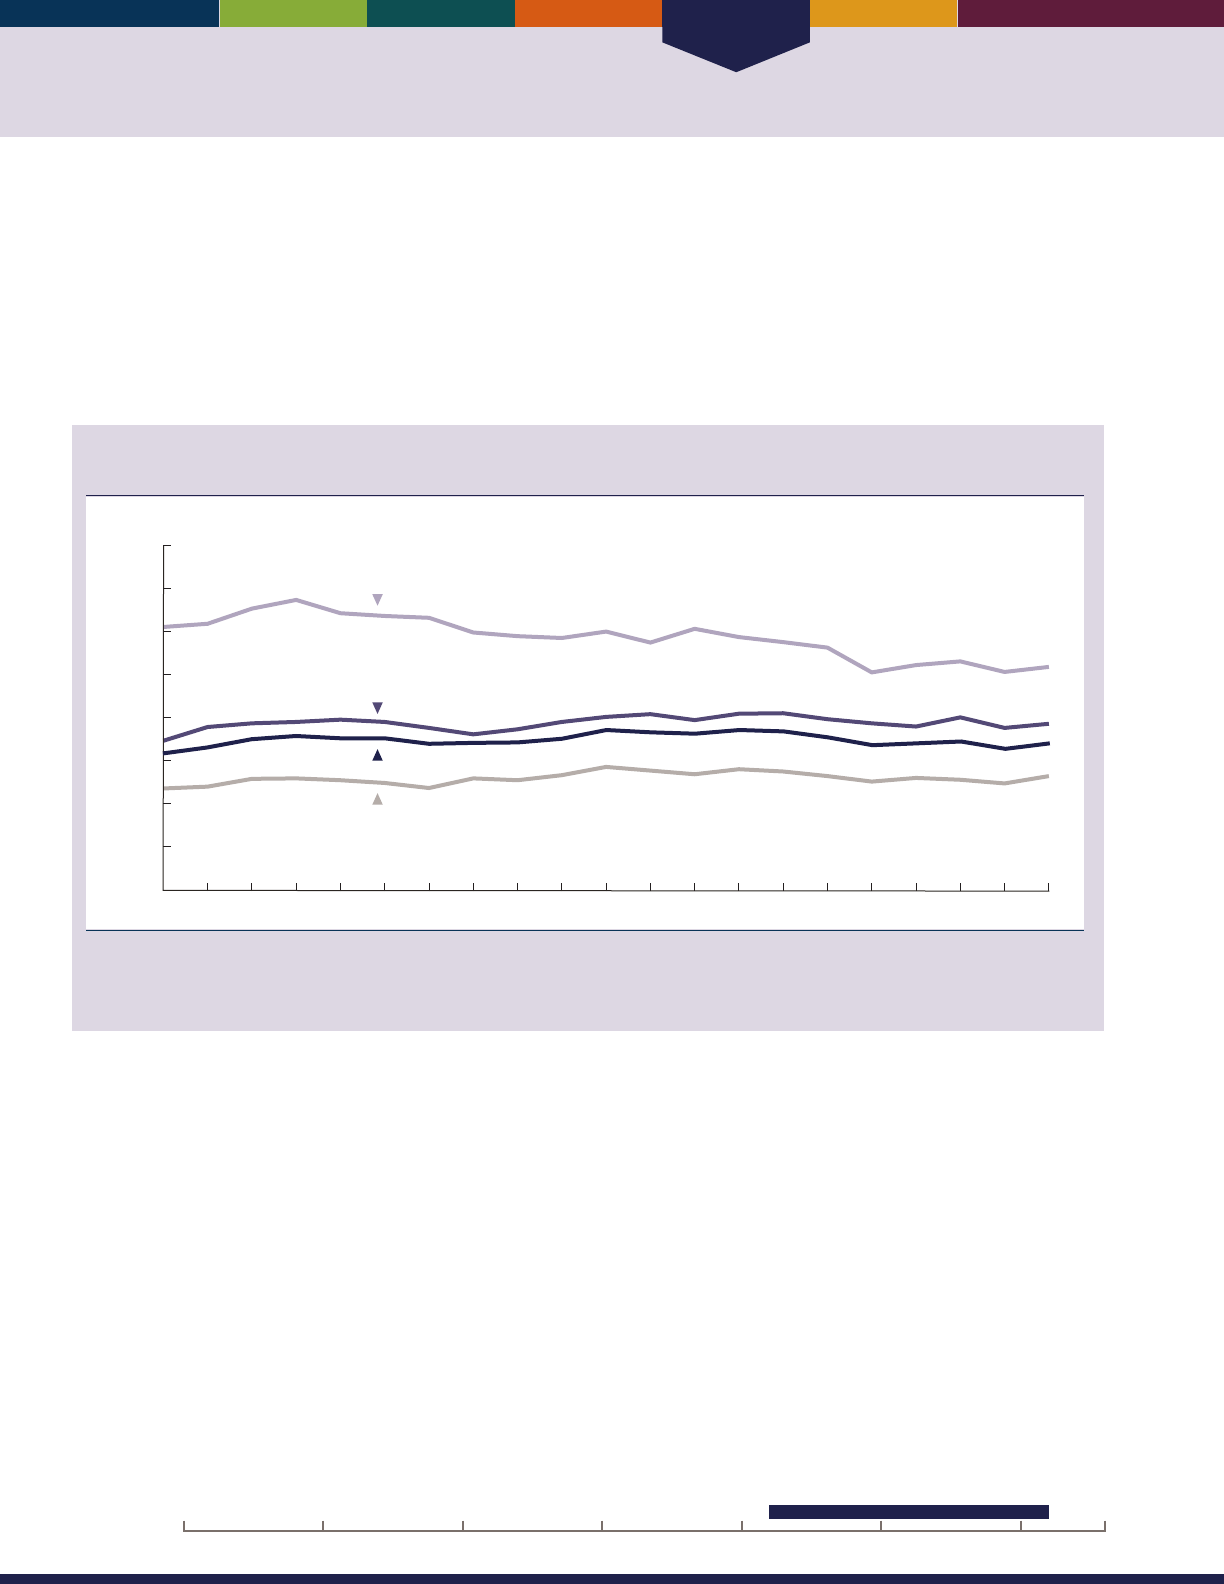
Health Care
48
INDICATOR 30: Health Care Expenditures
Health care costs per capita for the oldest Medicare beneciaries (age 85 and over) are higher than for any other age group
but have remained relatively stable over time. Health care costs per capita, however, for those ages 65–74 did increase
between 1992 and 2012
.
Health care costs post a major concern for older Americans. Among Medicare beneciaries age 65 and over, these costs
vary by demographic characteristics such as income, health status, and access to health care. On average, individuals with
no chronic health conditions incur lower health care costs. e percentage of Medicare beneciaries reporting diculty
obtaining health care remains low.
Average annual health care costs, in 2012 dollars, for Medicare beneciaries age 65 and over by
age group, 1992–2012
Dollars
1992 1994 1996 1998 2000 2002 2004 2006 2012
85 and over
75−84
65−74
0
5,000
10,000
15,000
20,000
25,000
30,000
35,000
$40,000
2008 2010
65 and over
NOTE: Data include both out-of-pocket costs and costs covered by insurance. Dollars are ination adjusted to 2012 using the Consumer Price
Index (Series CPI-U-RS). Some data have been revised from previously published gures as a result of a CPI adjustment.
Reference population: These data refer to Medicare beneciaries.
SOURCE: Centers for Medicare & Medicaid Services, Medicare Current Beneciary Survey, Cost and Use.
• After adjusting for ination, annual health care costs
per capita increased slightly among those ages 65–74
between 1992 and 2012.
• Average annual costs were substantially higher for
Medicare beneciaries age 85 and over compared with
those in other agegroups.
• Average annual health care costs for Medicare
beneciaries varied by demographic characteristics. In
2012, low-income individuals incurred higher health
care costs; those with less than $10,000 in income
averaged $24,596 in health care costs, whereas those
with more than $30,000 in income averaged only
$14,687.
• Access to health care is determined by a variety of
factors related to the cost, quality, and availability of
health care services. e percentage of older Americans
who reported they delayed getting care because of
cost declined from about 10 percent in 1992 to about
5 percent in 1997 and remained relatively constant
thereafter, uctuating between 4 and 6 percent. e
percentage of Medicare beneciaries who reported
diculty obtaining health care uctuated between
2and 3 percent.
20162000 201019901980197019601950
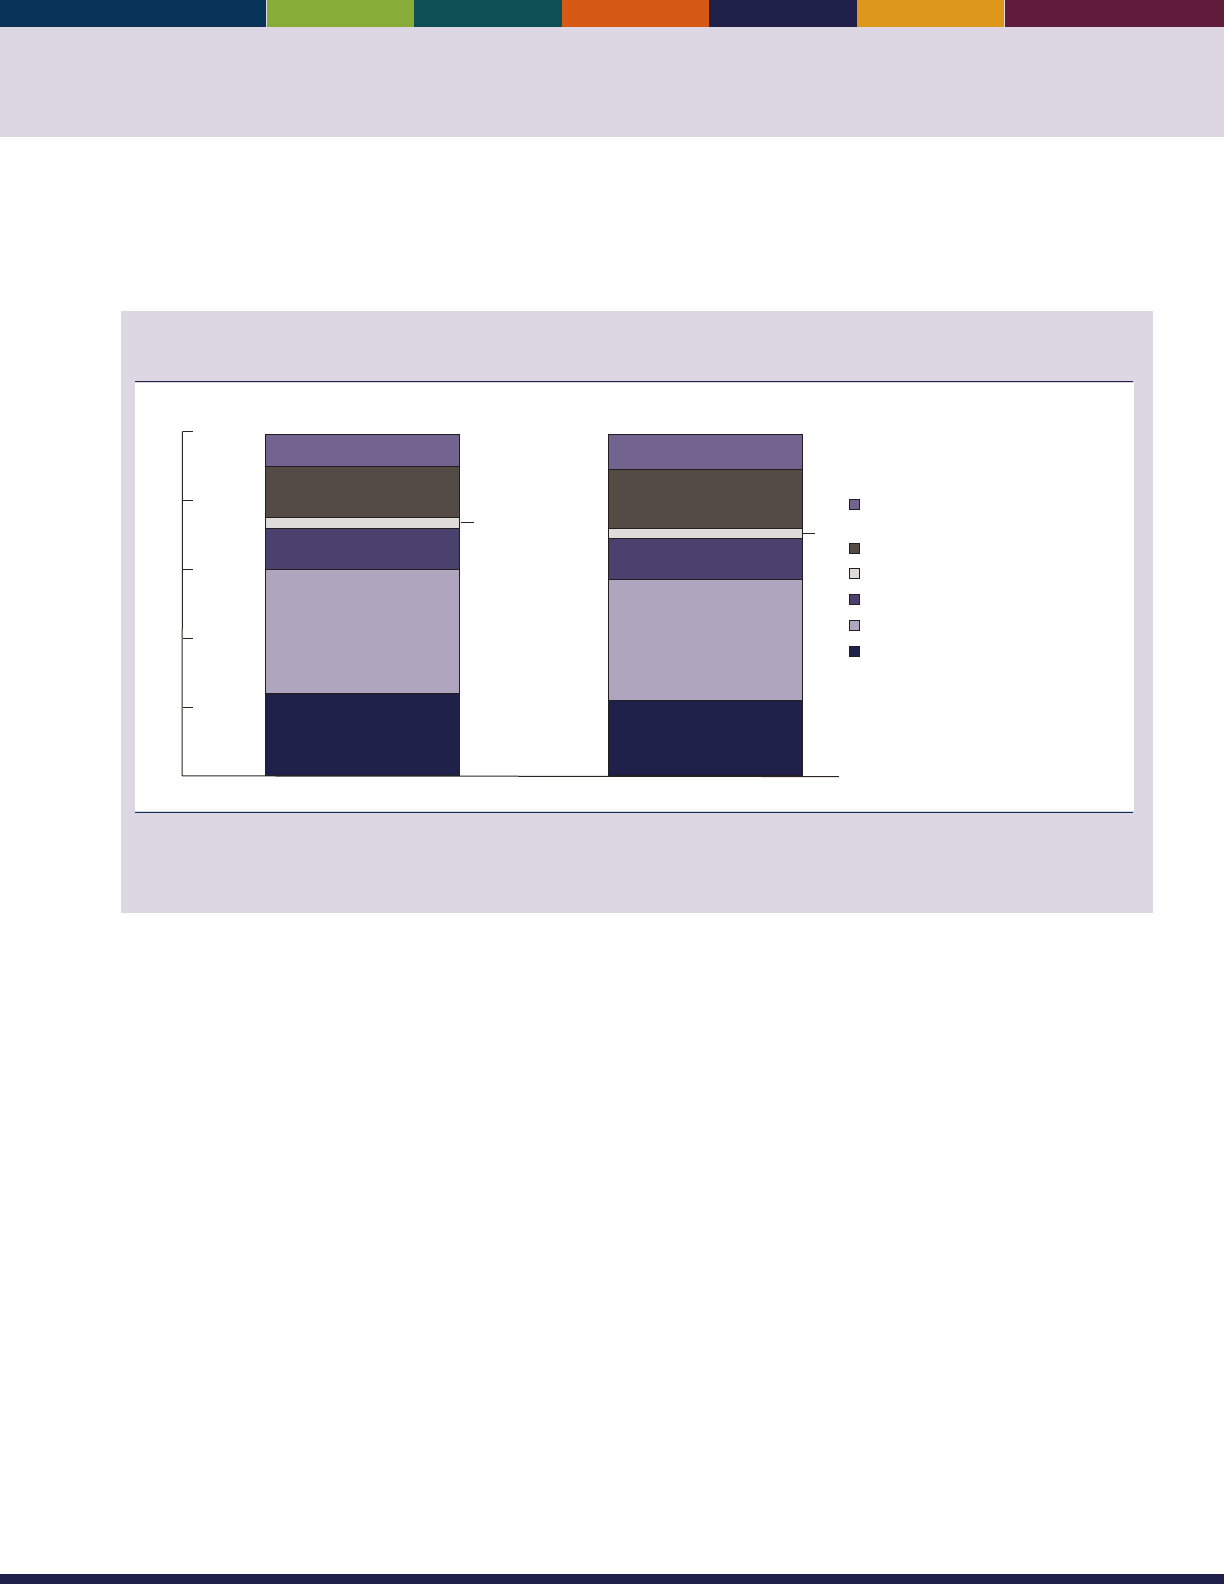
49
Health care costs can be broken down among dierent types of goods and services. e amount of money older
Americans spend on health care and the type of health care that they receive provide an indication of the health status
and needs of older Americans in dierent age and income groups.
Percentage distribution of annual health care costs among Medicare beneciaries age 65 and
over, by major cost component, 2008 and 2012
0
20
40
60
80
100
Percent
2008 2012
24
36
12
3
15
9
22
35
12
17
10
Inpatient hospital
Physician/outpatient hospital
Home health care
Nursing home/long-term institution
Prescription drugs
Other (short-term institution/
hospice/dental)
3
NOTE: Data include both out-of-pocket costs and costs covered by insurance. Dollars are not ination adjusted. Estimates may not sum to the
totals because of rounding.
Reference population: These data refer to Medicare beneciaries.
SOURCE: Centers for Medicare & Medicaid Services, Medicare Current Beneciary Survey, Cost and Use.
• e percentage distribution of health care services
remained relatively constant between 2008 and 2012.
• Outpatient hospital and physician services were the
largest components of health care costs, accounting
for 35percent of total health care costs in 2012. In
the same year, long-term care facilities accounted
for 12percent of total costs, and prescription drugs
accounted for 17percent of health care costs.
• Inpatient hospital care accounted for 22 percent
of total costs in 2012. “Other” costs (short-term
institutions, hospice, and dental care) constituted
10percent of total costs.
• e mix of services varied with age. In 2012, the
biggest dierence occurred for long-term care facility
services: average costs were $7,175 among Medicare
beneciaries age 85 and over, compared with just
$718among Medicare beneciaries ages 65–74. Costs
of home health care and “other” services were also
higher at older ages.
Data for this indicator’s charts and bullets can be found in
Tables 30a through 30e on pages 133–135.
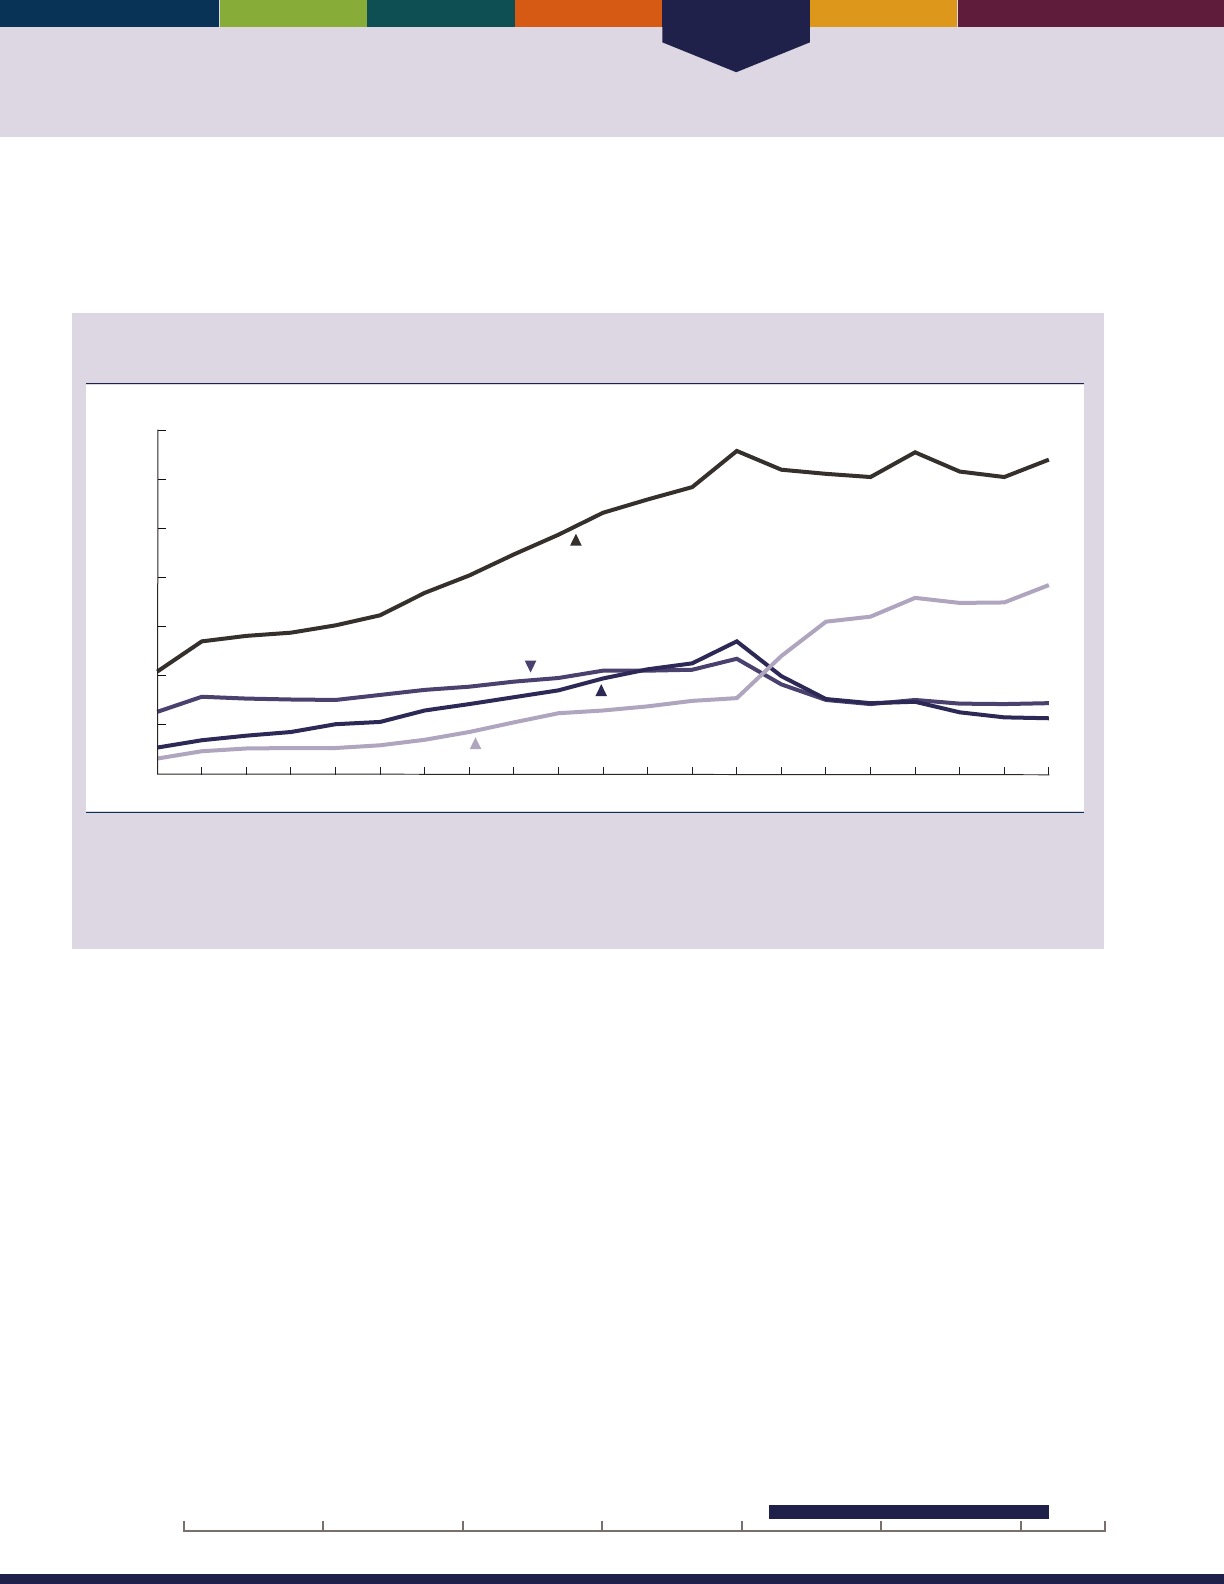
Health Care
50
INDICATOR 31: Prescription Drugs
Prescription drug costs have increased rapidly in recent years as more new drugs become available. Lack of prescription
drug coverage has created a nancial hardship for many older Americans. Medicare coverage of prescription drugs began
in January 2006—including a low-income subsidy for beneciaries with low incomes and assets.
Average prescription drug costs, in 2012 dollars, among noninstitutionalized Medicare
beneciaries age 65 and over, by sources of payment, 1992–2012
Dollars
0
500
1,000
1,500
2,000
2,500
3,000
$3,500
1992 1994 1996 1998 2000 2002 2004 2010 2012
Total
Out-of-pocket
Public
Private
2006 2008
NOTE: Dollars have been ination adjusted to 2012 using the Consumer Price Index (Series CPI-U-RS). Some data have been revised from
previously published gures as a result of a CPI adjustment. Reported costs have been adjusted to account for underreporting of prescription
drug use. The adjustment factor changed in 2006 with the initiation of the Medicare Part D prescription drug program. Public programs
include Medicare, Medicaid, Department of Veterans Affairs, and other State and Federal programs.
Reference population: These data refer to noninstitutionalized Medicare beneciaries.
SOURCE: Centers for Medicare & Medicaid Services, Medicare Current Beneciary Survey, Cost and Use.
• Average prescription drug costs for noninstitutionalized
Americans age 65 and over increased rapidly for many
years but were relatively stable from 2005 to 2012. e
average costs per person were $3,201 in 2012.
• Average out-of-pocket spending and costs covered
by private insurance decreased after the introduction
of the Medicare Part D prescription drug program
in 2006. ere was a corresponding increase in drug
costs covered by public insurance. Older Americans
paid about 60 percent of prescription drug costs out
of pocket in 1992, compared with about 22percent
in 2012. Private insurance covered 18 percent of
prescription drug costs for noninstitutionalized older
Americans in 2012 and public programs covered about
60 percent.
• Prescription drug costs varied signicantly among
individuals. In 2012, approximately 5 percent of
noninstitutionalized older Americans incurred
no prescription drug costs compared with about
18percent who incurred costs of $5,000 or more.
• Chronic conditions are associated with higher
prescription drug costs. In 2012, older Americans with
no chronic conditions incurred average prescription
drug costs of $1,389. ose with ve or more chronic
conditions incurred $8,263 in prescription drug costs,
on average.
20162000 201019901980197019601950
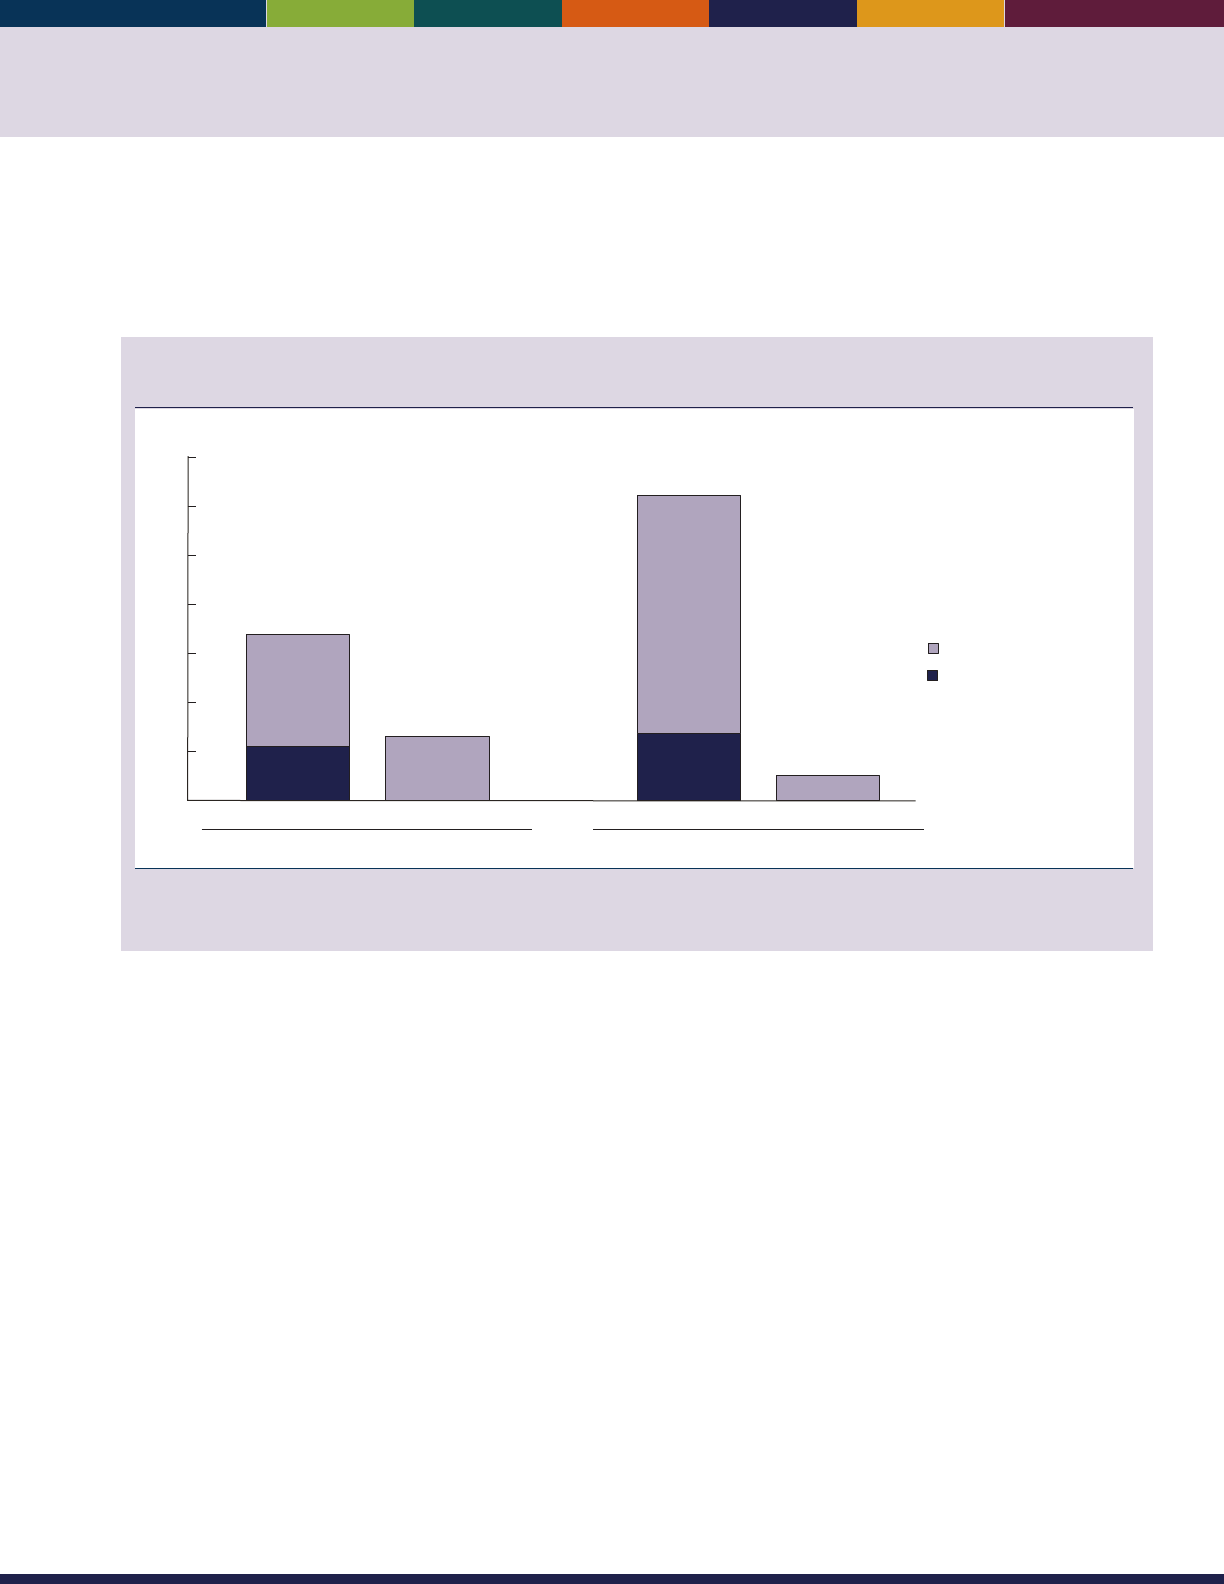
51
Under Medicare Part D, beneciaries may join a stand-alone prescription drug plan or a Medicare Advantage plan that
provides prescription drug coverage in addition to other Medicare-covered services. In situations where beneciaries
receive drug coverage from a former employer, the former employer may be eligible to receive a retiree drug subsidy from
Medicare to help cover the cost of the drug benet.
Number of Medicare beneciaries age 65 and over who enrolled in Part D prescription drug plans
or who were covered by retiree drug subsidy payments, 2006 and 2014
2006 2014
5.6
11.4
6.5
6.9
24.2
2.6
Part D plan Retiree drug subsidy
Part D plan Retiree drug subsidy
Enrollment (in millions)
0
5
10
15
20
25
30
35
Low-income subsidy
No low-income subsidy
NOTE: Some data for 2006 have been revised and differ from previous editions of
Older Americans.
Reference population: These data refer to Medicare beneciaries.
SOURCE: Centers for Medicare & Medicaid Services, Medicare claims and enrollment data.
• e number of Medicare beneciaries age 65 and over
enrolled in Part D prescription drug plans increased
from 16.9 million (46 percent of beneciaries) in
2006 to 31.1 million (69 percent of beneciaries) in
2014. In 2014, 61 percent of Part D beneciaries were
enrolled in stand-alone plans and 39 percent were in
Medicare Advantage plans. Approximately 2.6million
beneciaries age 65 and over were covered by the
retiree drug subsidy in 2014. About 11.7million
beneciaries who were not in Part D plans and were
not covered by the retiree drug subsidy in 2014
either had drug coverage through another source (e.g.,
TRICARE, Federal Employees Health Benets plan,
Department of Veterans’ Aairs, current employer) or
did not have drug coverage.
• In 2014, 6.9 million Part D beneciaries were receiving
low-income subsidies. Many of these beneciaries had
drug coverage through the Medicaid program prior to
enrollment in Part D.
Data for this indicator’s charts and bullets can be found in
Tables 31a through 31d on pages 136–137.
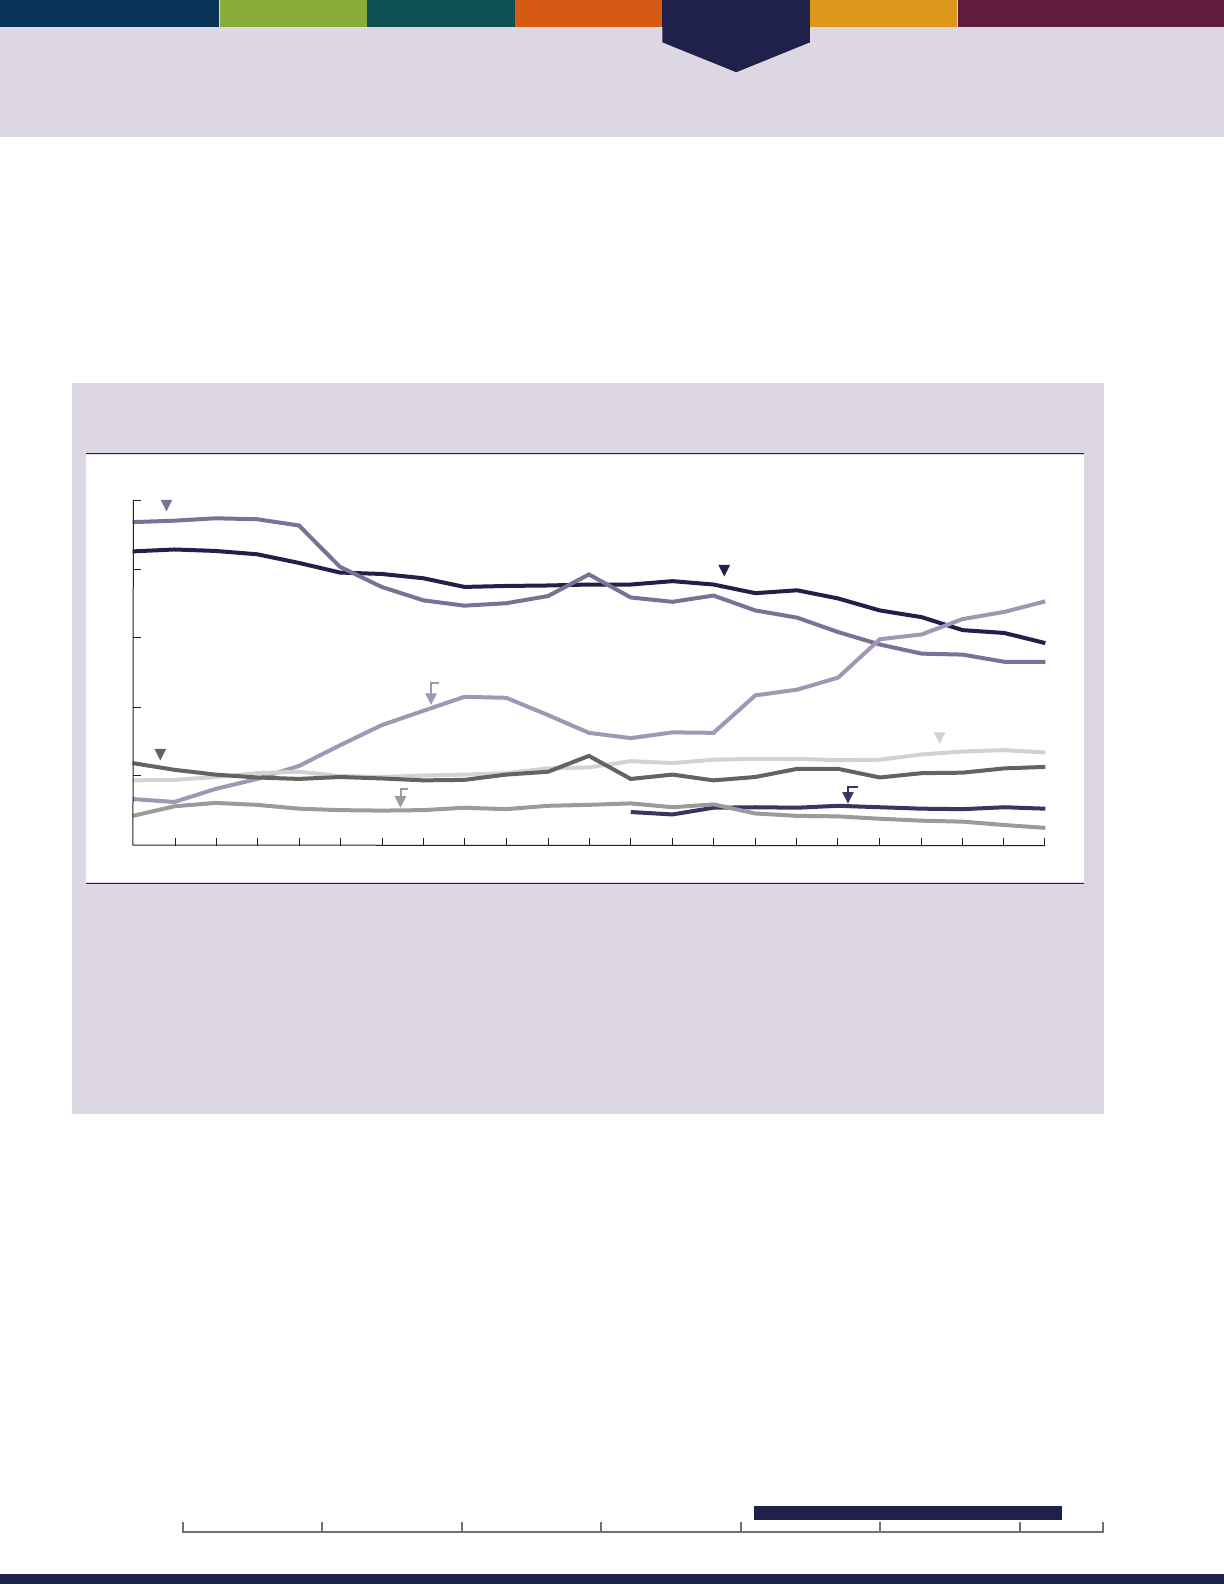
Health Care
52
INDICATOR 32: Sources of Health Insurance
Medicare is the primary insurance provider for all eligible beneciaries over age 65. Medicare covers mostly acute
care services and requires beneciaries to pay part of the cost, leaving about half of health spending to be covered by
other sources. Many beneciaries have supplemental insurance to ll these gaps and to pay for services not covered by
Medicare. Prior to 2006, many beneciaries received prescription drug coverage through supplemental insurance. Since
January 2006, beneciaries have had the option of receiving prescription drug coverage under Medicare through stand-
alone prescription drug plans or through some Medicare Advantage health plans.
Percentage of noninstitutionalized Medicare beneciaries age 65 and over with supplemental
health insurance, by type of insurance, 1991–2013
Percent
0
Private (employer- or union-sponsored)
Private (Medigap)
a
Medicare Advantage/Capitated Payment Plans
Medicaid
Other public
No supplement
1991 1995 2000 2005 2013
TRICARE
2010
10
20
30
40
50
a
Includes people with private supplement of unknown sponsorship.
NOTE: Medicare Advantage/Capitated Payment Plans include Health Maintenance Organizations (HMOs), Preferred Provider Organizations
(PPOs), and private fee-for-service (PFFS) plans. Not all types of plans were available in all years. Since 2003, these types of plans have been
known collectively as Medicare Advantage and/or Medicare Part C. Estimates are based on beneciaries’ insurance status in the fall of each year.
Categories are not mutually exclusive (i.e., individuals may have more than one supplemental policy). Chart excludes beneciaries whose primary
insurance is not Medicare (approximately 1 to 3 percent of beneciaries). Medicaid coverage was determined from both survey responses
and Medicare administrative records. TRICARE coverage was added to Medicare Current Beneciary Survey Access to Care les beginning in
2003. Previous versions of
Older Americans
did not include data on TRICARE coverage. Adding TRICARE coverage changes the percentage of
beneciaries in the “No supplement” group. Some data for 2009 have been revised and differ from previous editions of
Older Americans.
Reference population: These data refer to noninstitutionalized Medicare beneciaries.
SOURCE: Centers for Medicare & Medicaid Services, Medicare Current Beneciary Survey, Access to Care.
• Most Medicare beneciaries have a private insurance
supplement, either provided by a former employer or
purchased as a Medigap policy.
• e percentage of Medicare beneciaries with
Medicaid coverage has increased from 10 percent in
2000 to 13 percent in 2013.
• Between 1991 and 2013, enrollment in Medicare
Advantage/Capitated Payment Plans and other public
health plans, which are usually equivalent to Medicare
supplements because they oer extra benets, varied
between 6 percent and 34 percent.
• About 11percent of Medicare beneciaries reported
having no health insurance supplement in 2013.
• While almost all older Americans have health insurance
via Medicare, many people younger than age 65 have
no health insurance. In 2014, about 10 percent of
people ages 55–64 were uninsured. e percentage
of people not covered by health insurance varied by
poverty status. In 2014, 25 percent of people ages
55–64 who lived below the poverty line had no health
insurance, compared with 5 percent for people who
had incomes greater than or equal to 200 percent
of the poverty threshold. e percent of people ages
55–64 without health insurance declined signicantly
from 14percent in 2013 to 10 percent in 2014.
Data for this indicator’s charts and bullets can be found in
Tables 32a through 32c on pages 138–139.
20162000 201019901980197019601950
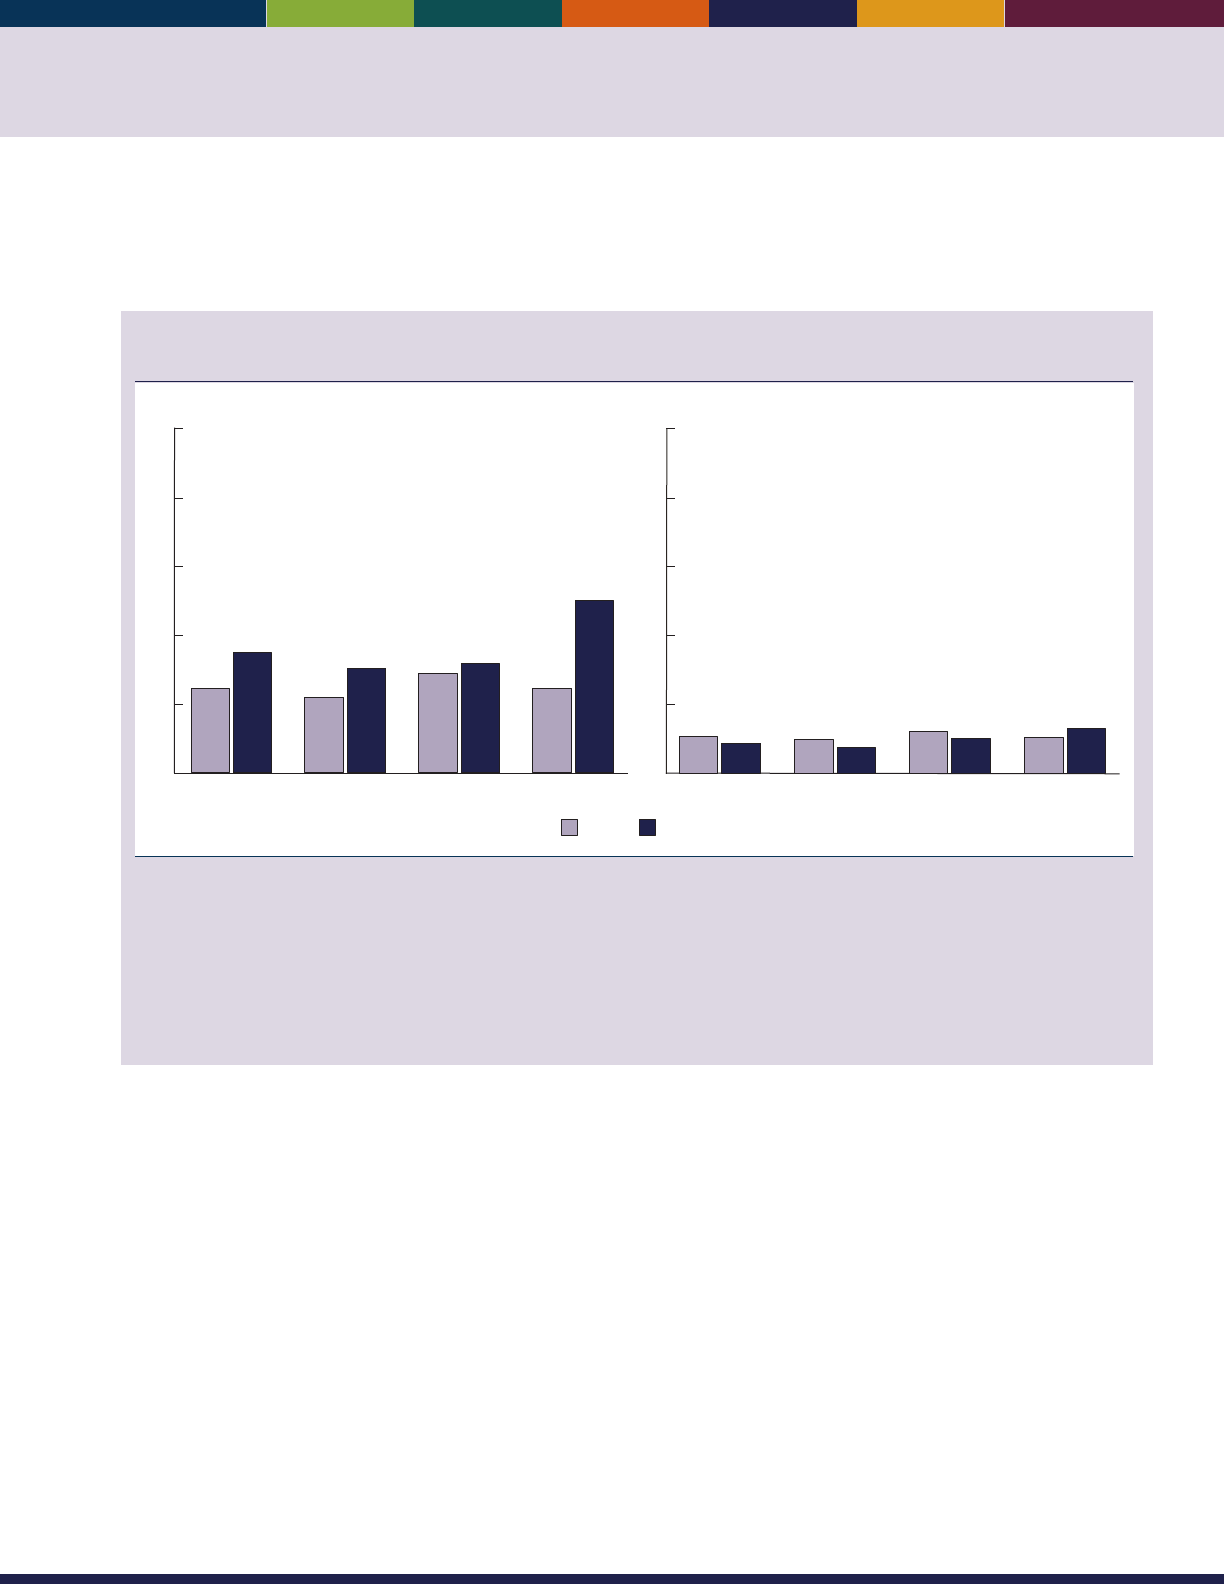
53
INDICATOR 33: Out-of-Pocket Health Care Expenditures
Large out-of-pocket expenditures for use of health care services have been shown to encumber access to care, aect health
status and quality of life, and leave insucient resources for other necessities.
41,42
e percentage of household income that
is allocated to health care expenditures is a measure of health care expense burden placed on older people.
Ratio of out-of-pocket expenditures to household income per person among people age 65 and
over, by income category and age group, 1977 and 2013
20131977
Percent
0
10
20
30
40
50
Poor/near poor income category
65 and over 65–74 75–84 85 and over
12
17
11
15
14
16
12
25
Percent
0
10
20
30
40
50
Low/middle/high income category
5
4
5
4
6
5
5
7
65 and over 65–74 75–84 85 and over
NOTE: Out-of-pocket health care expenditures exclude personal spending for health insurance premiums. Including expenditures for
out-of-pocket premiums in the estimates of out-of-pocket spending would increase the percentage of household income spent on health
care. People are classied into the “poor/near poor” income category if their household income is below 125 percent of the poverty level;
otherwise, people are classied into the “low/middle/high” income category. The poverty level is calculated according to the U.S. Census
Bureau guidelines for the corresponding year. The ratio of a person’s out-of-pocket expenditures to their household income was calculated
based on the person’s per capita household income. For people whose ratio of out-of-pocket expenditures to income exceeded 100 percent,
the ratio was capped at 100 percent. For people with out-of-pocket expenditures and with zero income (or negative income), the ratio was set
at 100 percent. For people with no out-of-pocket expenditures the ratio was set to zero.
Reference population: These data refer to the civilian noninstitutionalized population.
SOURCE: Agency for Healthcare Research and Quality, Medical Expenditure Panel Survey (MEPS) and MEPS predecessor surveys.
• In 1977, the average per-person percentage of
household income attributable to out-of-pocket
spending for health care services for poor/near-
poor persons age 65 and over was 12 percent. is
average increased to 17 percent in 2013. e average
percentage for the low/middle/high income category
was lower, at 5 percent in 1977 and 4 percent in 2013.
• e percentage of people age 65 and over with
out-of-pocket spending for health care services
increased between 1977 and 2013, from 83 percent
to 93percent.
• From 2000 to 2006, more than half of out-of-pocket
health care spending by people age 65 and over was
for prescription drugs. By 2013, only about one-third
of out-of-pocket spending for this group was for
prescription drugs.
• In 2013, nearly half (47 percent) of out-of-pocket
expenses for people age 85 and over were for home
health care and other miscellaneous health expenses.
is proportion is substantially higher than for persons
ages 65–74 (12 percent) or ages 75–84 (14 percent).
Data for this indicator’s charts and bullets can be found in
Tables 33a through 33c on pages 140–143.
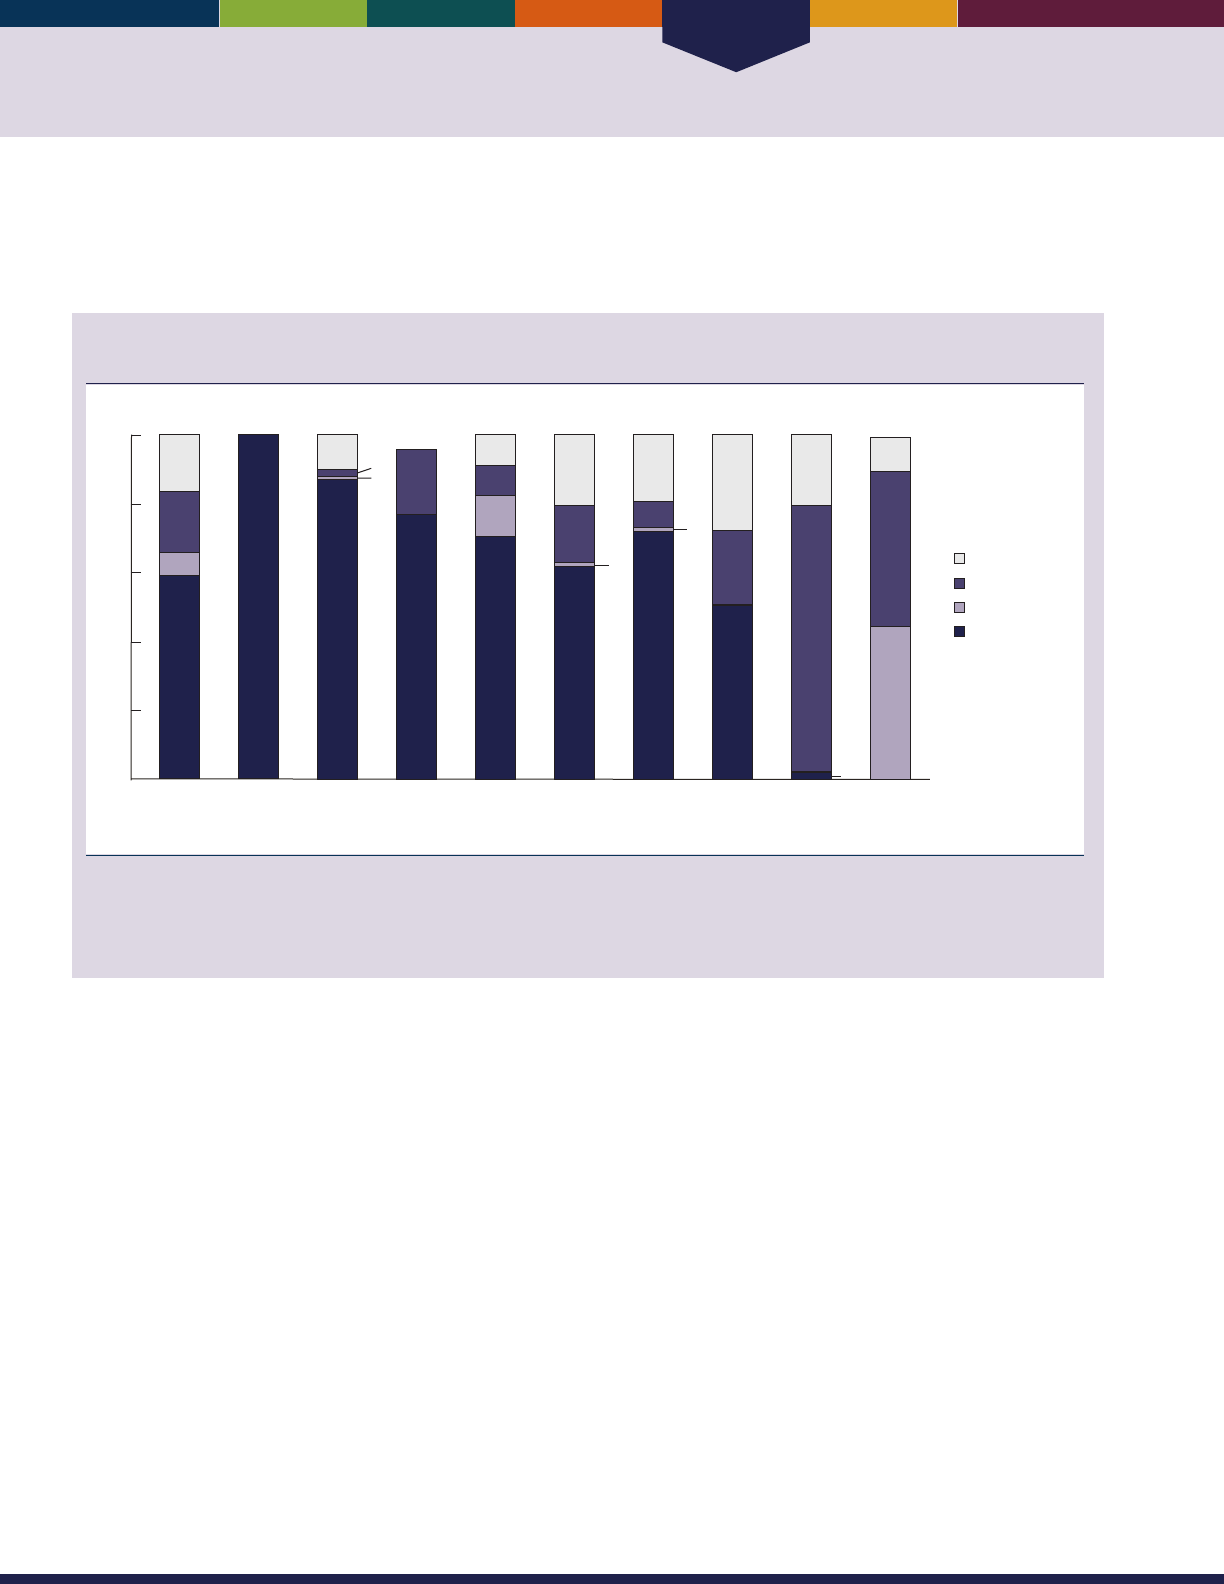
Health Care
54
INDICATOR 34: Sources of Payment for Health Care Services
Medicare’s payments are focused on acute care services such as hospitals and physicians. Historically, long-term care
facilities, prescription drugs, and dental care have been primarily nanced out of pocket or by other payers. Medicare
coverage of prescription drugs, including a low-income subsidy, began in January 2006.
Average cost per beneciary and percentage distribution of sources of payment for health care
services for Medicare beneciaries age 65 and over, by type of service, 2012
2
1
2*
1
1
All Hospice Inpatient
hospital
Home
health
care
Short-term
institution
Physician/
medical
Out-
patient
hospital
Prescription
drugs
Dental Long-term
care facility
Percent
0
20
40
60
80
100
59
18
16
7
$16,959
100
$343
87
10
$3,627
77
19
$550
70
9
9
12
$933
62
17
21
$4,050
72
7
20
$1,801
51
21
28
$2,793
77
21
$447
44
45
10
$2,032
Medicaid
Medicare
Out-of-pocket
Other
Average cost
per beneficiary
* Estimates are considered unreliable. Data with an asterisk have a relative standard error of 20 to 30 percent.
NOTE: “Other” refers to private insurance, Department of Veterans Affairs, uncollected liability, and other public programs. Estimates may not
sum to 100 percent because of rounding or suppression due to high relative standard errors.
Reference population: These data refer to Medicare beneciaries.
SOURCE: Centers for Medicare & Medicaid Services, Medicare Current Beneciary Survey, Cost and Use.
• Medicare paid for almost 60 percent of all health care
costs of Medicare beneciaries age 65 and over in
2012. Medicare nanced all hospice costs and most
hospital, physician, home health care, and short-term
institution costs.
• Medicaid covered 7 percent of all health care costs
of Medicare beneciaries age 65 and over, and other
payers (primarily private insurers) covered another
16percent. Medicare beneciaries age 65 and over paid
18 percent of their health care costs out of pocket (not
including insurance premiums).
• In 2012, about 44 percent of long-term care facility
costs for Medicare beneciaries age 65 and over were
covered by Medicaid; another 45 percent of these
costs were paid out of pocket. About 51 percent of
prescription drug costs for Medicare beneciaries age
65 and over were covered by Medicare, 28 percent were
covered by third-party payers other than Medicare and
Medicaid (consisting mostly of private insurers), and
21 percent were paid out of pocket. About 77 percent
of dental care received by older Americans was paid out
of pocket.
• Sources of payment for health care other than Medicare
varied by income. In general, individuals with lower
incomes relied heavily on Medicaid, while those with
higher incomes relied more on private insurance. As
shown in Indicator 33 (Out-of-Pocket Health Care
Expenditures), people in the poor/near poor income
category spent a higher percentage of their household
income on health care services than did people in the
low/middle/high income category.
Data for this indicator’s charts and bullets can be found in
Tables 34a and 34b on page 144.
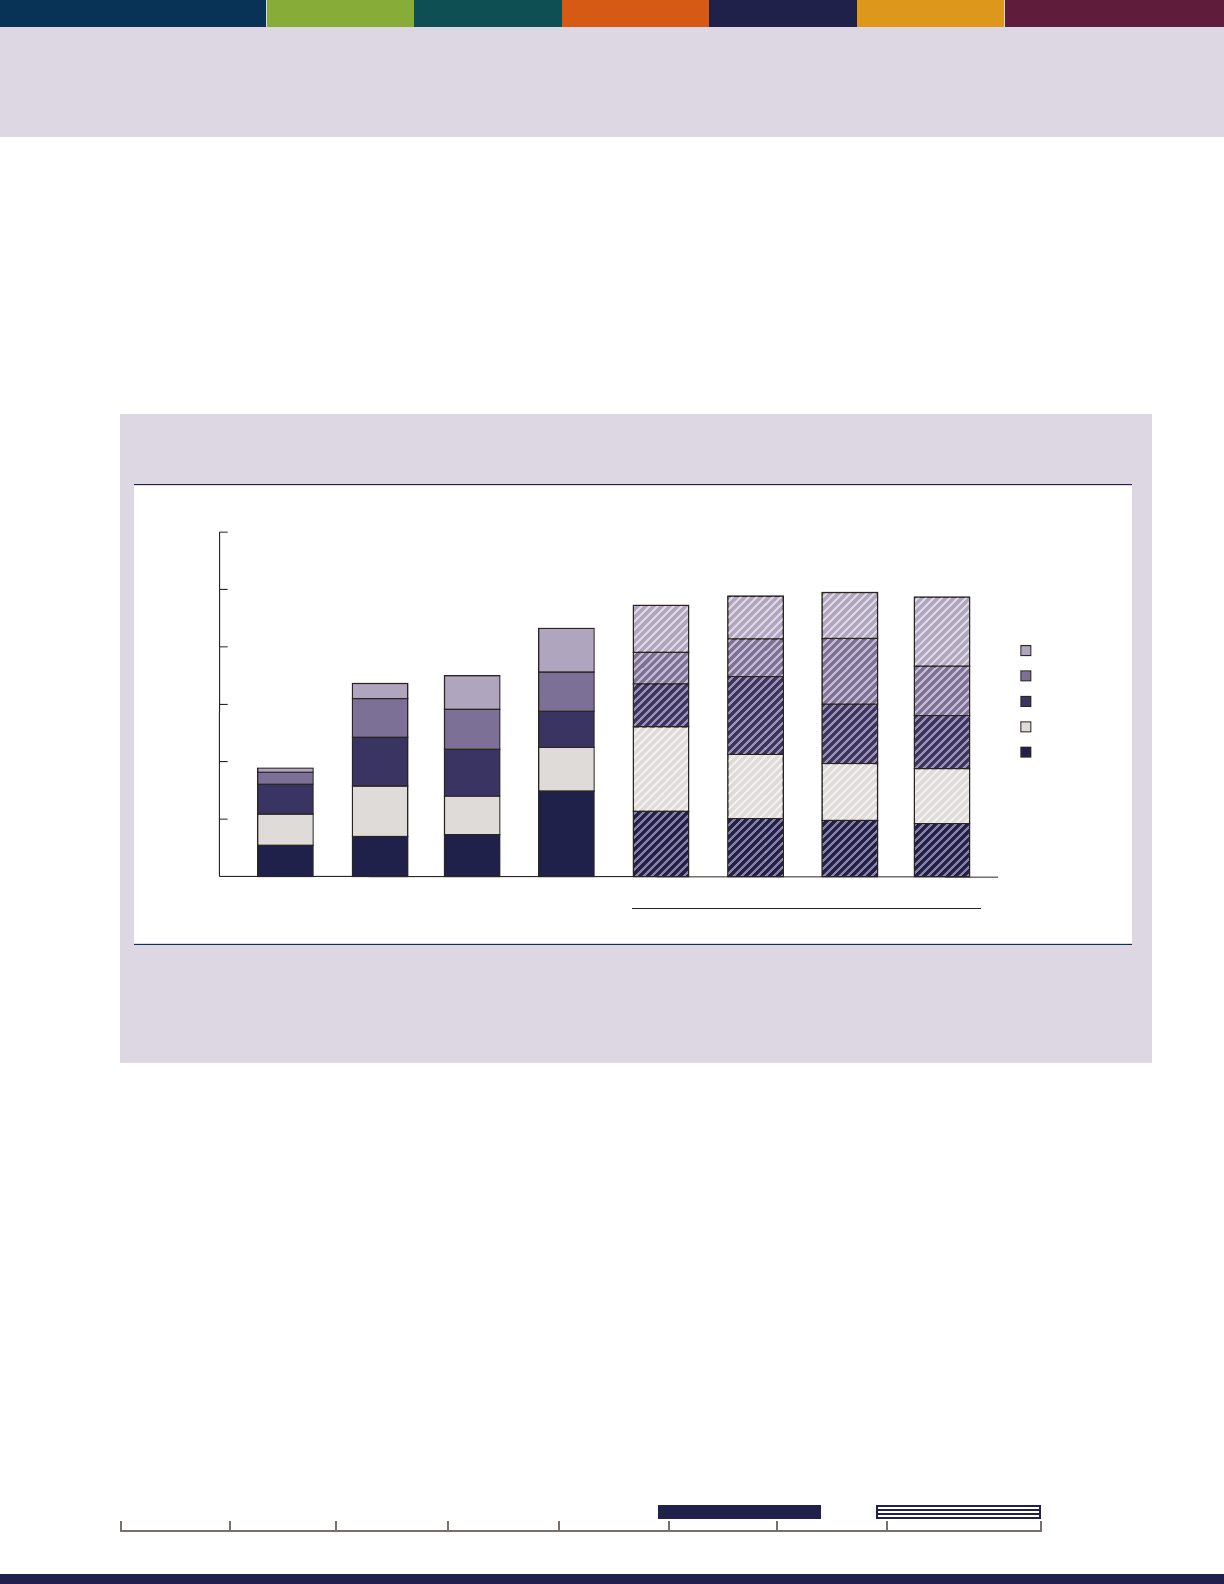
55
INDICATOR 35: Veterans’ Health Care
e number of veterans age 65 and over who are enrolled in and receive health care from the Veterans Health
Administration (VHA), within the Department of Veterans Aairs (VA), has been steadily increasing since eligibility
for this benet was reformed in 1999. Older veterans continue to turn to VHA for their health care needs, despite their
eligibility for other sources of health care. VHA lls important gaps in older veterans’ health care needs not currently
covered or fully covered by Medicare, such as long-term services and supports (nursing home care for eligible veterans
and community-based care for all enrolled veterans) and specialized services for the disabled, including acute mental
health services. In addition, VHA provides access to these important services in rural and highly rural communities.
Number of veterans age 65 and over who are enrolled in the Veterans Health Administration, by
age group, selected years 1999–2014 and projected 2019–2034
80–84
85 and over
75–79
70–74
65–69
0
2,000,000
3,000,000
4,000,000
5,000,000
6,000,000
Number
1999 2004 2009 2014 2019 2024 2029 2034
1,000,000
Projected
NOTE: Department of Veterans Affairs (VA) enrollees are veterans who have signed up to receive health care from the Veterans Health
Administration (VHA). Counts for 2019, 2024, 2029, and 2034 are projections from the 2015 VA Enrollee Health Care Projection Model.
Reference population: These data refer to the count of unique VHA enrollees per scal year.
SOURCE: Department of Veterans Affairs, Ofce of the Assistant Deputy Under Secretary for Health for Policy and Planning, 2015 VA Enrollee
Health Care Projection Model.
• In 2014, approximately 4.3 million veterans age 65
and over were enrolled with VHA, out of a total of
9.1million enrolled veterans (48 percent).
• e percentages of older veterans among the enrollee
population are expected to increase as the Vietnam-
era enrollee cohort gets older. In 2014, approximately
23percent of enrollees were age 75 and over; by 2034,
approximately 32 percent of enrollees are projected to
be age 75 and over.
• Among enrollees age 65 and over, 36 percent had
been disabled by an injury or illness that was incurred
or aggravated during active military service. In 2014,
about 13 percent of enrollees with service-connected
disabilities had a disability rating of 70 percent or
more. Among enrollees of all ages, approximately
42percent had been adjudicated for service-connected
conditions in 2014, since service-connected disability
ratings are more prevalent among younger enrollees.
As a result, service-connected disability ratings are
projected to increase as younger enrollees age into the
65 and over age groups.
Data for this indicator’s charts and bullets can be found in
Tables 35a and 35b on page 145.
203420202000 201019901980197019601950
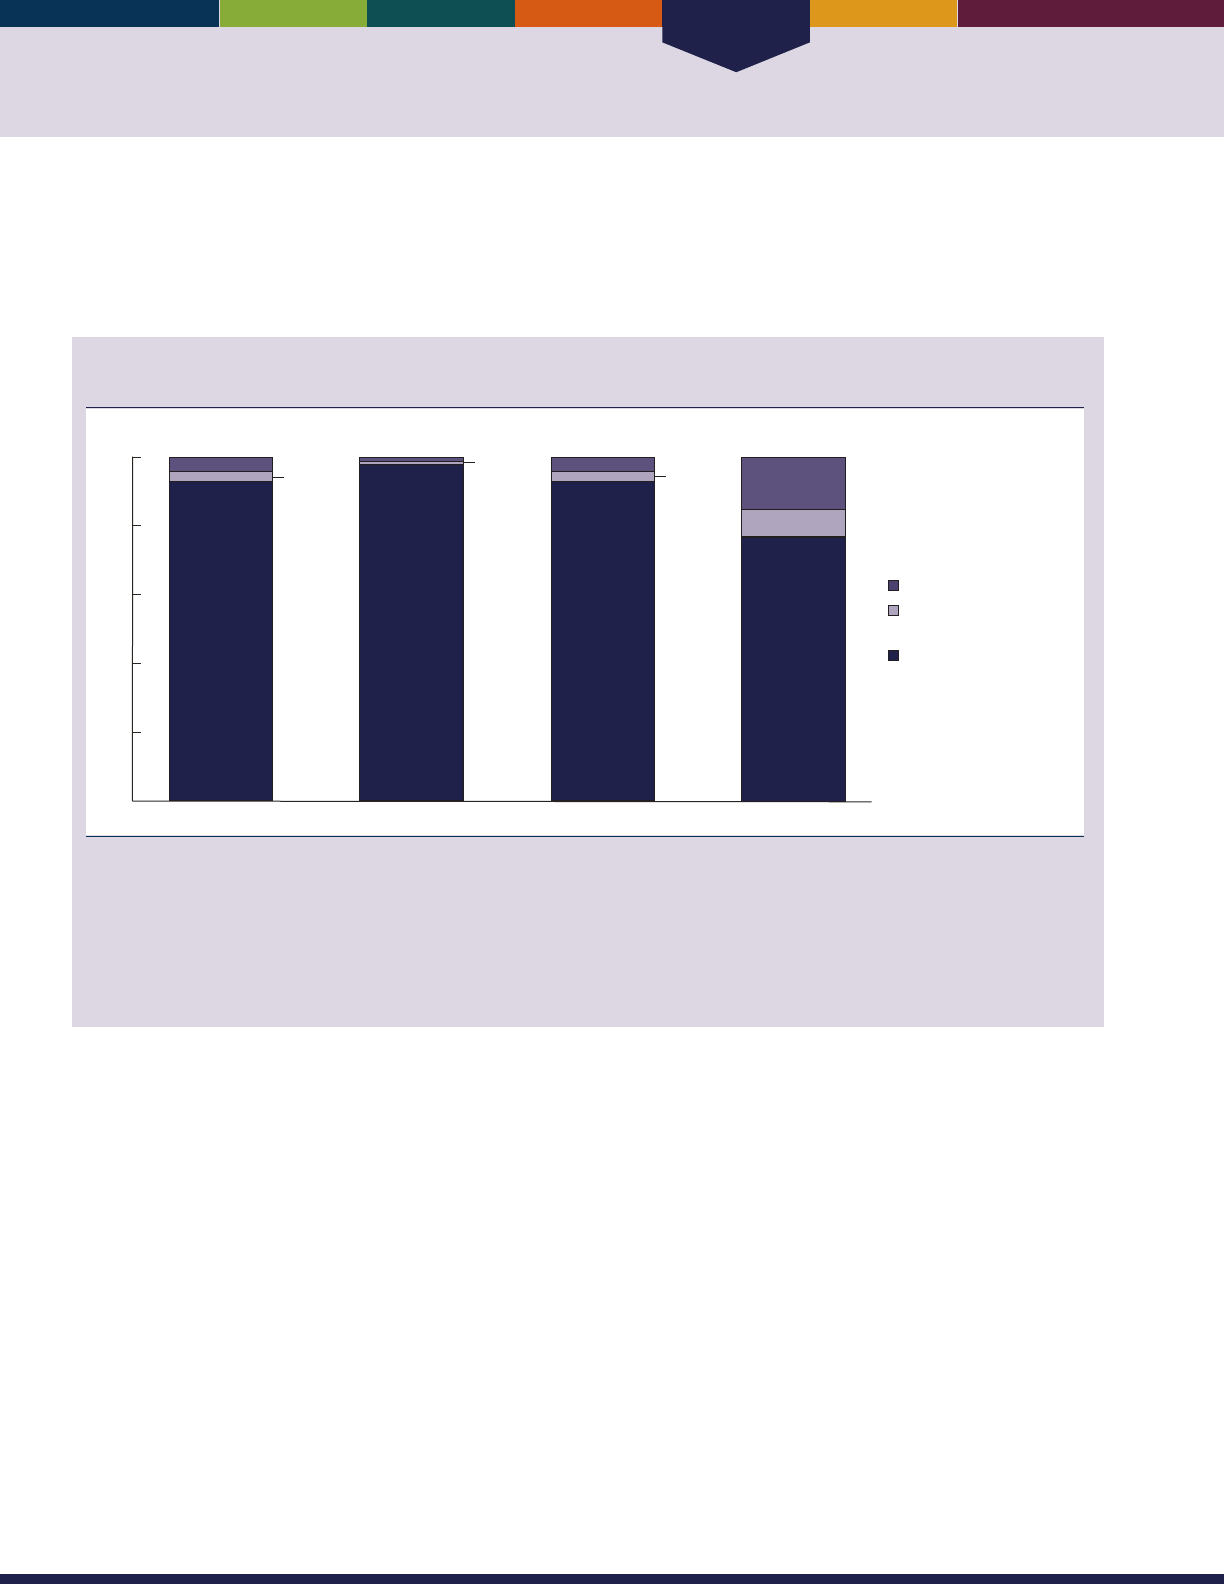
Health Care
56
INDICATOR 36: Residential Services
Most older Americans live independently in traditional communities. Others live in licensed long-term care facilities, and
still others live in communities with access to various services through their place of residence. Such services may include
meal preparation, laundry and cleaning services, and help with medications. Availability of such services through the
place of residence may help older Americans maintain their independence and avoid institutionalization.
Percentage distribution of Medicare beneciaries age 65 and over residing in selected residential
settings, by age group, 2013
0
20
40
60
80
100
Percent
65 and over 75–8465–74 85 and over
93
4 1
3
3
98
1
93
4
77
8
15
Community housing
with services
Traditional community
Long-term care facilities
NOTE: Community housing with services applies to respondents who reported they lived in retirement communities or apartments, senior
citizen housing, continuing care retirement facilities, assisted living facilities, staged living communities, board and care facilities/homes,
and similar situations AND who reported they had access to one or more of the following services through their place of residence: meal
preparation, cleaning or housekeeping services, laundry services, or help with medications. Respondents were asked about access to these
services, but not whether they actually used the services. A residence (or unit) is considered a long-term care facility if it is certied by
Medicare or Medicaid; or has 3 or more beds, is licensed as a nursing home or other long-term care facility, and provides at least one personal
care service; or provides 24-hour, 7-day-a-week supervision by a non-family, paid caregiver.
Reference population: These data refer to Medicare beneciaries.
SOURCE: Centers for Medicare & Medicaid Services, Medicare Current Beneciary Survey, Access to Care.
• In 2013, about 3 percent of the Medicare population
age 65 and over resided in community housing with
at least one service available. About 4 percent resided
in long-term care facilities, and 93 percent resided in
traditional community.
• e percentage of people residing in community
housing with services and in long-term care facilities
was higher for the older age groups than for the
65–74 age group. Among individuals age 85 and over,
8percent resided in community housing with services,
15 percent resided in long-term care facilities. Among
individuals ages 65–74, about 98 percent resided in
traditional community settings.
• Among residents of community housing with services,
86 percent reported access to meal preparation
services; 79 percent reported access to cleaning or
housekeeping services; 69 percent reported access to
laundry services; and 49 percent reported access to help
with medications. ese numbers reect percentages
reporting availability of specic services, not necessarily
the number that actually used these services.
• About 53 percent of residents in community housing
with services reported that there were separate charges
for at least some services.
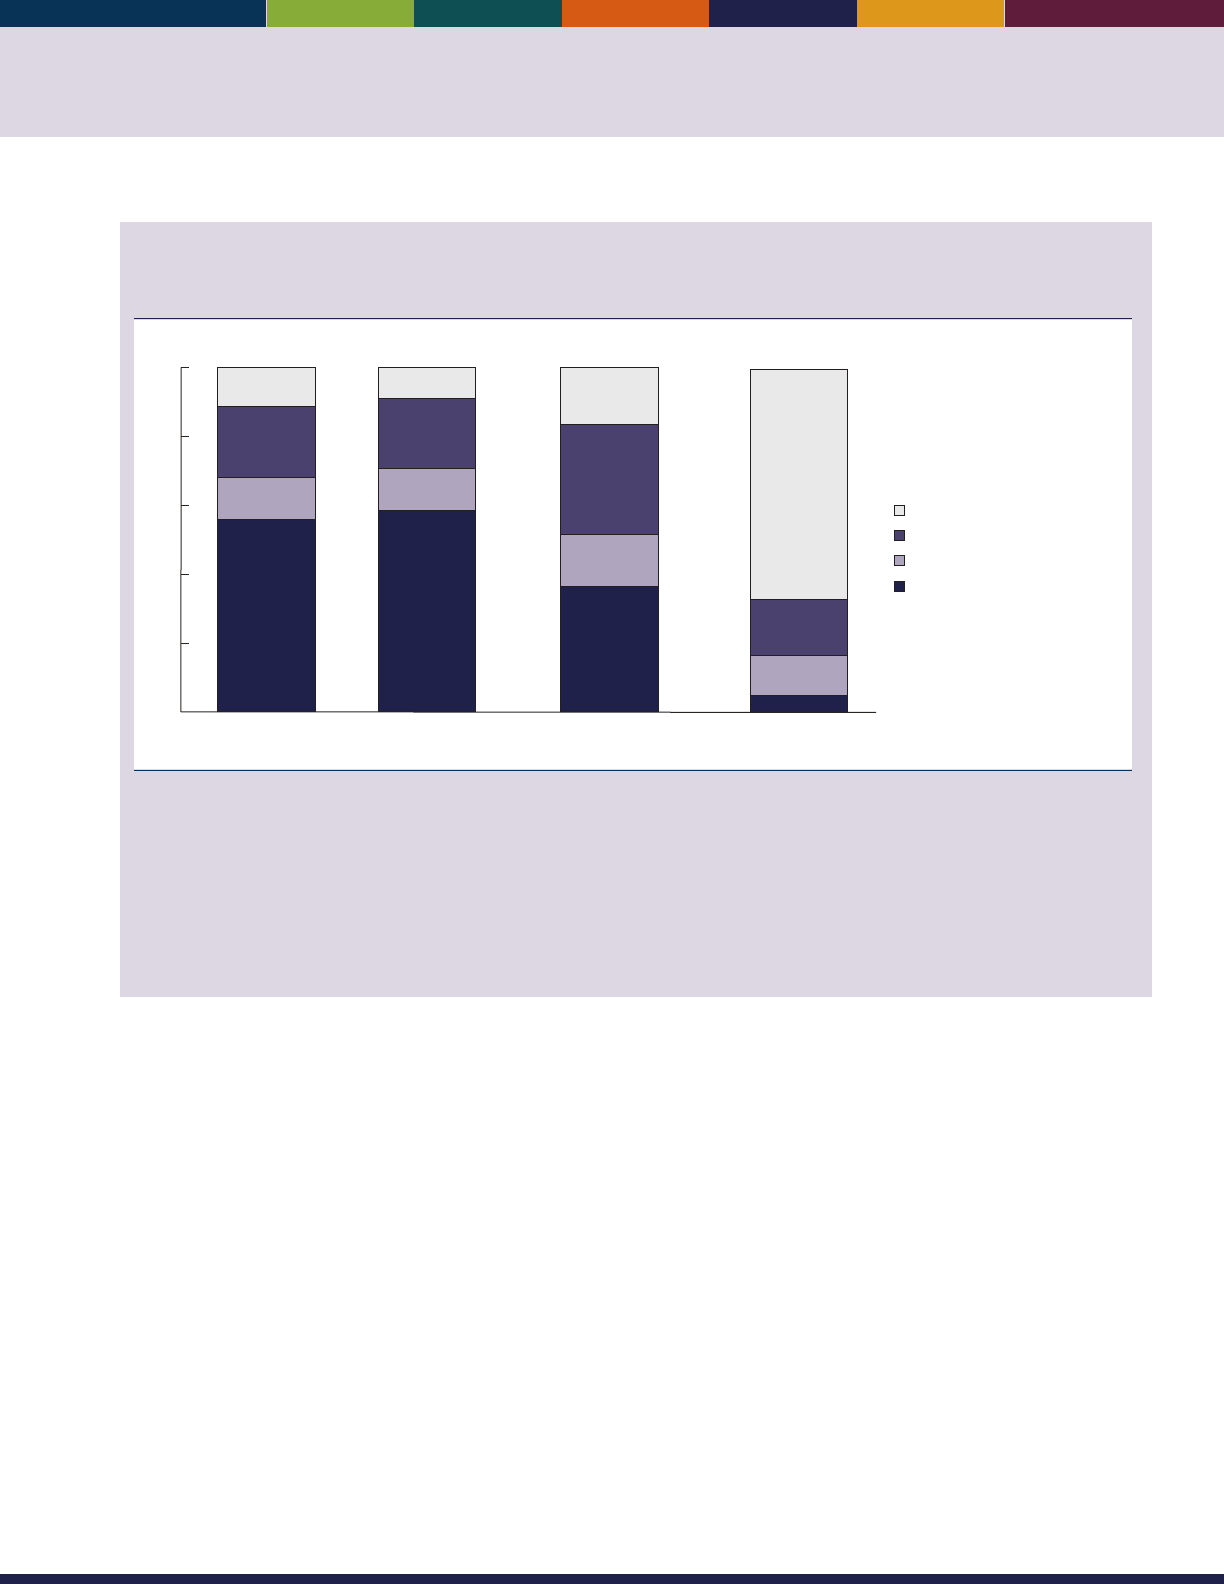
57
Percentage distribution of Medicare beneciaries age 65 and over with limitations performing
activities of daily living (ADLs) and instrumental activities of daily living (IADLs), by residential
setting, 2013
Overall
56
12
21
11
59
12
21
9
Traditional
community
36
15
32
17
Community housing
with services
5
12
16
67
Long-term care
facilities
0
20
40
60
80
100
Percent
Limitations in 1–2 ADLs
Limitations only in IADLs
No functional limitations
Limitations in 3 or more ADLs
NOTE: Community housing with services applies to respondents who reported they lived in retirement communities or apartments, senior
citizen housing, continuing care retirement facilities, assisted living facilities, staged living communities, board and care facilities/homes,
and similar situations, AND who reported they had access to one or more of the following services through their place of residence: meal
preparation, cleaning or housekeeping services, laundry services, or help with medications. Respondents were asked about access to
these services, but not whether they actually used the services. A residence (or unit) is considered a long-term care facility if it is certied
by Medicare or Medicaid; or has 3 or more beds, is licensed as a nursing home or other long-term care facility, and provides at least one
personal care service; or provides 24-hour, 7-day-a-week supervision by a non-family, paid caregiver. Long-term care facility residents with no
limitations may include individuals with limitations in performing certain IADLs, such as doing light or heavy housework or meal preparation.
These questions were not asked of facility residents.
Reference population: These data refer to Medicare beneciaries.
SOURCE: Centers for Medicare & Medicaid Services, Medicare Current Beneciary Survey, Access to Care.
• People living in community housing with services
had more limitations in performing activities of daily
living (ADLs) and instrumental activities of daily
living (IADLs) than traditional community residents,
but not as many as those living in long-term care
facilities. About 49 percent of individuals living in
community housing with services had at least one ADL
limitation, compared with 29 percent of traditional
community residents and 83 percent of long-term care
facility residents in 2013. Approximately 36 percent of
individuals living in community housing with services
had no ADL or IADL limitations.
• Residents of community housing with services tended
to have somewhat lower incomes than traditional
community residents and higher incomes than long-
term care facility residents. About 70 percent of long-
term care facility residents had incomes of $20,000 or
less in 2013, compared with 28 percent of traditional
community residents and 41 percent of residents of
community housing with services.
• About 61 percent of people living in community
housing with services reported they could continue
living there if they needed substantial care.
Data for this indicator’s charts and bullets can be found in
Tables 36a through 36e on pages 146–147.
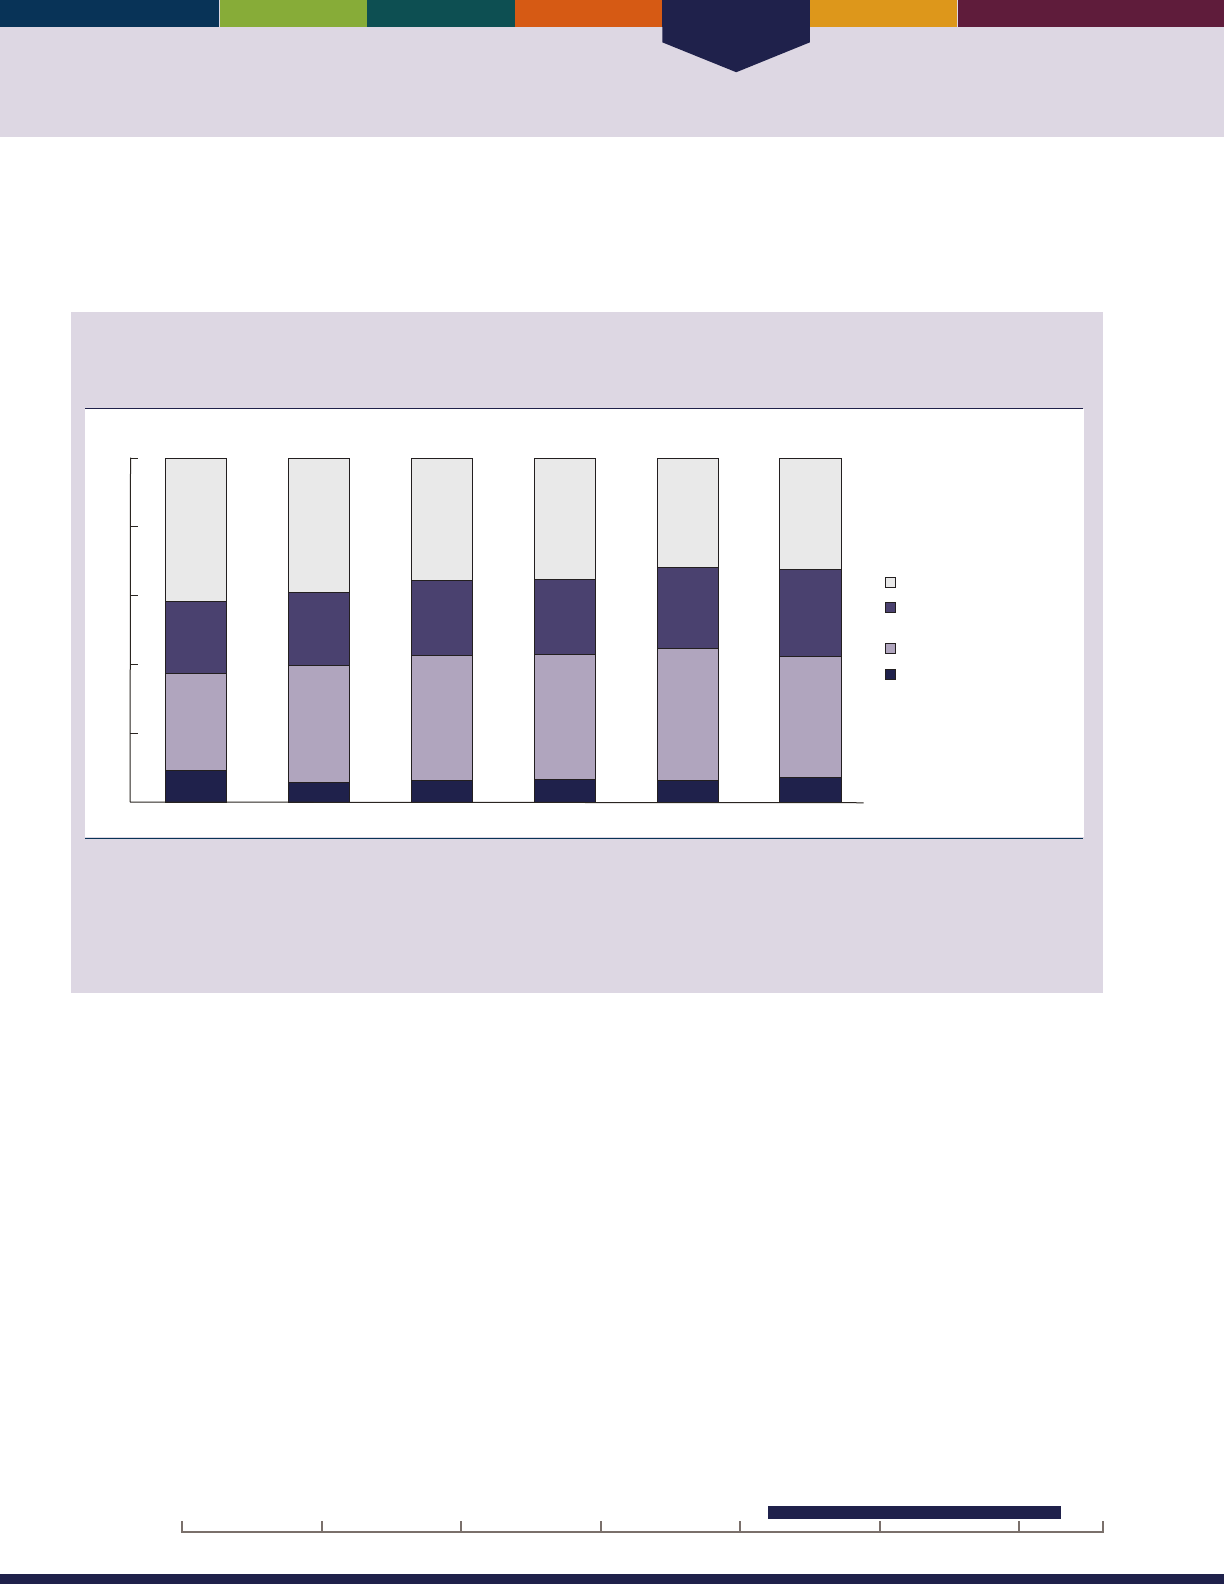
Health Care
58
INDICATOR 37: Personal Assistance and Equipment
As the proportion of the older population residing in long-term care facilities has declined, the use of personal assistance and/
or special equipment among those with limitations has increased. is assistance helps older people living in the community
maintain their independence.
Percentage distribution of noninstitutionalized Medicare beneciaries age 65 and over who have
limitations in performing activities of daily living (ADLs), by type of assistance, selected years
1992–2013
1992 1997 2001 2005 2009 2013
28
21
42
9
34
21
39
6
36
22
35
6
36
22
35
7
38
23
32
6
35
25
32
7
0
20
40
60
80
100
Percent
Personal assistance
and equipment
Equipment only
Personal assistance only
None
NOTE: Limitations in performing activities of daily living (ADLs) refer to difculty performing (or inability to perform for a health reason) one or
more of the following tasks: bathing, dressing, eating, getting in/out of chairs, walking, or using the toilet. Respondents who report difculty
with an activity are subsequently asked about receiving help or supervision from another person with the activity and about using special
equipment or aids. In this chart, personal assistance does not include supervision. Percentages are age adjusted using the 2000 standard
population. Estimates may not sum to the totals because of rounding.
Reference population: These data refer to noninstitutionalized Medicare beneciaries who have limitations in performing one or more ADLs.
SOURCE: Centers for Medicare & Medicaid Services, Medicare Current Beneciary Survey, Access to Care.
• Between 1992 and 2013, the age-adjusted proportion
of people age 65 and over who had diculty with one
or more activities of daily living (ADLs) and who did
not receive personal assistance or use special equipment
for these activities decreased from 42 percent to
32 percent. Over the same period, the percentage
of people using equipment only increased from 28
percent to 35 percent, while the percentage of people
who used personal assistance only decreased from
9percent to 7 percent.
• In 2013, about two-thirds of people who had diculty
with one or more ADLs received personal assistance
or used special equipment: 7 percent received personal
assistance only, 35 percent used equipment only,
and 25 percent used both personal assistance and
equipment.
• In 2013, men age 65 and over were more likely than
women to have received no assistance with their
limitations (36 percent compared with 30 percent),
but women were more likely than men to have received
personal assistance and used equipment (27 percent
compared with 23 percent). ere were no dierences
in the percentages of women and men with limitations
in performing ADLs who received personal assistance
only or used equipment only.
• In 2013, only 13 percent of people age 85 and over
with limitations in performing ADLs did not receive
assistance or use equipment compared with 41 percent
of people ages 65–74. In addition, people age 85 and
over were more likely to receive personal assistance
and use equipment compared with younger age
groups. ere were no dierences by age group in the
percentage of people with limitations in performing
ADLs who received personal assistance only.
20162000 201019901980197019601950
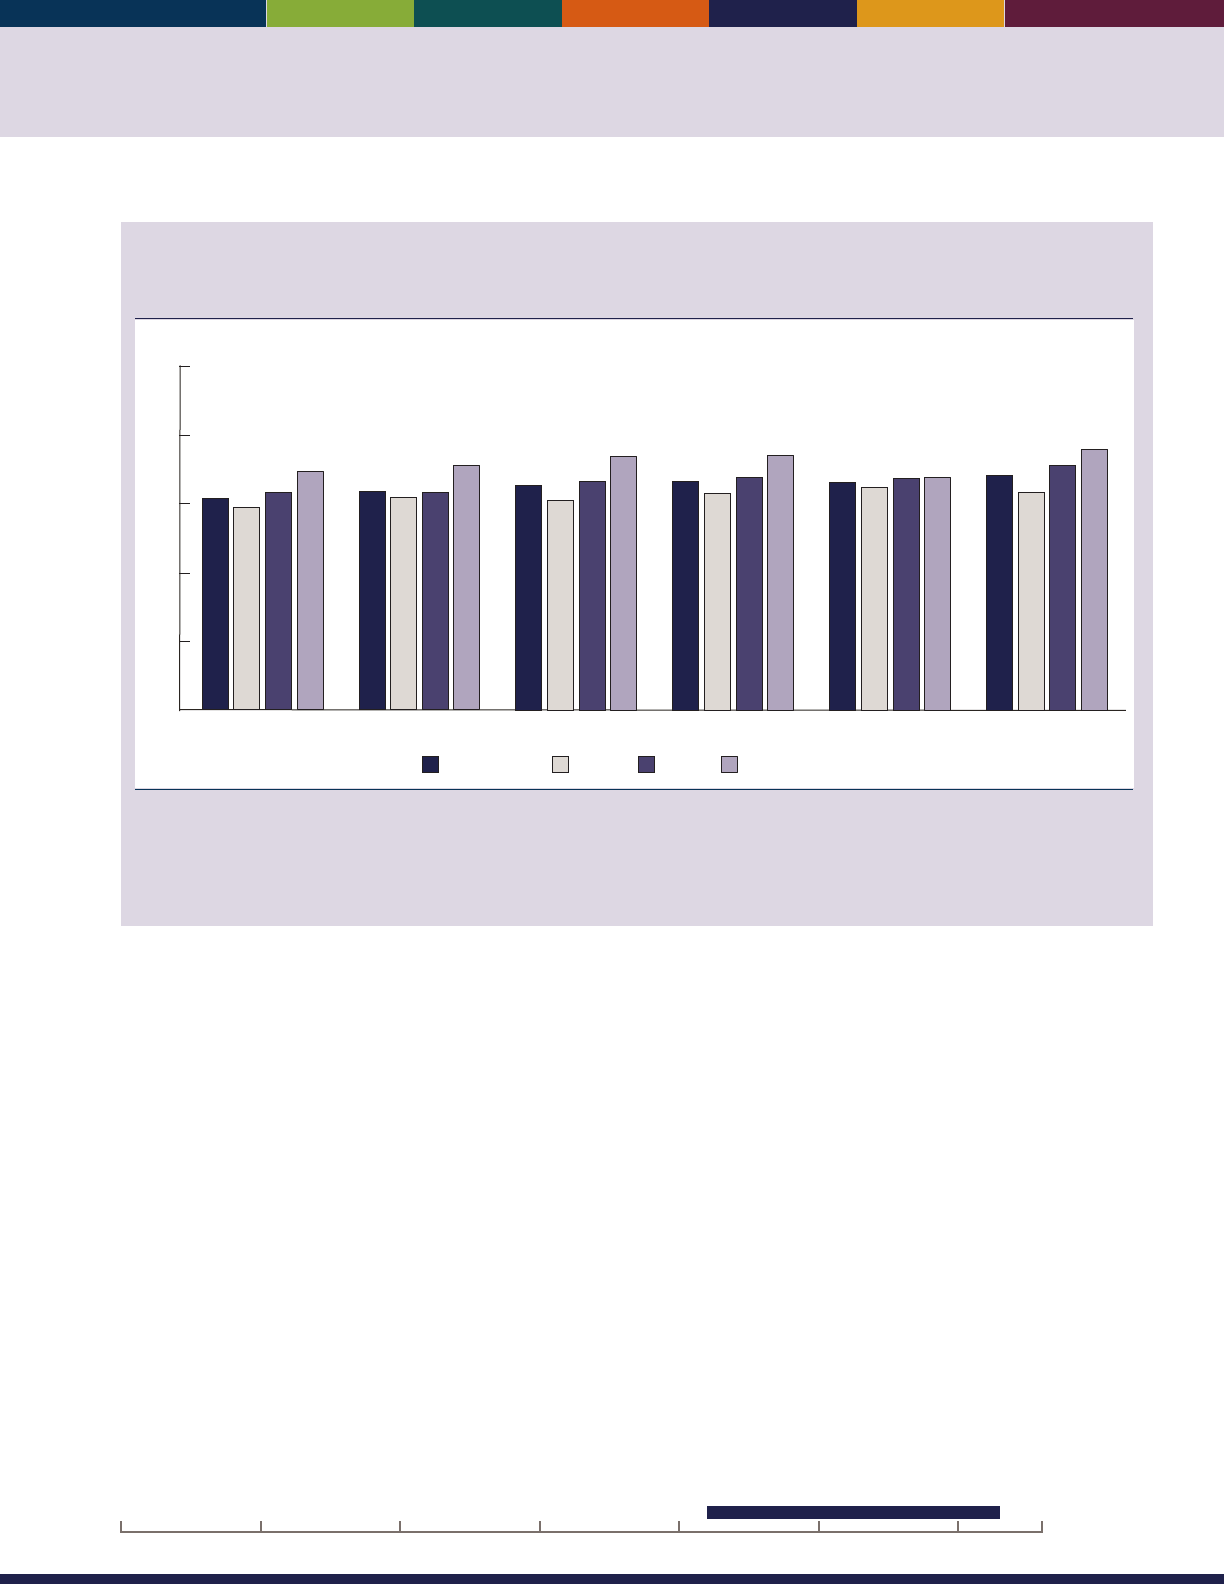
59
Percentage of noninstitutionalized Medicare beneciaries age 65 and over who have limitations
in performing instrumental activities of daily living (IADLs) and who receive personal assistance,
by age group, selected years 1992–2013
1992 1997 2001 2005 2009 2013
Percent
85 and over75–8465–7465 and over
59
63
69
62
63
71
61
67
74
63
67
74
65
67
68
63
71
76
60
64
65
66 66
68
0
20
40
60
80
100
NOTE: Limitations in performing instrumental activities of daily living (IADLs) refer to difculty performing (or inability to perform for a health
reason) one or more of the following tasks: using the telephone, light housework, heavy housework, meal preparation, shopping, or managing
money. Respondents who report difculty with an activity are subsequently asked about receiving help from another person with the activity.
In this chart, personal assistance does not include supervision or special equipment.
Reference population: These data refer to noninstitutionalized Medicare beneciaries who have limitations in performing one or more IADLs.
SOURCE: Centers for Medicare & Medicaid Services, Medicare Current Beneciary Survey, Access to Care.
• In 2013, slightly more than two-thirds of people age
65 and over who had diculty with one or more
instrumental activities of daily living (IADLs) received
personal assistance.
• In 2013, people ages 65–74 were less likely to receive
assistance with IADLs than people ages 75–84 and
85and over.
• Between 1992 and 2013, there were increases in the
percentages of people ages 65–74 and 75–84 who
received assistance with IADLs. Among people 85 and
over, there was no signicant increase.
• Men age 85 and over were more likely than women of
the same age group to receive personal assistance with
their IADLs in 2013.
Data for this indicator’s charts and bullets can be found in
Tables 37a through 37d on page 148–149.
20162000 201019901980197019601950
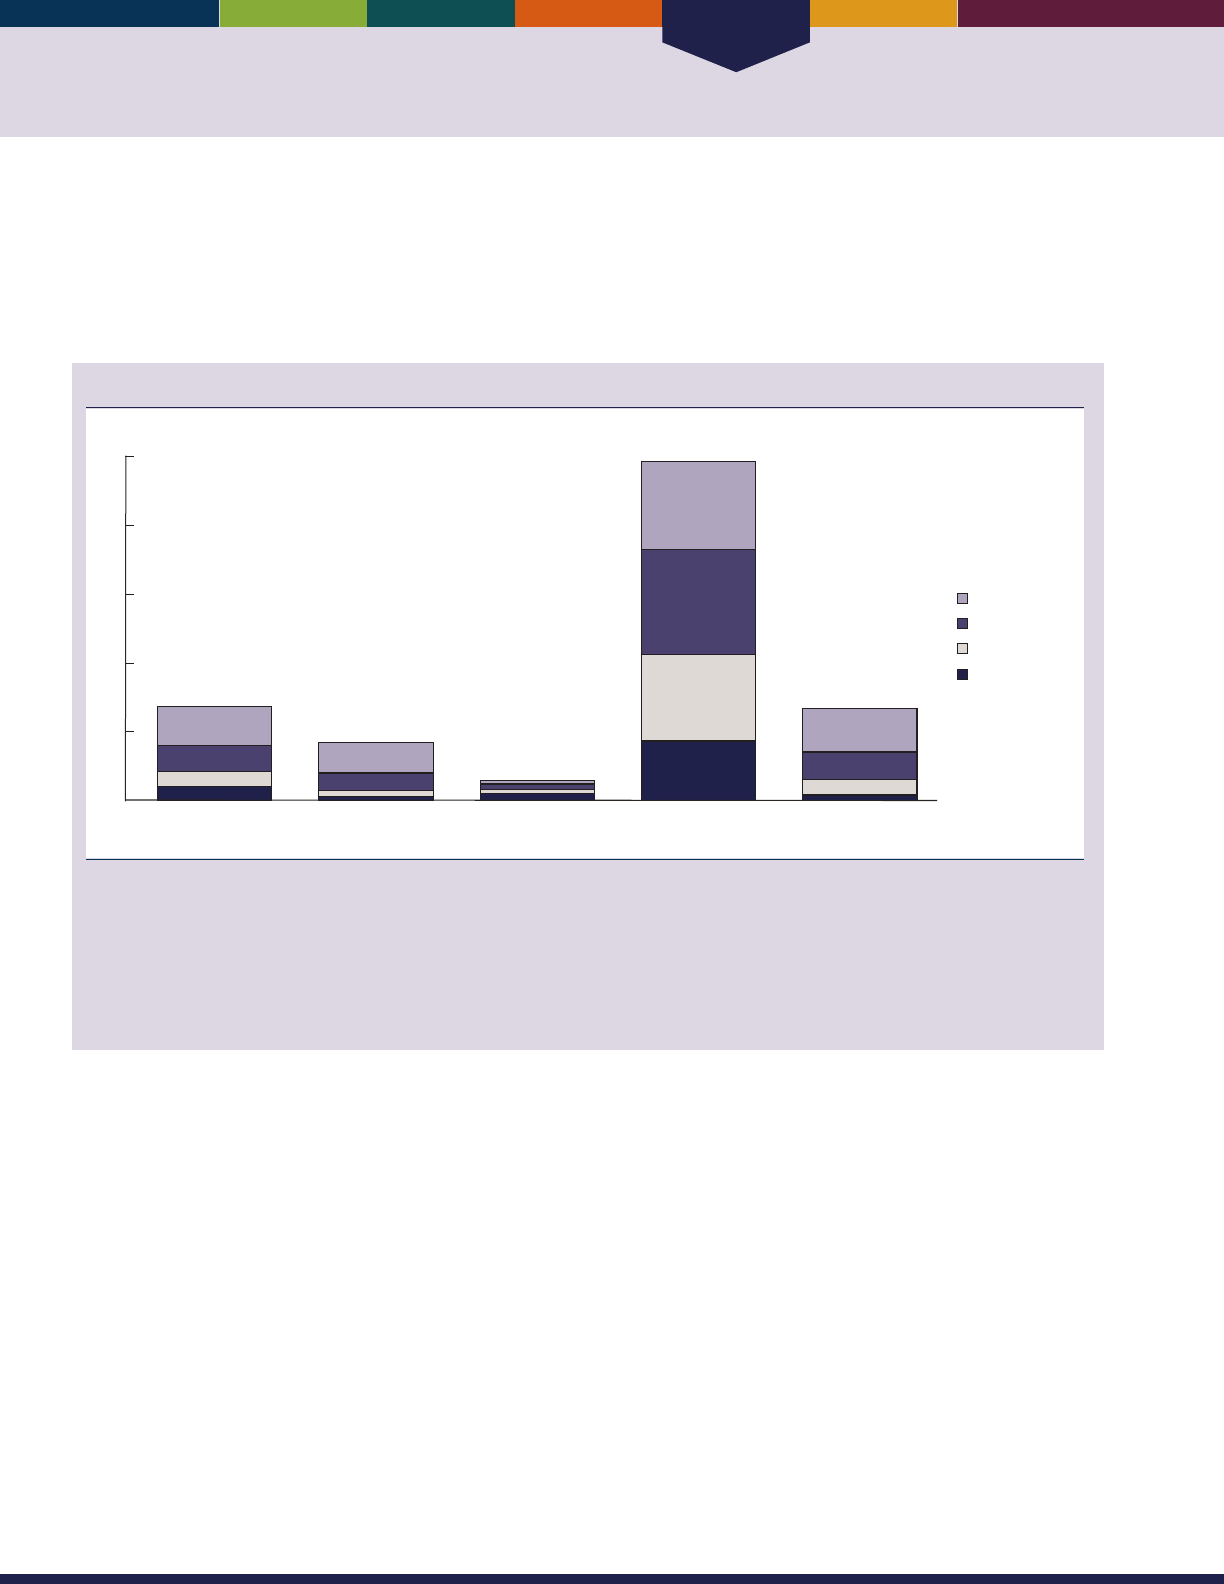
Health Care
60
INDICATOR 38: Long-Term Care Providers
Long-term care refers to a broad range services and supports to meet the needs of frail older adults and other people who are
limited in their abilities for self-care because of chronic illness or a disability. Long-term care services include health care-
related services and services that are not health-care related; they include assistance with activities of daily living (ADLs),
assistance with instrumental activities of daily living (IADLs), and health maintenance tasks. Care can be provided in the
home or in a variety of other settings.
43,44
Number of users of long-term care services, by sector and age group, 2013 and 2014
Millions
Nursing homes
Residential care
communities
Adult day
services centers
Home health
agencies
Hospices
0
1
2
3
4
5
Less than 65
65–74
75–84
85 and over
NOTE: Long-term care services are provided by paid, regulated providers. They comprise both health care-related and non-health care-related
services, including post-acute care and rehabilitation. People can receive more than one type of service. The estimated number of users of
nursing homes, residential care communities, and adult day services centers represents participants or residents enrolled on the day of data
collection in 2014. The estimated number of users of home health agencies represents patients who ended care (i.e., were discharged) in
2013. The estimated number of users of hospice represents patients who received care at any time in 2013. The number in each age group is
calculated by applying the percentage distribution by age to the estimated total number of users. See http://www.cdc.gov/nchs/data/series/
sr_03/sr03_038.pdf for denitions.
Reference population: These data refer to the resident population.
SOURCE: Centers for Disease Control and Prevention, National Center for Health Statistics, National Study of Long-Term Care Providers.
• In 2014, about 1.2 million people age 65 and over
were residents of nursing homes. In the same year,
nearly 780,000 people age 65 and over lived in
residential care communities such as assisted living
facilities. In both settings, people age 85 and over were
the largest share by age group among residents.
• In 2014, approximately 280,000 participants received
care in adult day services centers. About two-thirds of
the participants (180,000) were age 65 and over.
• Nearly 5 million people received care from a home
health agency in 2013. People ages 75–84 (about
1.5million) made up the largest share by age group
of people receiving care from a home health agency.
Nearly equal numbers (about 1.3 million) of people
ages 65–74 and age 85 and over received home health
care.
• In 2013, 1.3 million people received hospice care.
Nearly 50 percent (630,000) of the hospice patients
were age 85 and over.
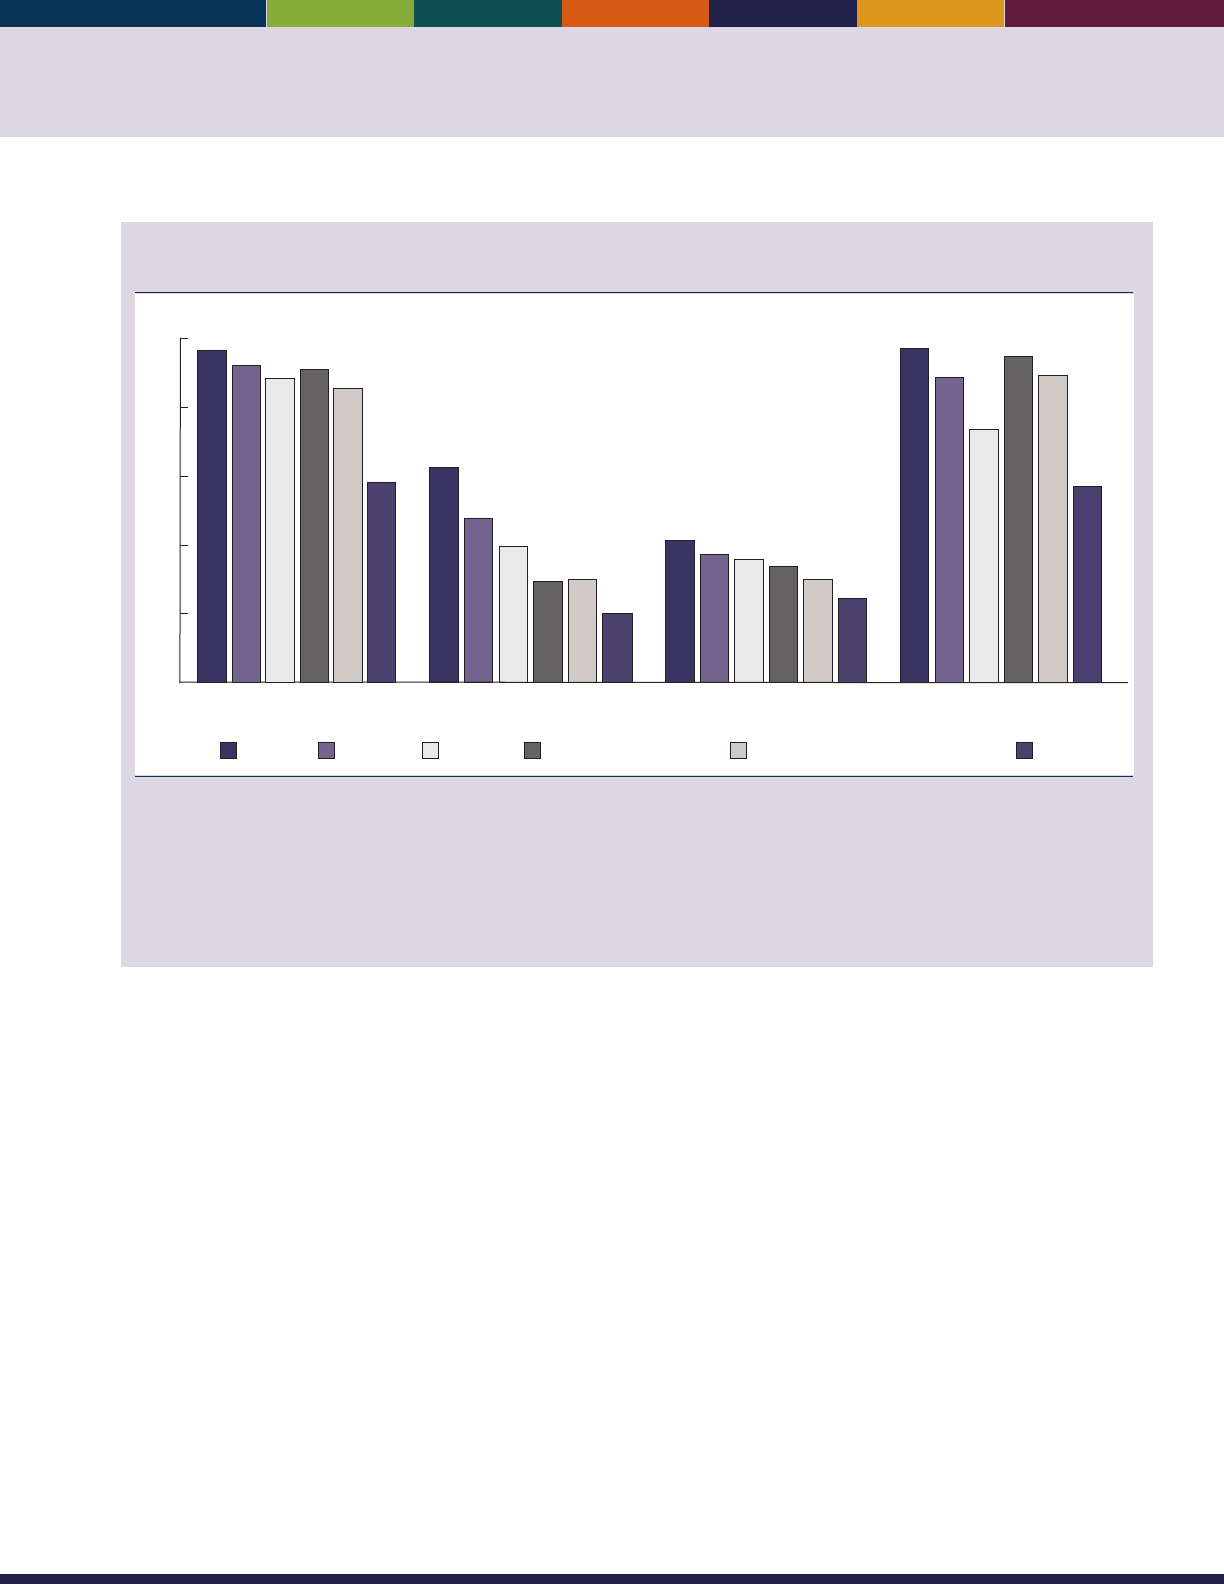
61
Percentage of users of long-term care services needing any assistance with activities of daily
living (ADLs), by sector and activity, 2013 and 2014
Nursing homes Residential care
communities
Adult day
services centers
Home health
agencies
Percent
Bathing EatingToiletingDressing Walking or locomotion Transferring in/out of bed or chair
58
96
92
85
88
91
20
62
47
30
39
29
24
41
37
30
36
34
88
73
57
96
94
88
0
20
40
60
80
100
NOTE: Long-term care services are provided by paid, regulated providers. They comprise both health care-related and non-health care-related
services, including post-acute care and rehabilitation. People can receive more than one type of service. Users of formal long term care include
persons of all ages. In nursing homes, 85 percent of residents were age 65 and over. In residential care communities, 93 percent of residents
were age 65 and over. In adult day services centers, 64 percent of participants were age 65 and over. Among home health care patients,
83 percent were age 65 and over. Data were not available for hospice patients. Participants, patients, or residents were considered needing
any assistance with a given activity if they needed help or supervision from another person or used special equipment to perform the activity.
See http://www.cdc.gov/nchs/data/series/sr_03/sr03_038.pdf for denitions.
Reference population: These data refer to the resident population.
SOURCE: Centers for Disease Control and Prevention, National Center for Health Statistics, National Study of Long-Term Care Providers.
• In 2014, most residents of nursing homes needed
help with activities of daily living (ADLs). Nearly
all (96percent) needed help with bathing, and most
needed help with dressing, toileting, and walking
(92percent, 88percent, and 91 percent, respectively).
• In 2014, 62 percent of residents of residential care
communities needed assistance with bathing. About
29 percent needed help with walking, and 30percent
needed assistance transferring in or out of beds or
chairs.
• In 2014, less than half of adult day center participants
needed assistance with ADLs. About 41percent needed
help with bathing and 34 percent needed help with
walking.
• e majority of home health care patients in 2013
needed assistance with all six ADLs. Nearly all (96
percent) needed help with bathing.
• Assistance with bathing was the most common need
across all sectors, while assistance with eating was the
least common.
Data for this indicator’s charts and bullets can be found in
Tables 38a and 38b on page 150.

62

Environment
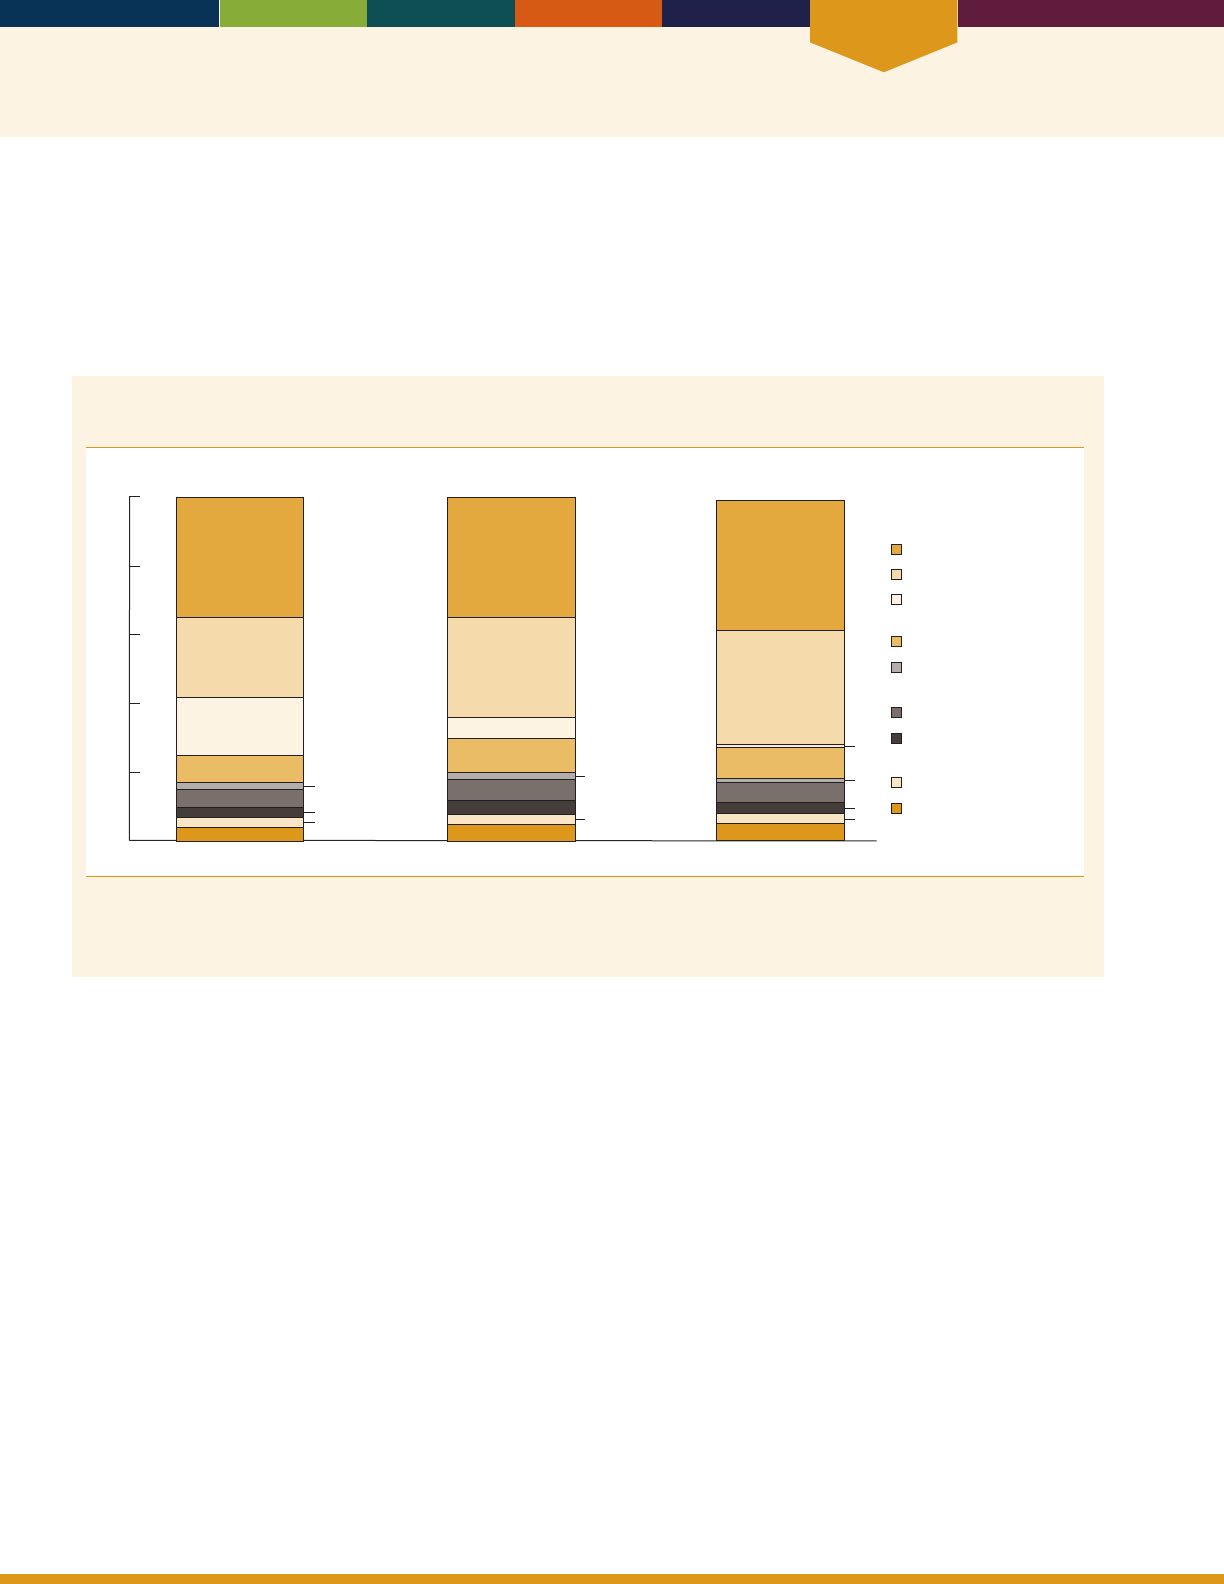
Environment
64
INDICATOR 39: Use of Time
How individuals spend their time reects their nancial, health and personal situations, employment status, needs, and
desires. Time-use data show that as Americans get older, they spend more of their time in leisure activities.
As people age, they are less likely to be employed. In 2014, a majority (61 percent) of people ages 55–64 were employed
compared with 25 percent of those ages 65–74 and 8 percent of those age 75 and over.
45
is change in employment status is
reected in how older Americans spent their time.
Percentage of day that people age 55 and over spent doing selected activities on an average day,
by age group, 2014
55–64 65–74
75 and over
3
3
2
4
5
8
17
23
35
3
2
5
4
6
10
6
29
37
5
6
9
1
1
33
38
Percent
0
20
40
60
80
100
3
3
Sleeping
Leisure activities
Work and work-related
activities
Household activities
Care for and
helping others
Eating and drinking
Purchasing goods
and services
Grooming
Other activities
NOTE: “Other activities” includes activities such as educational activities; organizational, civic, and religious activities; and telephone calls.
Chart includes people who did not work at all.
Reference population: These data refer to the civilian noninstitutionalized population.
SOURCE: Bureau of Labor Statistics, American Time Use Survey.
• On an average day, people ages 55–64 spent 17 percent
of their time (4 hours) working or doing work-related
activities, compared with 6 percent (about 1 hour
and 20 minutes) for people ages 65–74 and 1percent
(20minutes) for people age 75 and over.
In 2014, older Americans spent, on average, more
than one-quarter of their time in leisure activities. is
proportion increased with age: Americans age 75 and
over spent 33 percent of their time in leisure activities,
compared with 23 percent for those age 55–64.
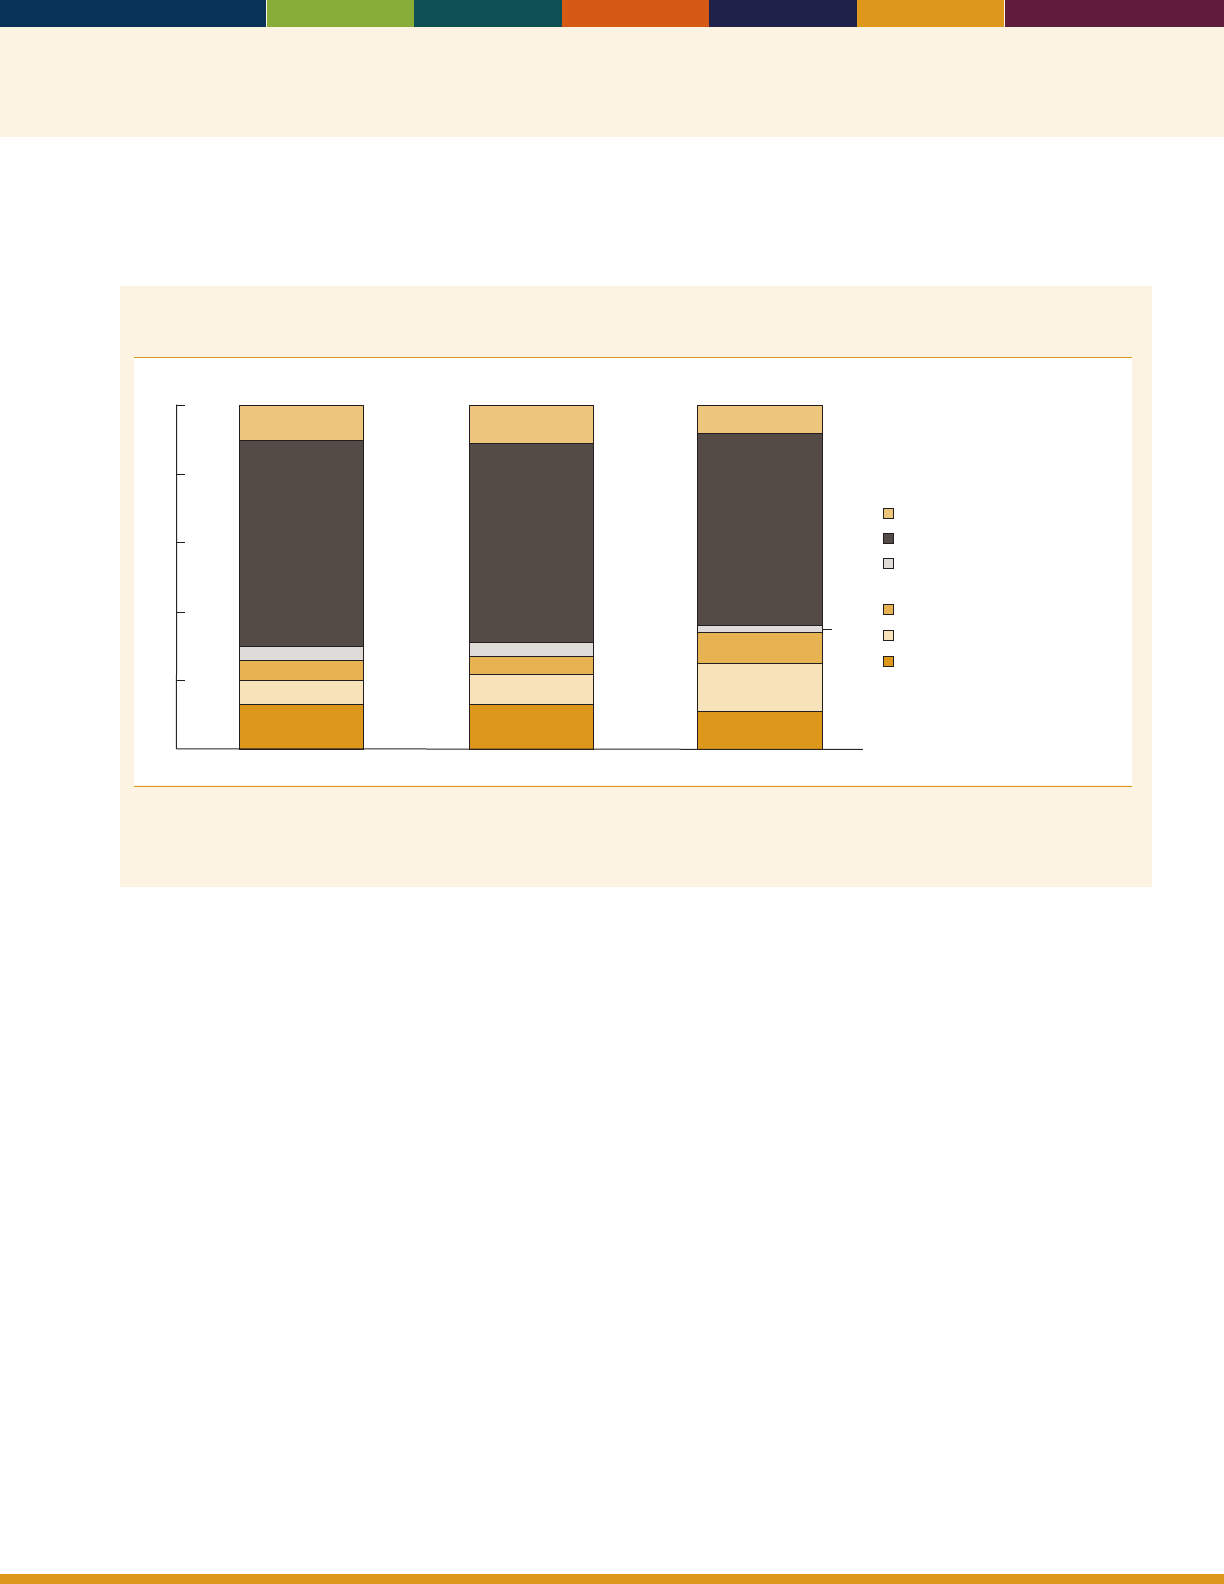
65
Leisure activities are those done when free from duties such as working, shopping, doing household chores, or caring for
others. During these times, individuals have exibility in choosing what to do.
Percentage of total leisure time that people age 55 and over spent doing selected leisure
activities on an average day, by age group, 2014
55–64 65–74 75 and over
13
6
4
60
11
13
9
4
58
11
11
14
9
2
56
9
Percent
0
20
40
60
80
100
7
5
Reading
Relaxing and thinking
Other leisure activities
Participation in sports, exercise,
and recreation
Watching TV
Socializing and communicating
NOTE: “Other leisure activities” includes activities such as playing games, using the computer for leisure, doing arts and crafts as a hobby,
experiencing arts and entertainment (other than sports), and engaging in related travel.
Reference population: These data refer to the civilian noninstitutionalized population.
SOURCE: Bureau of Labor Statistics, American Time Use Survey.
• Watching TV was the activity that occupied the most
leisure activity time—more than one-half of the total—
for Americans age 55 and over.
• Americans age 75 and over spent a higher percentage
of their leisure time reading than did Americans ages
55–64 (14 percent versus 7 percent) and relaxing and
thinking (9 percent versus 6 percent). Americans age
75 and over spent just over an hour per day reading,
compared with 22 minutes per day for Americans
ages55–64.
• In general, older Americans spend more time reading
for leisure than do those under age 65. In 2014,
Americans age 65 and over spent 49 minutes per day
reading for leisure.
• e proportion of leisure time that older Americans
spent socializing and communicating—such as
visiting friends or attending or hosting social events—
declined with age. For Americans ages 55–64, about
11 percent of leisure time was spent socializing and
communicating, compared with 9 percent for those
age75 and over.
Data for this indicator’s charts and bullets can be found in
Tables 39a and 39b on page 151.
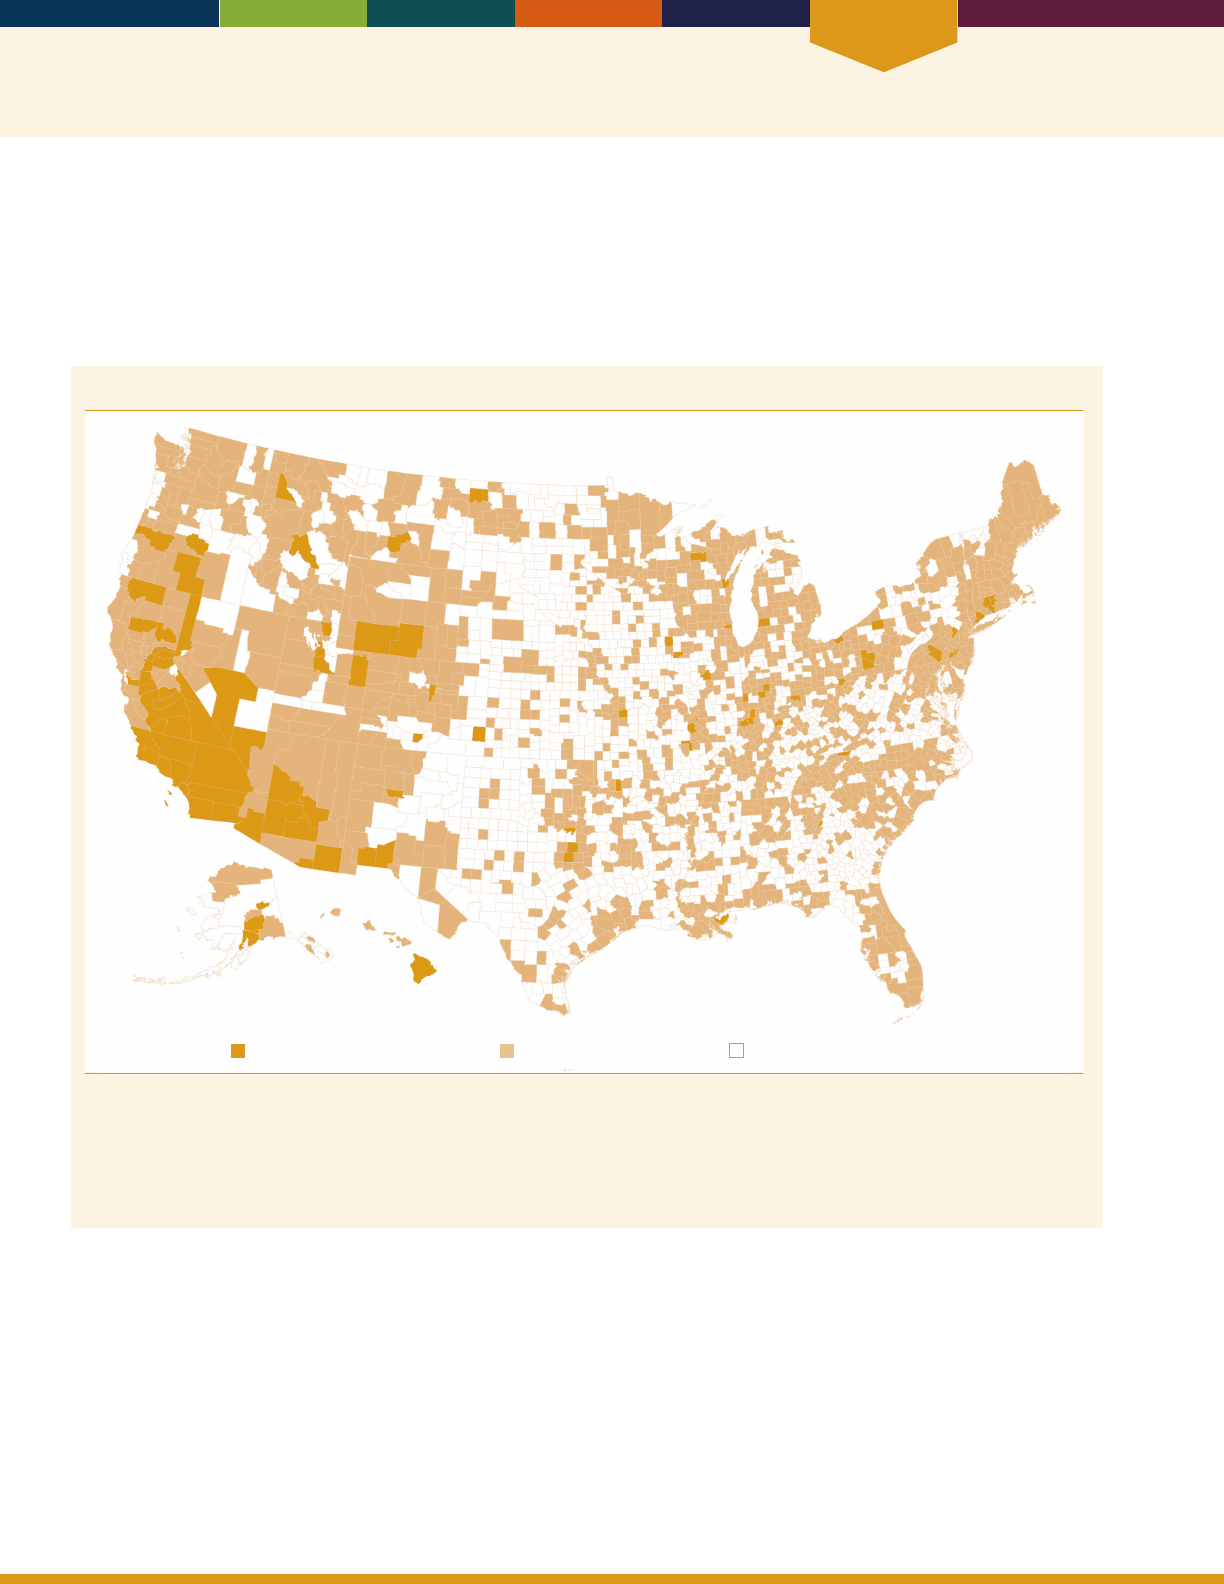
Environment
66
INDICATOR 40: Air Quality
As people age, their bodies are less able to compensate for the eects of environmental hazards. Air pollution can
aggravate chronic heart and lung diseases, leading to increased medication use, more visits to health care providers,
admissions to additional emergency rooms and hospitals, and even death. An important indicator for environmental
health is the percentage of older adults living in areas that have measured air pollutant concentrations above the level of
the national standards of the Environmental Protection Agency (EPA).
Counties with instances of “poor air quality” for any standard in 2014
Counties with “poor air quality” Other monitored counties Unmonitored counties
NOTE: The term “poor air quality” is dened as air quality concentrations above the level of the National Ambient Air Quality Standards
(NAAQS). The term “any standard” refers to any NAAQS for ozone, particulate matter, nitrogen dioxide, sulfur dioxide, carbon monoxide,
or lead. Measuring concentrations above the level of a standard is not equivalent to violating the standard. The level of a standard may
be exceeded on multiple days before the exceedance is considered a violation of the standard.
Reference population: These data refer to the resident population.
SOURCE: U.S. Environmental Protection Agency, Ofce of Air Quality Planning and Standards, Air Quality System; U.S. Census Bureau, 2010
Population.
• In 2014, approximately 57 million people lived in
counties where monitored air was unhealthy at times
because of high levels of at least one of the six principal
air pollutants: ozone, PM, nitrogen dioxide, sulfur
dioxide, carbon monoxide, and lead. About 12 percent,
or nearly 7 million people, of those living in counties
where monitored air quality was unhealthy at times
were age 65 and over. e vast majority of areas that
experienced unhealthy air did so because of one or both
of two pollutants—ozone and PM
2.5
.
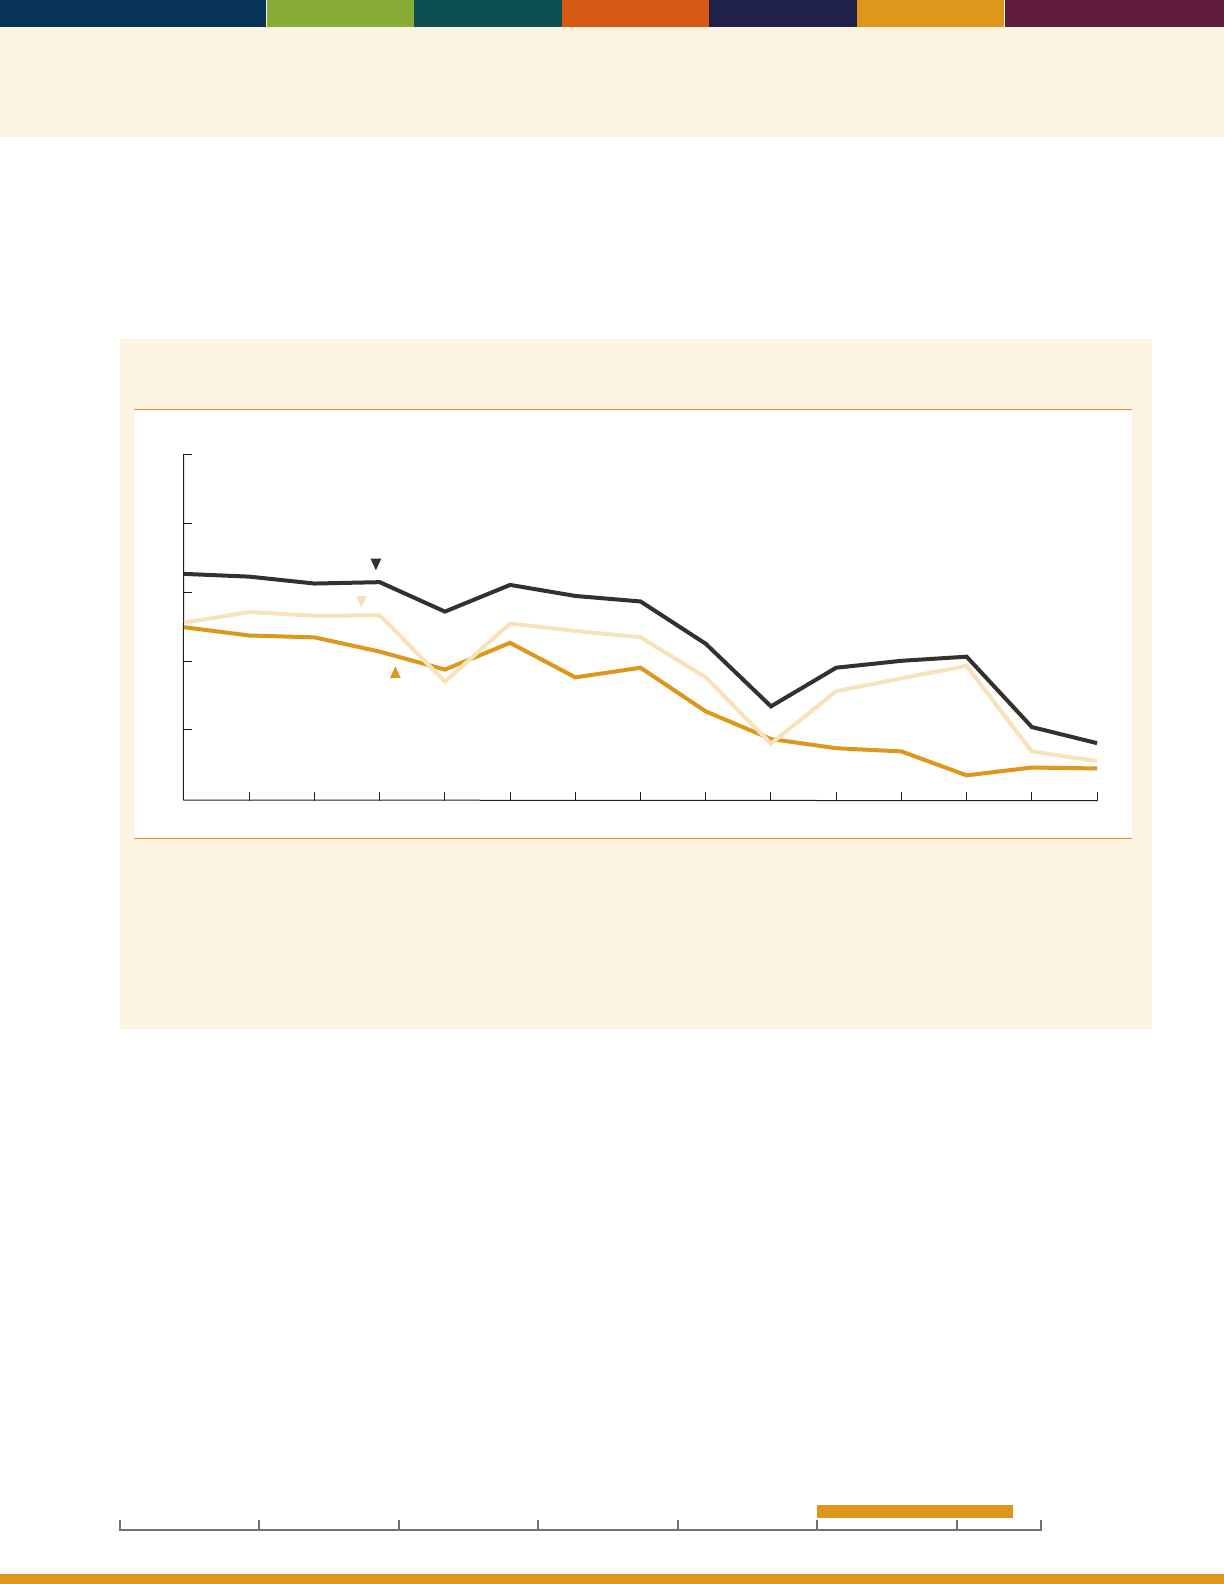
67
Ozone and particulate matter (PM), especially the smaller, ne particle pollution called PM
2.5
, have the greatest potential
to aect the health of older adults. Fine particle pollution has been linked to premature death, cardiac arrhythmias and
heart attacks, asthma attacks, and the development of chronic bronchitis. Ozone, even at low levels, can exacerbate
respiratory diseases such as chronic obstructive pulmonary disease or asthma.
46–50
Percentage of people age 65 and over living in counties with instances of “poor air quality,” by
selected pollutant measures, 2000–2014
Percent
0
20
40
60
80
100
2000 2002 2004 2006 2008 2010 20142012
Particulate Matter
(PM
2.5
)
Ozone
Any standard
NOTE: The term “poor air quality” is dened as air quality concentrations above the level of the National Ambient Air Quality Standards
(NAAQS). The term “any standard” refers to any NAAQS for ozone, particulate matter, nitrogen dioxide, sulfur dioxide, carbon monoxide,
or lead. Data for previous years have been computed using the standards in effect as of August 2015 to enable comparisons over time.
This results in percentages that are not comparable to those in previous publications of
Older Americans.
Measuring concentrations above
the level of a standard is not equivalent to violating the standard. The level of a standard may be exceeded on multiple days before the
exceedance is considered a violation of the standard.
Reference population: These data refer to the resident population.
SOURCE: U.S. Environmental Protection Agency, Ofce of Air Quality Planning and Standards, Air Quality System; U.S. Census Bureau, 2010
Population.
• e percentage of people age 65 and over living in
counties that experienced poor air quality for any
standard decreased from 66 percent in 2000 to
16percent in 2014.
• In 2014, about 11 percent of people age 65 and over
lived in counties with poor air quality for ozone,
compared with 51 percent in 2000.
• A comparison of 2000 and 2014 showed a reduction in
exposure to PM
2.5
pollution. In 2000, about 50percent
of people age 65 and over lived in a county where
PM
2.5
concentrations were at times above the EPA
standard, compared with 9 percent of people age65
and over in 2014.
Data for this indicator’s charts and bullets can be found in
Tables 40a and 40b on pages 152–154.
20162000 201019901980197019601950
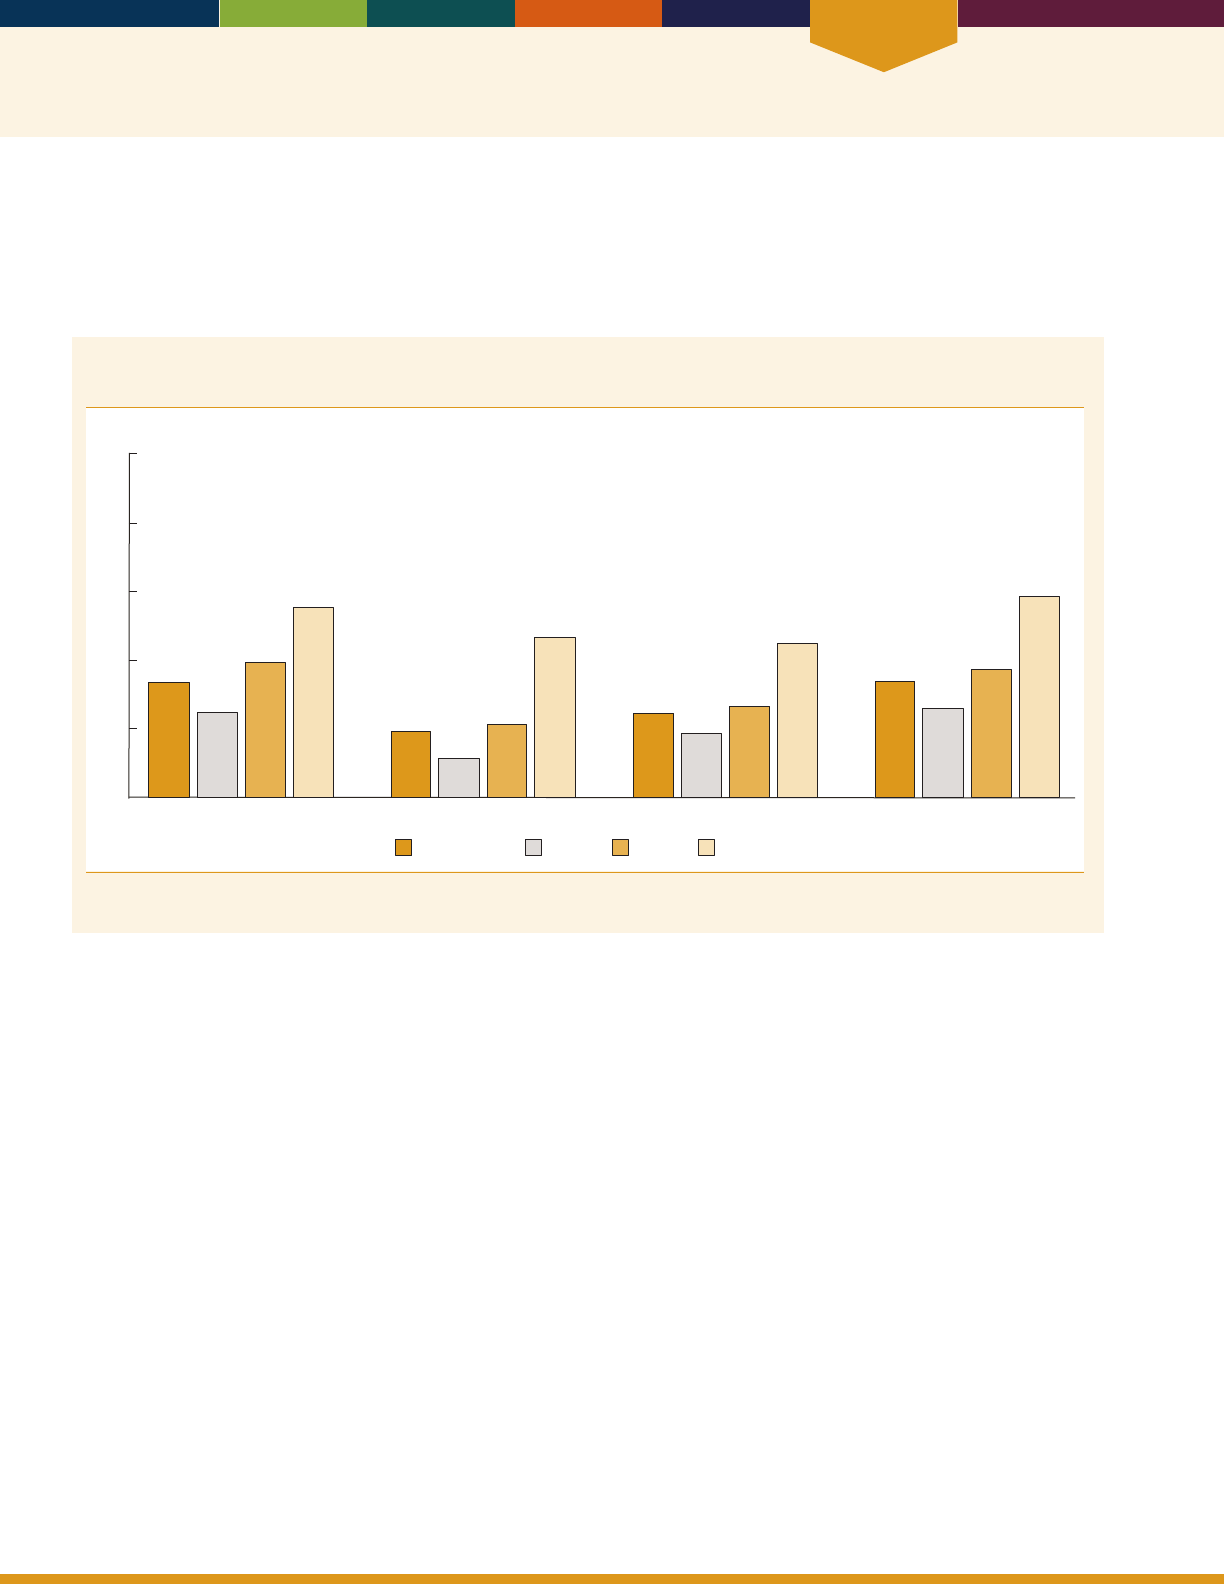
Environment
68
INDICATOR 41: Transportation
e ability to travel independently to appointments, to the grocery store, and to visit friends plays an important role in the
daily lives of older adults. For many older adults, the ability to travel independently may change due to health or physical
problems. However, access to modes of transportation such as riding with a friend or using public transit may help older
adults continue to get the services they need.
Percentage of noninstitutionalized Medicare beneciaries age 65 and over who made a change in
transportation mode due to a health or physical problem, by type of change and age group, 2013
Percent
75–84 85 and over65–7465 and over
33
25
39
55
19
11
21
47
25
19
27
45
34
26
37
58
Limits driving to daytime Has given up driving altogether Has trouble getting places Has reduced travel
0
20
40
60
80
100
Reference population: These data refer to noninstitutionalized Medicare beneciaries.
SOURCE: Centers for Medicare & Medicaid Services, Medicare Current Beneciary Survey, Access to Care.
• In 2013, 33 percent of the noninstitutionalized
Medicare population age 65 and over had limited
their driving to daytime because of a health or physical
problem. e percentage of people who had limited
their driving to daytime was greater for those age
85 and over (55 percent) than for those ages 65–74
(25percent).
• Furthermore, 19 percent of the non institutionalized
Medicare population age 65 and over had given up
driving altogether, about 24 percent had trouble getting
places, and 34 percent had reduced their travel because
of a health or physical problem.
Data for this indicator’s charts and bullets can be found in
Table 41 on page 155.

Special Feature
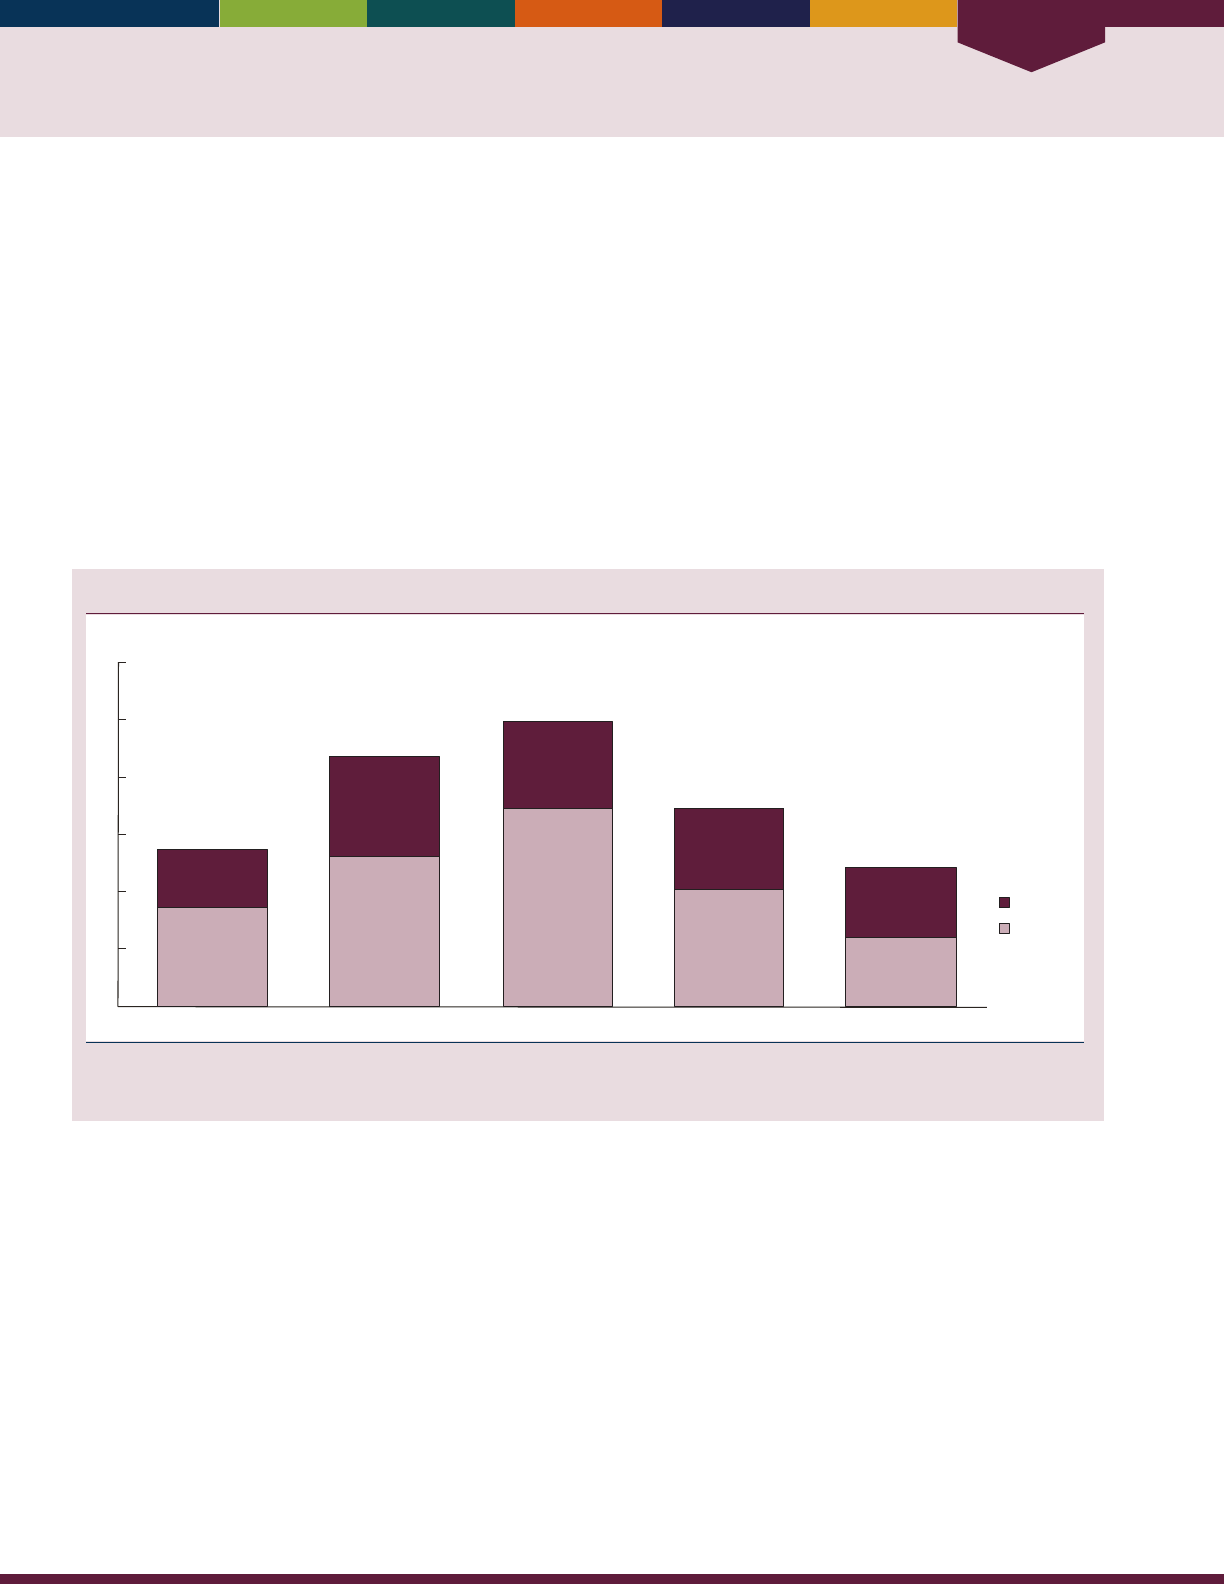
Special Feature
70
SPECIAL FEATURE: Informal Caregiving
Despite eorts to stay healthy and avoid disease, many older adults will eventually develop some degree of limitations
and need paid or unpaid help with basic daily living activities. Family members or friends provide the majority of this
assistance, without pay, as informal caregivers, including help with everyday tasks such as bathing, dressing, preparing a
meal, or managing money. At least 90 percent of older adults receiving help with daily activities receive some informal
care, and about two-thirds receive only informal care.
51,52,53,54
In 2011, an estimated 18 million informal caregivers provided 1.3 billion hours of care on a monthly basis to Medicare
beneciaries age 65 and over. Informal caregivers are a diverse population that includes spouses, children, and other
relatives such as daughters-in-law, grandchildren, and friends. Caregivers range in age from teenagers to older adults.
About half are employed. Research has shown that the nancial, emotional, and physical demands of caregiving can be
high and that the resulting stress or burden can threaten the ability of caregivers to maintain their eorts.
55
is special feature provides some information about the population of informal caregivers of older adults with
functional limitations.
Number of informal caregivers, by age group and sex, 2011
0
1
3
4
5
6
Number (in millions)
2
Less than 45 55–6445–54 75 and over
Men
Women
65–74
Reference population: People of all ages who, in the last month, helped with one or more self-care, household, or medical activities for a
Medicare enrollee age 65 or over who had a chronic disability.
SOURCE: National Study on Caregiving.
• In 2011, many more caregivers were women
(11.1million) than men (6.9 million), and most
informal caregivers were middle-aged (ages 45–64).
• Of the approximately 2.7 million caregivers in the
youngest group (those less than 45), most were adult
children or grandchildren.
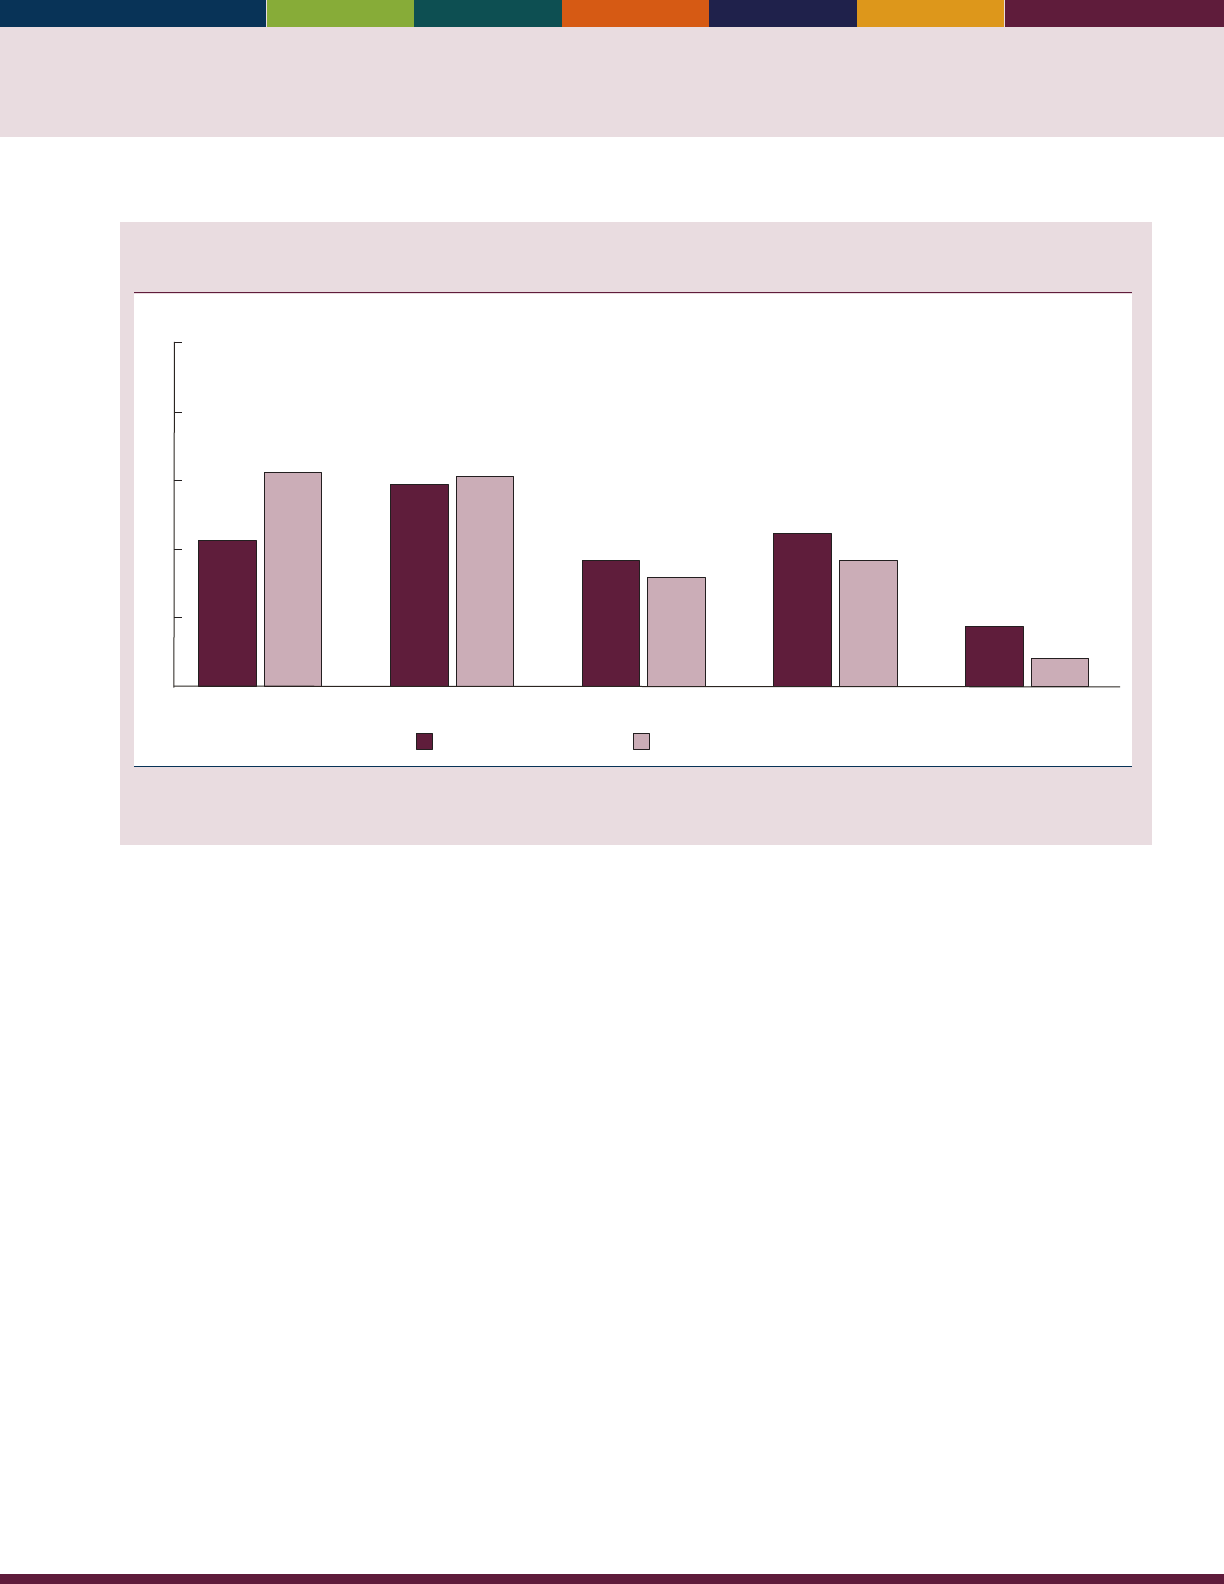
71
Percentage distribution of informal caregivers and number of caregiving hours provided, by
relationship to care recipient, 2011
0
10
20
30
40
50
Percent
Percentage of caregiving hours
Percentage of caregivers
Son
Other relative
Non-relativeDaughterSpouse
9
4
22
18
18
16
29
31
21
31
Reference population: People of all ages who, in the last month, helped with one or more self-care, household, or medical activities for a
Medicare enrollee age 65 or over who had a chronic disability.
SOURCE: National Study on Caregiving.
• In 2011, almost half of informal caregivers were a
child of the care recipient, more frequently a daughter
(29percent) than a son (18 percent).
• Although spouses were only 21 percent of informal
caregivers, they provided more than 31 percent of the
total hours of care in 2011.
• Other relatives providing informal care included
granddaughters (5 percent) and daughters-in-law
(3percent).
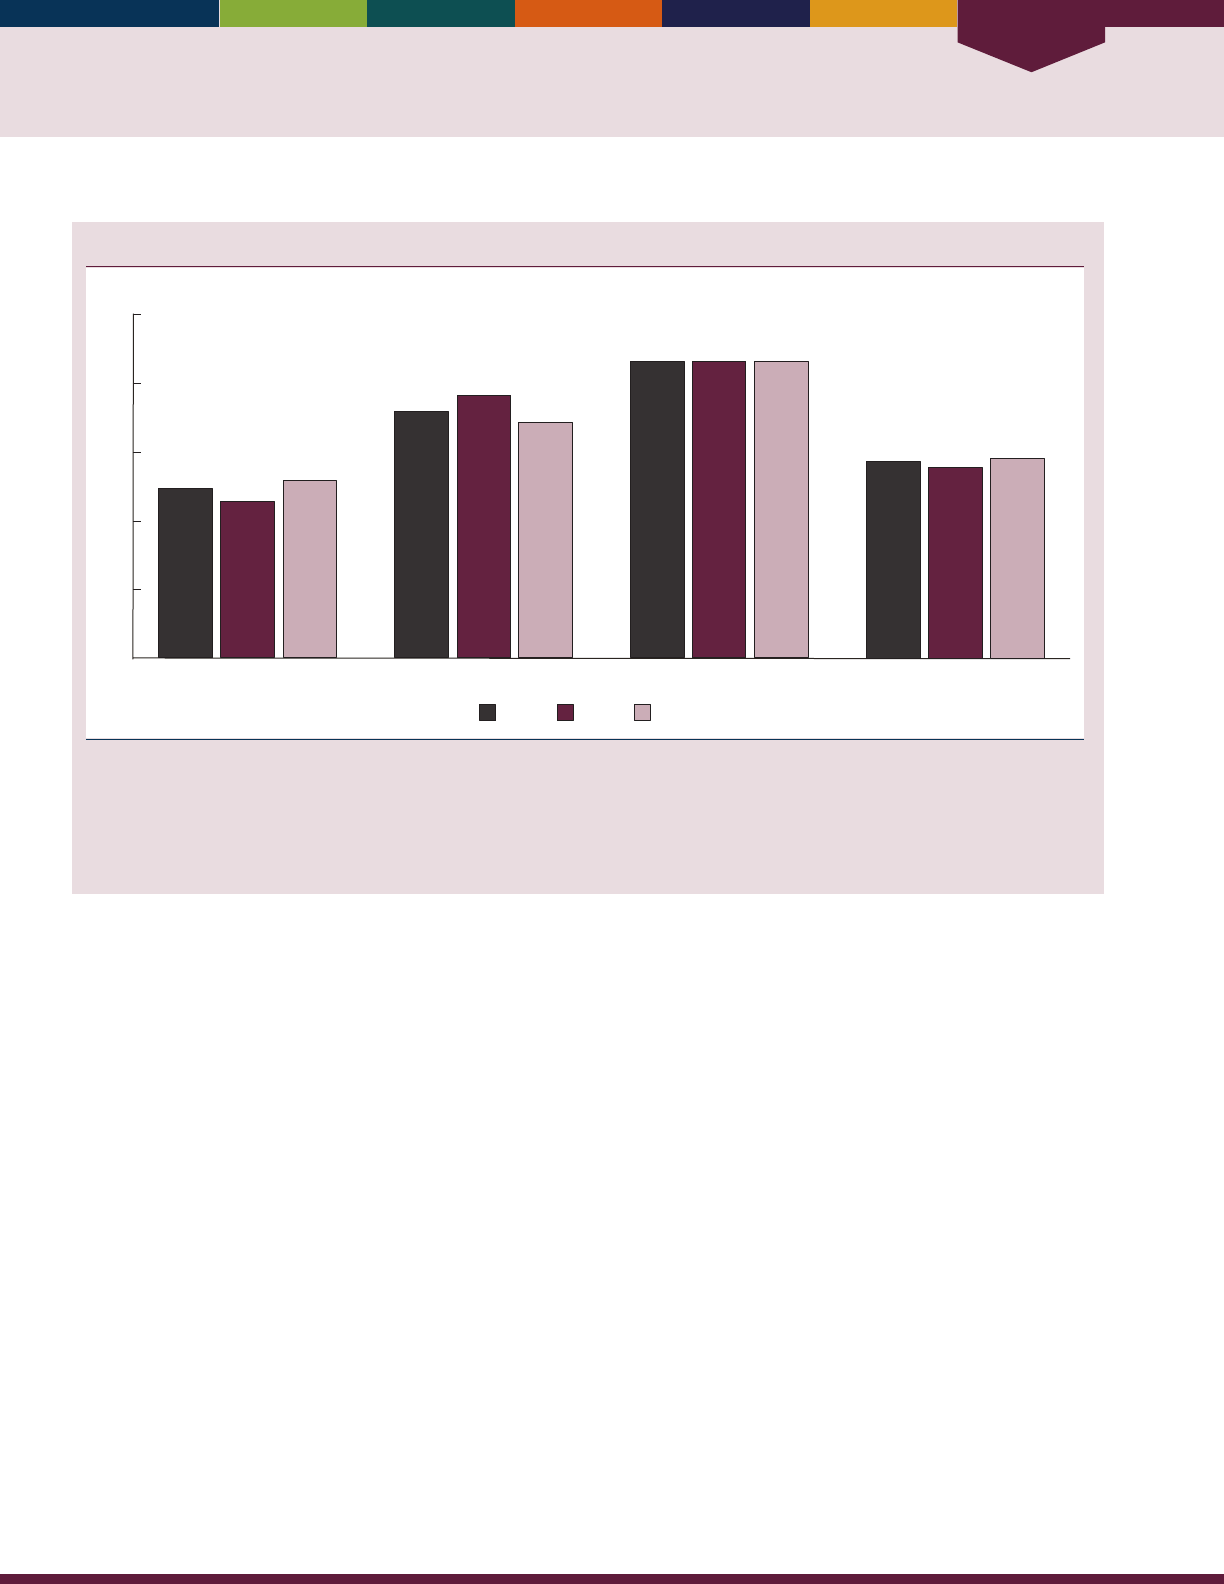
Special Feature
72
Percentage of caregivers providing assistance, by type of assistance and sex, 2011
Percent
WomenMenTotal
Transportation
Medical or health care
MobilitySelf-care
0
20
40
60
80
100
57
55
58
86 86 86
72
76
69
49
46
52
NOTE: Respondents reported whether they helped with different types of activities. Self-care activities include bathing, dressing, eating, and
toileting. Mobility-related activities include getting out of bed, getting around inside one’s home or building, and leaving one’s home or
building. Health or medical care tasks were assistance with diet, foot care, giving injections, and managing medical tasks, such as ostomy care,
IV therapy assistance, or blood tests.
Reference population: People of all ages who, in the last month, helped with one or more self-care, household, or medical activities for a
Medicare enrollee age 65 or over who had a chronic disability.
SOURCE: National Study on Caregiving.
• ere were small gender dierences in the type of
careprovided by informal caregivers.
• Almost half of all caregivers assisted with self-
care activities, but a slightly larger proportion of
women caregivers (52 percent) than male caregivers
(46percent) provided such care.
• ere were larger gender dierences in mobility
assistance: 76 percent of men provided mobility
assistance, compared with 69 percent of women.
• e vast majority of caregivers assisted with trans-
portation, and there were no gender dierences
inproviding this type of help.
• Men were less likely (55 percent) than women
(58percent) to assist with medical or health care.
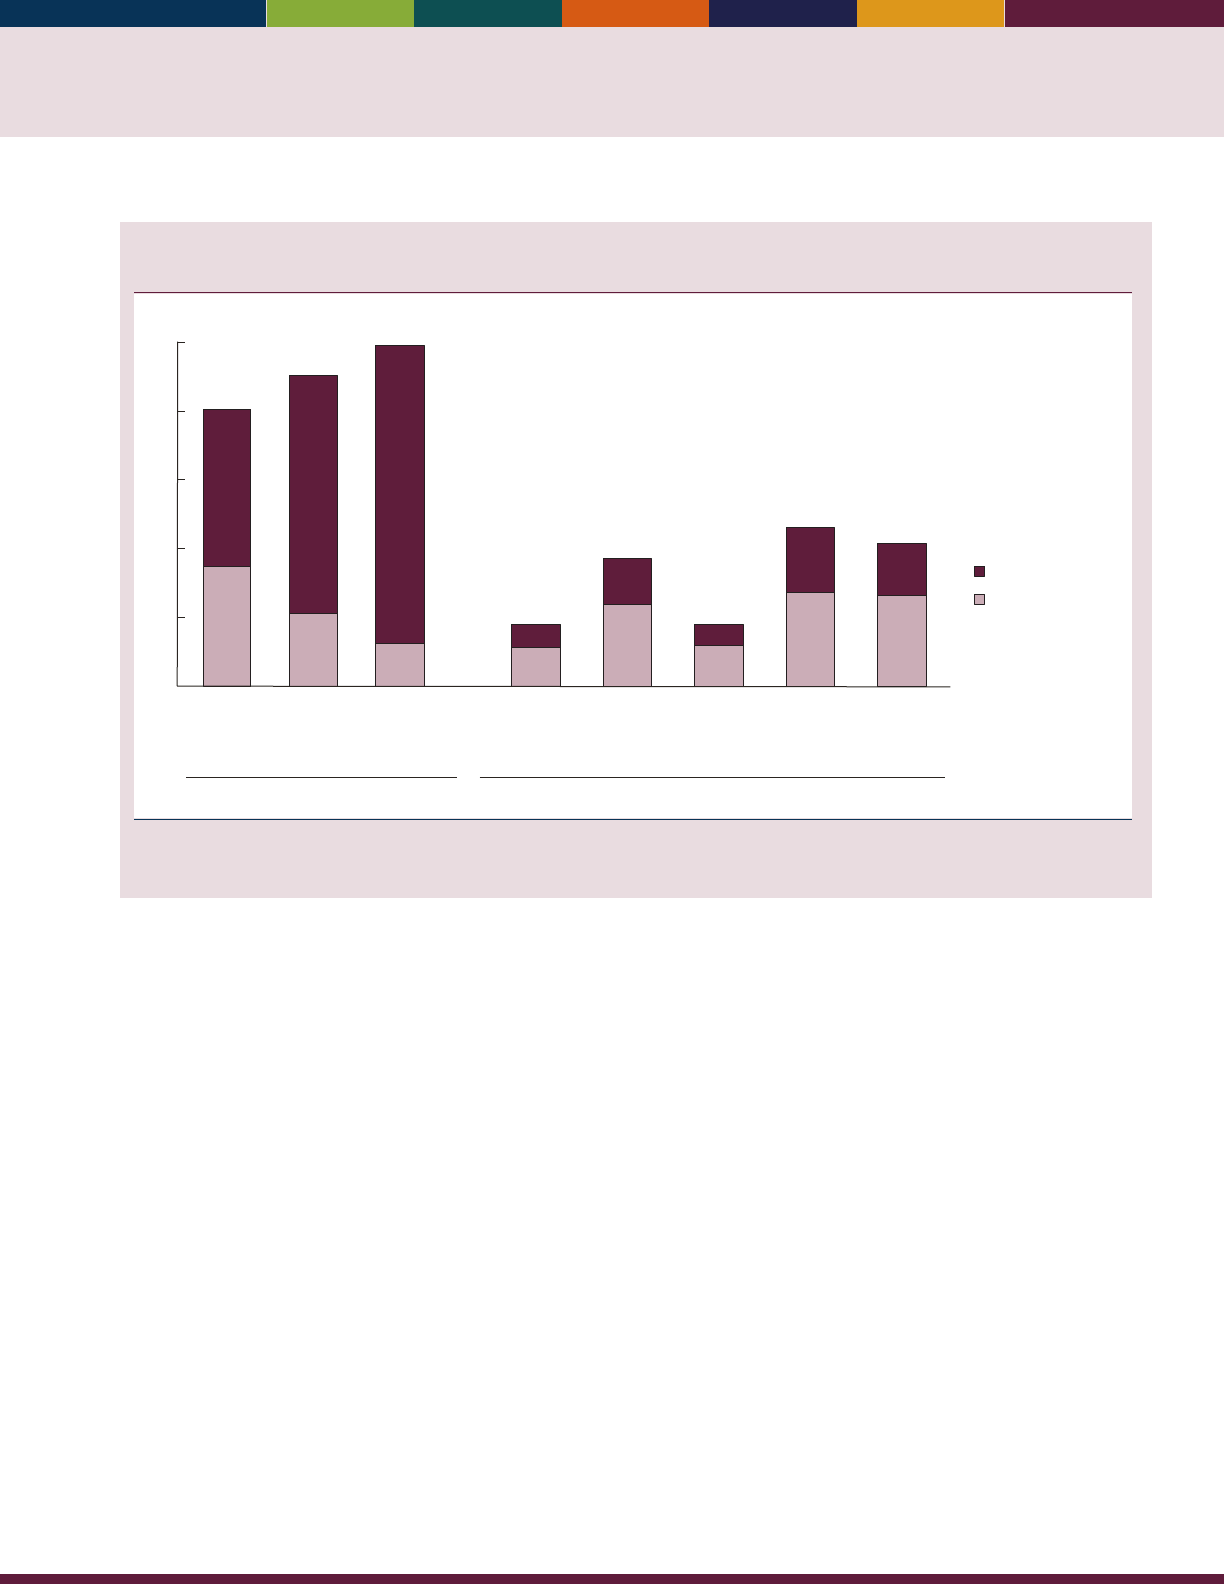
73
Percentage of informal caregivers reporting positive and negative aspects of caregiving, by level
of impact, 2011
Financial
difficulties
Emotional
difficulties
Physical
difficulties
Substantial impact
Some impact
46
35
80
69
21
90
86
13
99
19
27
15
26
46
42
14
24
6
12
37
18
7
11
18
More
confident
about
abilities
Brought
you closer
to care
recipient
Positive Negative
Satisfied that
recipient is
well-cared
for
Have more
things than
you can
handle
Don’t have
time for
yourself
0
20
40
60
80
100
Percent
Reference population: People of all ages who, in the last month, helped with one or more self-care, household, or medical activities for a
Medicare enrollee age 65 or over who had a chronic disability. Estimates may not sum to the totals because of rounding.
SOURCE: National Study on Caregiving.
• In 2011, most caregivers reported substantial positive
impacts of caregiving. For example, 69 percent
identied substantial positive impacts of being
closertothe care recipient.
• About 86 percent reported that informal caregiving
gives them satisfaction that the care recipient is well
cared for.
• Caregivers also reported negative aspects of caregiving;
almost half said they have more things than they can
handle or don’t have time for themselves. Less than one
in ve caregivers reported that these negative impacts
were a substantial problem.
Data for this indicator’s charts and bullets can be found in
Tables CG1 through CG6 on pages 156–157.

74

References

76
References
1
Retrieved May 19, 2016 from http://www.nationalacademies.org/hmd/activities/global/violenceforum/2013-apr-17.
aspx. For the PowerPoint presentation on survey methodology, see http://www.nationalacademies.org/hmd/~/media/
Files/Activity%20Files/Global/ViolenceForum/2013-APR-17/Presentations/02-09-Beach.pdf.
2
United Nations Statistics Division. (2012). Washington Group on Disability Statistics and UNECE Task Force on
Measuring Health Status (Budapest Initiative) Retrieved June 7, 2012 from http://unstats.un.org/unsd/methods/
citygroup/washington.htm and http://www.unece.org/statistics/statsexperts/task-force-on-measuring-health-status-
budapest-initiative.html.
3
Horiuchi, S. (2000). Greater lifetime expectation. Nature, 405(6788), 744–745.
4
Oeppen, J., & Vaupel, J. W. (2002). Broken limits to life expectancy. Science, 296(5570), 1029–1031.
5
Tuljapurkar, S., Li, N., & Boe, C. (2000). A universal pattern of mortality decline in the G7 countries. Nature,
405(6788), 789–792.
6
Department of Veterans Aairs. Unpublished analyses: American Community Survey 2005, Current Population Survey
2004, National Health Interview Survey 2005, National Long Term Care Survey 2004, and National Survey of Veterans
2001.
7
Department of Veterans Aairs, Oce of the Secretary (2006, October). Strategic Plan FY 2006–2011.
8
Social Security Administration. (2016). Income of the Aged Chartbook, 2014 (SSA Publication No. 13-11727).
Washington, DC: Author.
9
Social Security Administration. Statistical Supplement to the Social Security Bulletin 2015, Table 5.A.14, Table 5.A.a6,
and Table 6 B.5.1.
10
National Academies of Sciences, Engineering, and Medicine. (2015). e Growing Gap in Life Expectancy by Income:
Implications for Federal Programs and Policy Responses. Committee on the Long-Run Macroeconomic Eects of the Aging
U.S. Population-Phase II. Committee on Population, Division of Behavioral and Social Sciences and Education. Board
on Mathematical Sciences and eir Applications, Division on Engineering and Physical Sciences. Washington, DC: e
National Academies Press.
11
OECD (2015). Health at a Glance 2015: OECD Indicators, OECD Publishing, Paris. http://dx.doi.org/10.1787/
health_glance-2015-en
12
Centers for Disease Control and Prevention. (2016, January). Chronic disease overview. Retrieved December 11, 2015,
from http://www.cdc.gov/chronicdisease/overview/index.htm
13
U.S. Department of Health and Human Services. (2010, December). Multiple chronic conditions—a strategic framework:
Optimum health and quality of life for individuals with multiple chronic conditions. Retrieved from http://www.hhs.gov/ash/
initiatives/mcc/mcc_framework.pdf
14
U.S. Department of Health and Human Services, National Institute of Dental and Craniofacial Research, National
Institutes of Health. (2000). Oral health in America: A report of the Surgeon General. Retrieved from http://www.nidcr.nih.
gov/DataStatistics/SurgeonGeneral/Documents/hck1ocv.@www.surgeon.fullrpt.pdf
15
Schnittker, J., & Bacak, V. (2014). e increasing predictive validity of self-rated health. PLoS ONE 9(1): e84933.
16
DeSalvo, K. B., Jones, T. M., Peabody, J., McDonald, J., Fihn, S., Fan, V., ... Muntner, P. (2009). Health care
expenditure prediction with a single item, self-rated health measure. Medical Care 47(4): 440–447.
17
Kasper, J. D., Freedman, V. A., & Spillman, B. (2014). Disability and care needs of older Americans by dementia status:
An analysis of the 2011 National Health and Aging Trends Study. Washington DC: U.S. Department of Health and
Human Services, Oce of the Assistant Secretary for Planning and Evaluation, Oce of Disability, Aging, and Long-
Term Care Policy. Retrieved from http://aspe.hhs.gov/daltcp/reports/2014/NHATS-DS.pdf
18
U.S. Department of Health & Human Services, Centers for Medicare & Medicaid Services. (2013). Nursing home
data compendium 2013 edition. Retrieved from: https://www.cms.gov/Medicare/Provider-Enrollment-and-Certication/
CerticationandComplianc/downloads/nursinghomedatacompendium_508.pdf

77
References
19
Emptage, N. P., Sturm, R., & Robinson, R. L. (2005). Depression and comorbid pain as predictors of disability,
employment, insurance status, and health care costs. Psychiatric Services, 56(4): 468–74.
20
Saczynski, J. S., Beiser, A., Seshadri, S., Auerbach, S., Wolf, P. A., & Au, R. (2010). Depressive symptoms and risk of
dementia: e Framingham Heart Study. Neurology, 75(1): 35–41.
21
Kim, D. K., Bridges, C. B., & Harriman, K. H., on behalf of the Advisory Committee on Immunization Practices.
(2015). Advisory committee on immunization practices recommended immunization schedule for adults aged 19 years or
older—United States, 2015. Annals of Internal Medicine 162(3): 214–223.
22
Centers for Disease Control and Prevention. (2015, August). What you should know and do this u season if you are
65 years and older. Retrieved December 14, 2015, from http://www.cdc.gov/u/about/disease/65over.htm
23
Centers for Disease Control and Prevention. (2014, September). What vaccines are recommended for you. Retrieved
December 14, 2015, from http://www.cdc.gov/vaccines/adults/rec-vac/index.html
24
U.S. Preventive Services Task Force. (2016, June). Final Update Summary: Colorectal Cancer: Screening. Retrieved from
http://www.uspreventiveservicestaskforce.org/Page/Document/UpdateSummaryFinal/colorectal-cancer-screening2
25
U.S. Preventive Services Task Force. (2016, January). Breast cancer: Screening. Retrieved from http://www.
uspreventiveservicestaskforce.org/Page/Document/UpdateSummaryFinal/breast-cancer-screening1?ds=1&s=breast%20
cancer
26
Federal Interagency Forum on Aging-Related Statistics (2012, June). Older Americans 2012: Key indicators of well-being.
Washington, DC: U.S. Government Printing Oce. Retrieved from http://www.agingstats.gov/main_site/data/2012_
documents/docs/entirechartbook.pdf
27
Reedy, J., Krebs-Smith, S. M., Miller, P. E., Liese, A. D., Kahle, L. L., Park, Y., & Subar, A. F. (2014, June). Higher
diet quality is associated with decreased risk of all-cause, cardiovascular disease, and cancer mortality among older adults.
Journal of Nutrition, 144(6): 881–889.
28
Schwingshackl, L., & Homann, G. (2015, May). Diet quality as assessed by the Healthy Eating Index, the Alternate
Healthy Eating Index, the Dietary Approaches to Stop Hypertension score, and health outcomes: A systematic review and
meta-analysis of cohort studies. Journal of the Academy of Nutrition and Dietetics, 115(5): 780–800.
29
Bernstein, M., & Munoz, N. (2012). Position of the Academy of Nutrition and Dietetics: Food and nutrition for older
adults: Promoting health and wellness. Journal of the Academy of Nutrition and Dietetics, 112(8): 1255–1277.
30
Anderson, A. L., Harris, T. B., Tylavsky, F. A., Perry, S. E., Houston, D. K., Hue, T. F., ... Sahyoun, N. R. (2011).
Dietary patterns and survival in older adults. Journal of the American Dietetic Association, 111(1): 84–91.
31
Guenther, P. M., Casavale, K. D., Reedy, J., Kirkpatrick, S. I., Hiza, H. A., Kuczynski, K. J., ... Krebs-Smith, S. M.
(2013). Update of the Healthy Eating Index: HEI-2010. Journal of the Academy of Nutrition and Dietetics, 113(4):
569–580. Retrieved from http://www.ncbi.nlm.nih.gov/pubmed/23415502
32
U.S. Department of Health and Human Services. (2008). Physical activity guidelines for Americans. Washington, DC:
U.S. Department of Health and Human Services. Retrieved from http://health.gov/paguidelines/guidelines/
33
American College of Sports Medicine, Chodzko-Zajko, W. J., Proctor, D. N., Fiatarone Singh, M. A., Minson, C. T.,
Nigg, C. R., Salem, G. J., & Skinner, J. S. (2009). American College of Sports Medicine position stand. Exercise and
physical activity for older adults. Medicine & Science in Sports & Exercise 41(7): 1510–1530.
34
Tse, M. M., Wan, V. T., & Ho, S. S. (2011). Physical exercise: Does it help in relieving pain and increasing mobility
among older adults with chronic pain? Journal of Clinical Nursing 20: 635–644.
35
Panel on Prevention of Falls in Older Persons, American Geriatrics Society and British Geriatrics Society. (2011).
Summary of the updated American Geriatrics Society/British Geriatrics Society clinical practice guideline for prevention
of falls in older persons. Journal of the American Geriatrics Society 59(1): 148–157.
36
U.S. Department of Health and Human Services, Public Health Service, Oce of the Surgeon General. (2001). e
Surgeon General’s call to action to prevent and decrease overweight and obesity. Retrieved from http://www.ncbi.nlm.nih.gov/
books/NBK44206

78
References
37
U.S. Preventive Services Task Force. (2003, November). Screening for obesity in adults: Recommendations and
rationale. Annals of Internal Medicine 139(11): 930–932. Retrieved from http://annals.org/article.aspx?articleid=1355696
38
Must, A., Spadano, J., Coakley, E. H., Field, A. E., Colditz, G., & Dietz, W. H. (1999, October). e disease burden
associated with overweight and obesity. e Journal of the American Medical Association 282(16): 1530–1538. Retrieved
from http://jama.jamanetwork.com/article.aspx?articleid=192030
39
Tobacco use. (2010, September). CDC Vital Signs. Retrieved from http://www.cdc.gov/vitalsigns/pdf/2010-09-
vitalsigns.pdf
40
Health Care Financing Administration. (1999). A prole of Medicare home health: Chartbook (Publication No. 1999-
771-472). Washington, DC: U.S. Government Printing Oce.
41
Altman, A., Cooper, P. F., & Cunningham, P. J. (1999). e case of disability in the family: Impact on health care
utilization and expenditures for nondisabled members. e Milbank Quarterly, 77(1), 39–75.
42
Rasell, E., Bernstein, J., & Tang, K. (1994). e impact of health care nancing on family budgets. International Journal
of Health Services, 24(4), 691–714.
43
U.S. Department of Health and Human Services. (n.d.). What is long-term care? Retrieved from http://longtermcare.
gov/the-basics/what-is-long-term-care
44
Harris-Kojetin, L., Sengupta, M., Park-Lee, E., Valverde, R., Carey, C., Rome, V., & Lendon, J. (2016). Long-term
care providers and services users in the United States: Data from the National Study of Long-Term Care Providers,
2013–2014. Vital and Health Statistics 3(38). Retrieved from http://www.cdc.gov/nchs/data/series/sr_03/sr03_038.pdf
45
Bureau of Labor Statistics, Current Population Survey. (2014). Employment and earnings online.
46
U.S. Environmental Protection Agency, Oce of Research and Development, National Center for Environmental
Assessment. (1996, July). Air quality criteria for ozone and related photochemical oxidants (EPA Report No.
600/P-93/004aF). Retrieved from http://nepis.epa.gov/
47
U.S. Environmental Protection Agency, Oce of Research and Development, Environmental Criteria and Assessment
Oce. (1993, August). Air quality criteria for oxides of nitrogen (EPA Report No. 600/8-91/049aF). Retrieved from
http://nepis.epa.gov/
48
U.S. Environmental Protection Agency, Oce Research and Development, National Center for Environmental
Assessment. (2000, July). Air quality criteria for carbon monoxide (EPA Report No. 600/P-99/001F). Retrieved from
http://cfpub.epa.gov/ncea/risk/recordisplay.cfm?deid=18163
49
U.S. Environmental Protection Agency, Oce of Research and Development, National Center for Environmental
Assessment. (2002, April). Air quality criteria for particulate matter, third external review draft, volume II (EPA Report No.
600/P-99/002aC). Retrieved from http://cfpub.epa.gov/ncea/risk/recordisplay.cfm?deid=29503&CFID=58108299&CF
TOKEN=39147464
50
Pope, C. A., III, Burnett, R. T., un, M. J., Calle, E. E., Krewski, D., Ito, K., & urston, G. D. (2002). Lung cancer,
cardiopulmonary mortality, and long-term exposure to ne particulate air pollution. e Journal of the American Medical
Association 287(9):1132–41.
51
Freedman, V. A., Spillman, B. C., Andreski, P. M., Cornman, J. C., Crimmins, E. M., Kramarow, E., ... Waidmann,
T.A. (2013). Trends in late-life activity limitations in the United States: An update from ve national surveys. Demography
50(2): 661–671.
52
Kaye, H., Harrington, C., & LaPlante, M. (2010). Long-term care: Who gets it, who provides it, who pays, and how
much? Health Aairs 29(1): 11–21.
53
Spillman, B. C. (2009). Analyses of informal caregiving 2004. Washington DC: U.S. Department of Health and Human
Services, Oce of the Assistant Secretary for Planning and Evaluation, Oce of Disability, Aging and Long-Term Care
Policy. Retrieved from https://aspe.hhs.gov/sites/default/les/pdf/77146/NHATS-IC.pdf
54
Spillman, B. C., & Black, K. (2005). Staying the course: Trends in family caregiving (Paper #2005-17). Retrieved from
AARP website: http://assets.aarp.org/rgcenter/il/2005_17_caregiving.pdf

79
References
55
Spillman, B. C. (2014). Why do elders receiving informal home care transition to long stay nursing home residency? Retrieved
from U.S. Department of Health and Human Services, Oce of the Assistant Secretary for Planning and Evaluation
website: http://aspe.hhs.gov/basic-report/why-do-elders-receiving-informal-home-care-transition-long-stay-nursing-
home-residency
56
U.S. Department of Agriculture and U.S. Department of Health and Human Services. (2010). Dietary guidelines for
Americans (7th ed.). Washington, DC: U.S. Government Printing Oce. Retrieved from http://www.cnpp.usda.gov/
dietaryguidelines.htm
57
Freedman, L. S., Guenther, P. M., Krebs-Smith, S. M., & Kott, P. S. (2008). A population’s mean Healthy Eating
Index-2005 scores are best estimated by the score of the population ratio when one 24-hour recall is available. Journal of
Nutrition, 138
(9): 1725–1729.
58
Zuvekas, S., & Cohen, J. W. (2002). A guide to comparing health care expenditures in the 1996 MEPS to the 1987
NMES. Inquiry 39(1): 76–86. Retrieved from http://www.ncbi.nlm.nih.gov/pubmed/12067078
59
Explanatory notes and estimates of error. Employment and Earnings 51(1):269–86. U.S. Department of Labor, Bureau
of Labor Statistics. January 2004.
60
Cohen, J. W., & Taylor, A. K. (1999). e provider system and the changing locus of expenditure data: Survey
strategies from fee-for-service to managed care. In: A. C. Monheit, R. Wilson, R.H. Arnett III (Eds.), Informing American
health care policy: e dynamics of medical expenditures and insurance surveys, 1977–1996 (pp.43–66). San Francisco, CA:
Jossey-Bass Publishers.
61
Population estimates for cities and towns and estimates of housing units are covered in a separate document.
62
For more information on the accuracy of the population estimates, see http://www.census.gov/population/www/
documentation/twps0100/E2%20County%20Totals_FINAL.pdf.
63
Domestic migration sums to 0 at the national level and therefore has no eect on the estimates.
64
Citro, C. F., & Michael, R. T. (Eds.). (1995). Measuring poverty: A new approach. Washington DC: National Academy
Press.
65
Interagency Technical Working Group. (2010, March). Observations From the Interagency Technical Working Group
on developing a Supplemental Poverty Measure. Retrieved from https://www.census.gov/hhes/povmeas/methodology/
supplementalresearch/SPM_TWGObservations.pdf.
66
Short, K. (2015, September). e Supplemental Poverty Measure: 2014 (Current Population Report P60-254). Retrieved
from U.S. Census Bureau website: http://www.census.gov/content/dam/Census/library/publications/2015/demo/p60-
254.pdf.
67
Data les can be downloaded from http://www.census.gov/hhes/povmeas/data/supplemental/public-use.html.
68
Cagetti, M., & DeNardi, M. (2008). Wealth inequality: data and models. Macroeconomic Dynamics, 12, 285–313.
69
Meijer, E., Karoly, L., & Michaud, P. C. (2010). Using Matched Survey and Administrative Data to Estimate Eligibility
for the Medicare Part D Low-Income Subsidy Program. Social Security Bulletin, 70(2), 63–82.
70
Bucks, B. K., Kennickell, A. B., March, T. L., & Moore, K.B. (2009, February). Changes in U.S. Family Finances
from 2004 to 2007: Evidence from the Survey of Consumer Finances. Federal Reserve Bulletin, pp. A1–A56.
71
U.S. Department of Health and Human Services, National Heart, Lung, and Blood Institute. (1998). Clinical
guidelines on the identification, evaluation, and treatment of overweight and obesity in adults (NIH Publication No. 98-
4083). Retrieved from http://www.ncbi.nlm.nih.gov/books/NBK2003/pdf/Bookshelf_NBK2003.pdf
72
WHO. International statistical classication of diseases and related health problems, tenth revision (ICD-10). 2008 ed.
Geneva, Switzerland. 2009.
73
U.S. Census Bureau. Poverty definition, thresholds and guidelines. Retrieved from http://www.census.gov/hhes/www/
poverty/methods/denitions.html.

80

Tables

82
Tables
INDICATOR 1: Number of Older Americans
Table 1a. Number of people (in millions) age 65 and over and age 85 and over, selected years, 1900–2014, and projected years,
2020–2060
Year 65 and over 85 and over
Estimates
1900 3.1 0.1
1910 3.9 0.2
1920 4.9 0.2
1930 6.6 0.3
1940 9.0 0.4
1950 12.3 0.6
1960 16.2 0.9
1970 20.1 1.5
1980 25.5 2.2
1990 31.2 3.1
2000 35.0 4.2
2005 36.7 4.7
2010 40.3 5.5
2014 46.2 6.2
Projections
2020 56.4 6.7
2030 74.1 9.1
2040 82.3 14.6
2050 88.0 19.0
2060 98.2 19.7
NOTE: Some data for 2020–2050 have been revised and differ from previous editions of
Older Americans.
Reference population: These data refer to the resident population.
SOURCE: U.S. Census Bureau, 1900 to 1940, 1970, and 1980, U.S. Census Bureau, 1983, Table 42; 1950, U.S. Census Bureau, 1953, Table 38; 1960, U.S. Census Bureau,
1964, Table 155; 1990, U.S. Census Bureau, 1991, 1990 Summary Table File; 2000, U.S. Census Bureau, 2001,
Census 2000 Summary File 1;
U.S. Census Bureau, Table 1:
Intercensal Estimates of the Resident Population by Sex and Age for the U.S.: April 1, 2000, to July 1, 2010 (US-EST00INT-01); U.S. Census Bureau, 2011.
2010 Census
Summary File 1;
U.S. Census Bureau, Annual Estimates of the Resident Population for Selected Age Groups by Sex for the United States, States, Counties, and Puerto
Rico Commonwealth and Municipios: April 1, 2010, to July 1, 2014 (PEPAGESEX); U.S. Census Bureau, Table 3: Projections of the Population by Sex and Selected Age
Groups for the United States: 2015 to 2060 (NP2014-T3).

83
Tables
INDICATOR 1: Number of Older Americans
Table 1b. Percentage of people age 65 and over and age 85 and over, selected years, 1900–2014, and projected years, 2020–2060
Year 65 and over 85 and over
Estimates
1900 4.1 0.2
1910 4.3 0.2
1920 4.7 0.2
1930 5.4 0.2
1940 6.8 0.3
1950 8.1 0.4
1960 9.0 0.5
1970 9.9 0.7
1980 11.3 1.0
1990 12.6 1.2
2000 12.4 1.5
2005 12.4 1.6
2010 13.0 1.8
2014 14.5 1.9
Projections
2020 16.9 2.0
2030 20.6 2.5
2040 21.7 3.9
2050 22.1 4.8
2060 23.6 4.7
NOTE: Some data for 2020–2050 have been revised and differ from previous editions of
Older Americans.
Reference population: These data refer to the resident population.
SOURCE: U.S. Census Bureau, 1900 to 1940, 1970, and 1980, U.S. Census Bureau, 1983, Table 42; 1950, U.S. Census Bureau, 1953, Table 38; 1960, U.S. Census Bureau,
1964, Table 155; 1990, U.S. Census Bureau, 1991, 1990 Summary Table File; 2000, U.S. Census Bureau, 2001,
Census 2000 Summary File 1;
U.S. Census Bureau, Table 1:
Intercensal Estimates of the Resident Population by Sex and Age for the U.S.: April 1, 2000, to July 1, 2010 (US-EST00INT-01); U.S. Census Bureau, 2011.
2010 Census
Summary File 1;
U.S. Census Bureau, Annual Estimates of the Resident Population for Selected Age Groups by Sex for the United States, States, Counties, and Puerto
Rico Commonwealth and Municipios: April 1, 2010, to July 1, 2014 (PEPAGESEX); U.S. Census Bureau, Table 3: Projections of the Population by Sex and Selected Age
Groups for the United States: 2015 to 2060 (NP2014-T3).

84
Tables
INDICATOR 1: Number of Older Americans
Table 1c. Population of countries or areas with at least 10 percent of their population age 65 and over, 2015
Country or area
Population (number in thousands) Percent
Total 65 and over 65 and over
Japan 126,920 33,750 26.6
Germany 80,854 17,346 21.5
Italy 61,855 13,110 21.2
Greece 10,776 2,204 20.5
Finland 5,477 1,107 20.2
Sweden 9,802 1,959 20.0
Lithuania 2,884 552 19.1
Estonia 1,265 242 19.1
Latvia 1,987 377 19.0
Austria 8,666 1,639 18.9
Portugal 10,825 2,045 18.9
France 66,554 12,472 18.7
Bulgaria 7,187 1,345 18.7
Denmark 5,582 1,043 18.7
Slovenia 1,983 365 18.4
Hungary 9,898 1,805 18.2
Belgium 11,324 2,065 18.2
Croatia 4,465 814 18.2
Czech Republic 10,645 1,917 18.0
Netherlands 16,948 3,046 18.0
Switzerland 8,122 1,443 17.8
Spain 48,146 8,546 17.7
United Kingdom 64,088 11,366 17.7
Canada 35,100 6,223 17.7
Serbia 7,177 1,264 17.6
Puerto Rico 3,598 630 17.5
Norway 5,208 850 16.3
Ukraine 44,429 7,019 15.8
Romania 21,666 3,408 15.7
Poland 38,562 6,044 15.7
Georgia 4,931 766 15.5
Australia 22,751 3,520 15.5
Hong Kong 7,141 1,096 15.3
United States 321,369 47,830 14.9
New Zealand 4,438 649 14.6
Belarus 9,590 1,385 14.4
Slovakia 5,445 782 14.4
Uruguay 3,342 469 14.0
Bosnia and Herzegovina 3,867 528 13.7
Russia 142,424 19,384 13.6
Korea, South 49,115 6,395 13.0
Cuba 11,031 1,428 12.9
Macedonia 2,096 267 12.7
Ireland 4,892 617 12.6
Taiwan 23,415 2,922 12.5
Moldova 3,547 414 11.7
Argentina 43,432 5,018 11.6
Cyprus 1,189 137 11.5
See notes at end of table.

85
Tables
INDICATOR 1: Number of Older Americans
Table 1c. Population of countries or areas with at least 10 percent of their population age 65 and over, 2015—continued
Country or area
Population (number in thousands) Percent
Total 65 and over 65 and over
Albania 3,029 342 11.3
Israel 8,049 873 10.8
Armenia 3,056 327 10.7
Chile 17,508 1,789 10.2
China 1,367,485 136,890 10.0
NOTE: Table excludes countries and areas with less than 1,000,000 total population.
SOURCE: U.S. Census Bureau, International Data Base, accessed on October 1, 2015.

86
Tables
INDICATOR 1: Number of Older Americans
Table 1d. Percentage of the population age 65 and over, by state, 2014
State (listed alphabetically) Percent State (ranked by percentage) Percent
United States 14.5 United States 14.5
Alabama 15.3 Florida 19.1
Alaska 9.4 Maine 18.3
Arizona 15.9 West Virginia 17.8
Arkansas 15.7 Vermont 16.9
California 12.9 Montana 16.7
Colorado 12.7 Pennsylvania 16.7
Connecticut 15.5 Delaware 16.4
Delaware 16.4 Hawaii 16.1
District of Columbia 11.3 Oregon 16.0
Florida 19.1 New Hampshire 15.9
Georgia 12.4 Arizona 15.9
Hawaii 16.1 Iowa 15.8
Idaho 14.3 South Carolina 15.8
Illinois 13.9 Rhode Island 15.7
Indiana 14.3 Arkansas 15.7
Iowa 15.8 Ohio 15.5
Kansas 14.3 Connecticut 15.5
Kentucky 14.8 Michigan 15.4
Louisiana 13.6 Missouri 15.4
Maine 18.3 Alabama 15.3
Maryland 13.8 New Mexico 15.3
Massachusetts 15.1 South Dakota 15.3
Michigan 15.4 Wisconsin 15.2
Minnesota 14.3 Massachusetts 15.1
Mississippi 14.3 Tennessee 15.1
Missouri 15.4 Kentucky 14.8
Montana 16.7 North Carolina 14.7
Nebraska 14.4 New Jersey 14.7
Nevada 14.2 New York 14.7
New Hampshire 15.9 Oklahoma 14.5
New Jersey 14.7 Nebraska 14.4
New Mexico 15.3
Mississippi 14.3
New York 14.7 Kansas 14.3
North Carolina 14.7 Minnesota 14.3
North Dakota 14.2 Idaho 14.3
Ohio 15.5 Indiana 14.3
Oklahoma 14.5 North Dakota 14.2
Oregon 16.0 Nevada 14.2
See notes at end of table.

87
Tables
INDICATOR 1: Number of Older Americans
Table 1d. Percentage of the population age 65 and over, by state, 2014—continued
State (listed alphabetically) Percent State (ranked by percentage) Percent
Pennsylvania 16.7 Washington 14.1
Rhode Island 15.7 Wyoming 14.0
South Carolina 15.8 Illinois 13.9
South Dakota 15.3 Virginia 13.8
Tennessee 15.1 Maryland 13.8
Texas 11.5 Louisiana 13.6
Utah 10.0 California 12.9
Vermont 16.9 Colorado 12.7
Virginia 13.8 Georgia 12.4
Washington 14.1 Texas 11.5
West Virginia 17.8 District of Columbia 11.3
Wisconsin 15.2 Utah 10.0
Wyoming 14.0 Alaska 9.4
Puerto Rico 17.4 Puerto Rico 17.4
NOTE: Puerto Rico is not included in the U.S. average.
Reference population: These data refer to the resident population.
SOURCE: U.S. Census Bureau, Annual Estimates of the Resident Population for Selected Age Groups by Sex for the United States, States, Counties, and Puerto Rico
Commonwealth and Municipios: April 1, 2010, to July 1, 2014 (PEPAGESEX).
Table 1e. Percentage of the population age 65 and over, by county, 2014
Reference population: These data refer to the resident population.
SOURCE: U.S. Census Bureau, Annual Estimates of the Resident Population for Selected Age Groups by Sex for the United States, States, Counties, and Puerto Rico
Commonwealth and Municipios: April 1, 2010, to July 1, 2014 (PEPAGESEX).
Data for this table can be found at http://www.agingstats.gov.
Table 1f. Number and percentage of people age 65 and over and age 85 and over, by sex, 2014
Age and sex Number (in thousands) Percent
65 and over 46,243 100.0
Men 20,351 44.0
Women 25,892 56.0
85 and over 6,162 100.0
Men 2,109 34.2
Women 4,053 65.8
Reference population: These data refer to the resident population.
SOURCE: U.S. Census Bureau, Annual Estimates of the Resident Population for Selected Age Groups by Sex for the United States, States, Counties, and Puerto Rico
Commonwealth and Municipios: April 1, 2010 to July 1, 2014 (PEPAGESEX).

88
Tables
INDICATOR 2: Racial and Ethnic Composition
Table 2. Population age 65 and over, by race and Hispanic origin, 2014 and projected 2060
Race and Hispanic or Latino origin
2014 2060 projections
Number (in thousands) Percent Number (in thousands) Percent
Total 46,243 100.0 98,164 100.0
Non-Hispanic or Latino
White alone 36,208 78.3 53,566 54.6
Black alone 4,017 8.7 11,954 12.2
Asian alone 1,869 4.0 8,491 8.7
All other races alone or in combination 598 1.3 2,644 2.7
Hispanic or Latino (any race) 3,551 7.7 21,508 21.9
NOTE: The presentation of racial and ethnic composition data in this table has changed from previous editions of
Older Americans.
Unlike in previous editions,
Hispanics are not counted in any race group. The term “non-Hispanic White alone” is used to refer to people who reported being White and no other race and who
are not Hispanic. The term “non-Hispanic Black alone” is used to refer to people who reported being Black or African American and no other race and who are not
Hispanic, and the term “non-Hispanic Asian alone” is used to refer to people who reported only Asian as their race and who are not Hispanic. The use of single-race
populations in this table does not imply that this is the preferred method of presenting or analyzing data. The U.S. Census Bureau uses a variety of approaches. The
race group “non-Hispanic All other races alone or in combination” includes people who reported American Indian and Alaska Native alone who are not Hispanic;
people who reported Native Hawaiian and Other Pacic Islander alone who are not Hispanic; and all people who reported two or more races who are not Hispanic.
“Hispanic” refers to an ethnic category; Hispanics may be of any race.
Reference population: These data refer to the resident population.
SOURCE: U.S. Census Bureau, Annual Estimates of the Resident Population by Sex, Age, Race, and Hispanic Origin for the United States and States: April 1, 2010, to
July 1, 2014 (PEPASR6H); U.S. Census Bureau, Table 1. Projected Population by Single Year of Age, Sex, Race, and Hispanic Origin for the United States: 2014 to 2060
(NP2014_D1).
INDICATOR 3: Marital Status
Table 3. Marital status of the population age 65 and over, by age group and sex, 2015
Sex and marital status 65 and over 65–74 75–84 85 and over
Total 100.0 100.0 100.0 100.0
Married 58.6 65.4 56.0 32.1
Widowed 24.4 13.9 31.0 59.3
Divorced 12.2 15.1 9.3 5.2
Never married 4.8 5.6 3.7 3.5
Men 100.0 100.0 100.0 100.0
Married 72.4 73.9 73.8 58.6
Widowed 11.9 6.8 15.6 33.9
Divorced 10.8 13.4 7.5 4.3
Never married 4.9 5.9 3.2 3.3
Women 100.0 100.0 100.0 100.0
Married 47.6 57.9 42.2 17.4
Widowed 34.3 20.1 42.9 73.3
Divorced 13.3 16.6 10.8 5.6
Never married 4.8 5.4 4.1 3.7
NOTE: Married includes married, spouse present; married, spouse absent; and separated.
Reference population: These data refer to the civilian noninstitutionalized population.
SOURCE: U.S. Census Bureau, Current Population Survey, Annual Social and Economic Supplement.

89
Tables
INDICATOR 4: Educational Attainment
Table 4a. Educational attainment of the population age 65 and over, selected years 1965–2015
Educational attainment 1965 1970 1975 1980 1985 1990 1995 2000 2001 2002 2003 2004
Percent
High school graduate or more 23.5 28.3 37.3 40.7 48.2 55.4 63.8 69.5 70.0 69.9 71.5 73.1
Bachelor’s degree or more 5.0 6.3 8.1 8.6 9.4 11.6 13.0 15.6 16.2 16.7 17.4 18.7
2005 2006 2007 2008 2009 2010 2011 2012 2013 2014 2015
High school graduate or more 74.0 75.2 76.1 77.4 78.3 79.5 80.7 81.1 82.6 83.7 84.3
Bachelor’s degree or more 18.9 19.5 19.2 20.5 21.7 22.5 23.2 24.3 25.3 26.3 26.7
NOTE: A single question that asks for the highest grade or degree completed is used to determine educational attainment. Prior to 1995, educational attainment was
measured using data on years of school completed.
Reference population: These data refer to the civilian noninstitutionalized population.
SOURCE: U.S. Census Bureau, Current Population Survey, Annual Social and Economic Supplement.
Table 4b. Educational attainment of the population age 65 and over, by sex and race and Hispanic origin, 2015
Sex and race and Hispanic origin High school graduate or more Bachelor's degree or more
Percent
Total 84.3 26.7
Sex
Men 85.5 31.8
Women 83.4 22.5
Race and Hispanic origin
Non-Hispanic White alone 89.1 28.9
Black alone 74.8 17.5
Asian alone 74.4 34.0
Hispanic (any race) 54.2 11.5
NOTE: The term “non-Hispanic White alone” is used to refer to people who reported being White and no other race and who are not Hispanic. The term “Black alone”
is used to refer to people who reported being Black or African American and no other race, and the term “Asian alone” is used to refer to people who reported only
Asian as their race. The use of single-race populations in this table does not imply that this is the preferred method of presenting or analyzing data. The U.S. Census
Bureau uses a variety of approaches.
Reference population: These data refer to the civilian noninstitutionalized population.
SOURCE: U.S. Census Bureau, Current Population Survey, Annual Social and Economic Supplement.

90
Tables
INDICATOR 5: Living Arrangements
Table 5a. Living arrangements of the population age 65 and over, by sex and race and Hispanic origin, 2015
Sex and race and Hispanic origin Total With spouse With other relatives With nonrelatives Alone
Percent
Men 100.0 70.0 6.0 3.7 20.2
Non-Hispanic White alone 100.0 72.0 4.4 3.3 20.3
Black alone 100.0 50.0 13.7 6.3 29.9
Asian alone 100.0 78.2 9.5 2.8 9.5
Hispanic (any race) 100.0 66.6 12.8 5.2 15.4
Women 100.0 45.2 16.4 2.6 35.8
Non-Hispanic White alone 100.0 47.9 12.2 2.6 37.2
Black alone 100.0 24.4 30.2 2.1 43.3
Asian alone 100.0 52.2 26.0 1.4 20.4
Hispanic (any race) 100.0 39.7 34.4 3.2 22.8
NOTE: Living with other relatives indicates no spouse present. Living with nonrelatives indicates no spouse or other relatives present. The term “non-Hispanic White
alone” is used to refer to people who reported being White and no other race and who are not Hispanic. The term “Black alone” is used to refer to people who
reported being Black or African American and no other race, and the term “Asian alone” is used to refer to people who reported only Asian as their race. The use
of single-race populations in this table does not imply that this is the preferred method of presenting or analyzing data. The U.S. Census Bureau uses a variety of
approaches. Totals may not sum to 100 percent because of rounding.
Reference population: These data refer to the civilian noninstitutionalized population.
SOURCE: U.S. Census Bureau, Current Population Survey, Annual Social and Economic Supplement.
Table 5b. Percentage of population age 65 and over living alone, by sex and age group, selected years, 1970–2015
Year
Men Women
65–74 75 and over 65–74 75 and over
1970 11.3 19.1 31.7 37.0
1980 11.6 21.6 35.6 49.4
1990 13.0 20.9 33.2 54.0
2000 13.8 21.4 30.6 49.5
2003 15.6 22.9 29.6 49.8
2004 15.5 23.2 29.4 49.9
2005 16.1 23.2 28.9 47.8
2006 16.9 22.7 28.5 48.0
2007 16.7 22.0 28.0 48.8
2008 16.3 21.5 29.1 50.1
2009 — — — —
2010 16.4 22.6 27.7 47.4
2011 16.3 22.2 27.7 46.5
2012 16.7 22.2 27.2 46.3
2013 16.3 23.0 27.0 45.0
2014 17.1 22.6 26.9 46.0
2015 18.5 23.0 27.7 46.3
— Not available.
Reference population: These data refer to the civilian noninstitutionalized population.
Source: U.S. Census Bureau, Current Population Survey, Annual Social and Economic Supplement.

91
Tables
INDICATOR 6: Older Veterans
Table 6a. Percentage of population age 65 and over who are veterans, by age group and sex, 2000, 2010, and 2015, and projected 2020
and 2025
Year
65 and over 65–74 75–84 85 and over
Men Women Men Women Men Women Men Women
Estimates
2000 64.3 1.7 65.2 1.1 70.9 2.7 32.6 1.0
2010 51.3 1.3 42.8 1.1 60.8 1.1 68.3 2.5
2015 45.4 1.3 40.0 1.3 49.3 1.1 66.2 1.7
Projections
2020 35.6 1.5 28.5 1.7 42.3 1.1 60.6 1.4
2025 28.1 1.7 17.7 2.0 40.5 1.3 50.0 1.2
NOTE: Some data for 2020 have been revised and differ from previous editions o
f Older Americans.
Reference population: These data refer to the resident population of the United States and Puerto Rico.
SOURCE: U.S. Census Bureau, Population Projections 2014, and
2010 Census Summary File 1;
Department of Veterans Affairs, VetPop2014.
Table 6b. Number of veterans age 65 and over, by age group and sex, 2000, 2010, and 2015, and projected 2020 and 2025
Age group and sex
Estimates Projections
2000 2010 2015 2020 2025
Number (in thousands)
65 and over 9,723 9,169 9,934 9,428 8,924
Men 9,374 8,866 9,591 8,976 8,316
Women 349 303 343 452 609
65–74 5,628 4,377 5,360 4,696 3,478
Men 5,516 4,253 5,174 4,405 3,079
Women 112 124 186 291 398
75–84 3,667 3,403 3,060 3,199 3,990
Men 3,460 3,321 2,972 3,097 3,836
Women 207 82 88 102 154
85 and over 427 1,389 1,513 1,533 1,457
Men 398 1,292 1,444 1,474 1,401
Women 30 97 69 59 56
NOTE: Some data for 2020 have been revised and differ from previous editions of
Older Americans.
Estimates may not sum to the totals because of rounding.
Reference population: These data refer to the resident population of the United States and Puerto Rico.
SOURCE: U.S. Census Bureau,
Population Projections 2014, and
2010 Census Summary File 1;
Department of Veterans Affairs, VetPop2014.

92
Tables
INDICATOR 7: Poverty
Table 7a. Poverty rate by age, by ofcial poverty measure and Supplemental Poverty Measure, 1966–2014
Year Under 18 18–64
65 and over
Total 65–74 75–84 85 and over
1966 17.6 10.5 28.5 — — —
1967 16.6 10.0 29.5 — — —
1968 15.6 9.0 25.0 — — —
1969 14.0 8.7 25.3 — — —
1970 15.1 9.0 24.6 — — —
1971 15.3 9.3 21.6 — — —
1972 15.1 8.8 18.6 — — —
1973 14.4 8.3 16.3 — — —
1974 15.4 8.3 14.6 — — —
1975 17.1 9.2 15.3 — — —
1976 16.0 9.0 15.0 — — —
1977 16.2 8.8 14.1 — — —
1978 15.9 8.7 14.0 — — —
1979 16.4 8.9 15.2 — — —
1980 18.3 10.1 15.7 — — —
1981 20.0 11.1 15.3 — — —
1982 21.9 12.0 14.6 12.4 17.4 21.2
1983 22.3 12.4 13.8 11.9 16.7 21.3
1984 21.5 11.7 12.4 10.3 15.2 18.4
1985 20.7 11.3 12.6 10.6 15.3 18.7
1986 20.5 10.8 12.4 10.3 15.3 17.6
1987 20.3 10.6 12.5 9.9 16.0 18.9
1988 19.5 10.5 12.0 10.0 14.6 17.8
1989 19.6 10.2 11.4 8.8 14.6 18.4
1990 20.6 10.7 12.2 9.7 14.9 20.2
1991 21.8 11.4 12.4 10.6 14.0 18.9
1992 22.3 11.9 12.9 10.6 15.2 19.9
1993 22.7 12.4 12.2 10.0 14.1 19.7
1994 21.8 11.9 11.7 10.1 12.8 18.0
1995 20.8 11.4 10.5 8.6 12.3 15.7
1996 20.5 11.4 10.8 8.8 12.5 16.5
1997 19.9 10.9 10.5 9.2 11.3 15.7
1998 18.9 10.5 10.5 9.1 11.6 14.2
1999 17.1 10.1 9.7 8.8 9.8 14.2
2000 16.2 9.6 9.9 8.6 10.6 14.5
2001 16.3 10.1 10.1 9.2 10.4 13.9
2002 16.7 10.6 10.4 9.4 11.1 13.6
2003
17.6 10.8 10.2 9.0 11.0 13.8
2004 17.8 11.3 9.8 9.4 9.7 12.6
2005 17.6 11.1 10.1 8.9 10.9 13.4
2006 17.4 10.8 9.4 8.6 10.0 11.4
2007 18.0 10.9 9.7 8.8 9.8 13.0
2008 19.0 11.7 9.7 8.4 10.7 12.7
2009 20.7 12.9 8.9 8.0 9.4 11.6
2010 22.0 13.8 8.9 8.1 9.2 12.2
See notes at end of table.

93
Tables
INDICATOR 7: Poverty
Table 7a. Poverty rate by age, by ofcial poverty measure and Supplemental Poverty Measure, 1966–2014—continued
Year Under 18 18–64
65 and over
Total 65–74 75–84 85 and over
2011 21.9 13.7 8.7 7.4 10.0 11.5
2012 21.8 13.7 9.1 7.9 9.9 12.3
2013 (traditional) 19.9 13.6 9.5 8.3 10.9 11.8
2013 (redesign) 21.5 13.3 10.2 8.8 11.1 14.2
2014 21.1 13.5 10.0 8.7 11.3 12.7
Supplemental Poverty Peasure
2009 17.0 14.4 14.9 12.6 17.0 19.1
2010 17.9 15.2 15.8 13.3 17.7 21.8
2011 18.0 15.5 15.1 12.7 17.6 19.2
2012 18.0 15.5 14.8 12.3 17.1 20.9
2013 (traditional) 16.4 15.4 14.6 12.1 17.3 20.1
2013 (redesign) 18.1 14.9 15.5 13.5 17.0 22.0
2014 16.7 15.0 14.4 12.5 16.2 19.6
— Data not available.
NOTE: Poverty status in the Current Population Survey (CPS) is based on prior year income. The 2014 CPS Annual Social and Economic Supplement (ASEC) included
redesigned questions for income that were implemented to a subsample of the 98,000 addresses using a probability split panel design. The source for “2013 (traditional)” in
this table is the portion of the sample (68,000) which received a set of income questions similar to those used in 2013; the source for “2013 (redesign)” is the portion of the
2014 CPS ASEC sample (30,000) which received the redesigned income questions. The redesigned income questions were used for the entire 2015 CPS ASEC sample. The
ofcial poverty measure is based on money income and does not include noncash benets such as food stamps. Poverty thresholds reect family size and composition and
are adjusted each year using the annual average Consumer Price Index. The Supplemental Poverty Measure (SPM) extends the ofcial poverty measure by taking account
of many of the government programs designed to assist low income families and individuals that are not included in the current ofcial poverty measure and by using
thresholds derived from the Consumer Expenditure Survey by the Bureau of Labor Statistics. For more detail, see U.S. Census Bureau Series P-60, No. 252. Additional years
of data are available at agingstats.gov.
Reference population: These data refer to the civilian noninstitutionalized population.
SOURCE: U.S. Census Bureau, Current Population Survey, Annual Social and Economic Supplement.
Table 7b. Percentage of the population age 65 and over living in poverty, by selected characteristics, 2014
Selected characteristic
65 and over
65–74 75 and overTotal Living alone Married couples
Both Sexes
Total 10.0 18.0 5.0 8.7 11.7
Non-Hispanic White alone 7.8 14.8 3.8 6.4 9.7
Black alone 19.2 28.4 7.5 19.0 19.6
Asian alone 14.7 34.6 10.5 14.0 15.8
Hispanic (any race) 18.1 32.9 12.7 16.1 21.3
Male
Total 7.4 13.6 5.1 7.2 7.6
Non-Hispanic White alone 5.3 10.4 3.7 4.9 5.8
Black alone 16.7 25.4 8.5 17.9 14.3
Asian alone 13.1 29.5 11.0 13.0 13.4
Hispanic (any race) 16.2 26.2 13.2 15.8 16.8
Female
Total 12.1 20.2 4.9 10.1 14.7
Non-Hispanic White alone 9.9 17.0 3.9 7.8 12.6
Black alone 20.9 30.0 6.3 19.8 22.6
Asian alone 16.0 37.0 9.9 14.9 17.7
Hispanic (any race) 19.6 36.8 12.2 16.3 24.5
NOTE: The poverty level is based on money income and does not include noncash benets such as food stamps. Poverty thresholds reect family size and composition and
are adjusted each year using the annual average Consumer Price Index. For more detail, see U.S. Census Bureau, Series P-60, No. 252. The term “non-Hispanic White alone”
is used to refer to people who reported being White and no other race and who are not Hispanic. The term “Black alone” is used to refer to people who reported being
Black or African American and no other race, and the term “Asian alone” is used to refer to people who reported only Asian as their race. The use of single-race populations
in this table does not imply that this is the preferred method of presenting or analyzing data. The U.S. Census Bureau uses a variety of approaches.
Reference population: These data refer to the civilian noninstitutionalized population.
SOURCE: U.S. Census Bureau, Current Population Survey, Annual Social and Economic Supplement.

94
Tables
INDICATOR 8: Income
Table 8a. Income distribution of the population age 65 and over, 1974–2014
Year Poverty Low income Middle income High income
1974 14.6 34.6 32.6 18.2
1975 15.3 35.0 32.3 17.4
1976 15.0 34.7 31.8 18.5
1977 14.1 35.9 31.5 18.5
1978 14.0 33.4 34.2 18.5
1979 15.2 33.0 33.6 18.2
1980 15.7 33.5 32.4 18.4
1981 15.3 32.8 33.1 18.9
1982 14.6 31.4 33.3 20.7
1983 13.8 29.7 34.1 22.4
1984 12.4 30.2 33.8 23.6
1985 12.6 29.4 34.6 23.4
1986 12.4 28.4 34.4 24.8
1987 12.5 27.8 35.1 24.7
1988 12.0 28.4 34.5 25.1
1989 11.4 29.1 33.6 25.9
1990 12.2 27.0 35.2 25.6
1991 12.4 28.0 36.3 23.3
1992 12.9 28.6 35.6 22.9
1993 12.2 29.8 35.0 23.0
1994 11.7 29.5 35.6 23.2
1995 10.5 29.1 36.1 24.3
1996 10.8 29.5 34.7 25.1
1997 10.5 28.1 35.3 26.0
1998 10.5 26.8 35.3 27.5
1999 9.7 26.2 36.4
27.7
2000 9.9 27.5 35.5 27.1
2001 10.1 28.1 35.2 26.7
2002 10.4 28.0 35.3 26.2
2003 10.2 28.5 33.8 27.5
2004 9.8 28.1 34.6 27.5
2005 10.1 26.6 35.2 28.1
2006 9.4 26.2 35.7 28.6
2007 9.8 26.3 33.3 30.6
2008 9.7 26.5 33.7 30.1
2009 8.9 24.8 35.1 31.2
2010 8.9 25.6 34.0 31.5
2011 8.7 24.9 34.2 32.2
2012 9.1 24.6 33.7 32.6
2013 (traditional) 9.5 23.6 33.0 33.8
2013 (redesign) 10.2 22.1 30.9 36.8
2014 10.0 22.5 31.1 36.4
NOTE: Income distribution in the Current Population Survey (CPS) is based on prior year income. The 2014 CPS Annual Social and Economic Supplement (ASEC)
included redesigned questions for income that were implemented to a subsample of the 98,000 addresses using a probability split panel design. The source for
“2013 (traditional)” in this table is the portion of the sample (68,000 addresses) that received a set of income questions similar to those used in 2013; the source for
“2013 (redesign)” is the portion of the 2014 CPS ASEC sample (30,000 addresses) that received the redesigned income questions. The redesigned income questions
were used for the entire 2015 CPS ASEC sample. The income categories are derived from the ratio of the family’s income (or an unrelated individual’s income) to the
corresponding ofcial poverty threshold. Being in poverty is measured as income less than 100 percent of the poverty threshold. Low income is between 100 and 199
percent of the poverty threshold. Middle income is between 200 percent and 399 percent of the poverty threshold. High income is 400 percent or more of the poverty
threshold. Some data have been revised and differ from previous versions of
Older Americans.
Reference population: These data refer to the civilian noninstitutionalized population.
SOURCE: U.S. Census Bureau, Current Population Survey, Annual Social and Economic Supplement.

95
Tables
INDICATOR 8: Income
Table 8b. Median income of householders age 65 and over, in current and in 2014 dollars, 1974–2014
Year Number (in thousands) Current dollars 2014 dollars
1974 14,263 $5,292 $22,921
1975 14,802 5,585 22,353
1976 14,816 5,962 22,563
1977 15,225 6,347 22,595
1978 15,795 7,081 23,590
1979 16,544 7,879 23,975
1980 16,912 8,781 24,029
1981 17,312 9,903 24,743
1982 17,671 11,041 26,017
1983 17,901 11,718 26,499
1984 18,155 12,799 27,787
1985 18,596 13,254 27,820
1986 18,998 13,845 28,544
1987 19,412 14,443 28,803
1988 19,716 14,923 28,707
1989 20,156 15,771 29,084
1990 20,527 16,855 29,622
1991 20,921 16,975 28,785
1992 20,682 17,135 28,338
1993 20,806 17,751 28,649
1994 21,365 18,095 28,607
1995 21,486 19,096 29,479
1996 21,408 19,448 29,231
1997 21,497 20,761 30,544
1998 21,589 21,729 31,542
1999 22,478 22,797 32,402
2000 22,469 23,083 31,732
2001 22,476 23,118 30,913
2002 22,659 23,152 30,466
2003 23,048 23,787 30,618
2004 23,151 24,516 30,727
2005 23,459 26,036 31,563
2006 23,729
27,798 32,641
2007 24,113 28,305 32,319
2008 24,834 29,744 32,706
2009 25,270 31,354 34,597
2010 25,737 31,461 34,162
2011 26,843 33,118 34,862
2012 27,924 33,848 34,902
2013 (traditional) 28,729 35,611 36,194
2013 (redesign) 29,069 37,297 37,907
2014 29,946 36,895 36,895
NOTE: Income distribution in the Current Population Survey (CPS) is based on prior year income. The 2014 CPS Annual Social and Economic Supplement (ASEC)
included redesigned questions for income that were implemented to a subsample of the 98,000 addresses using a probability split panel design. The source for “2013
(traditional)” in this table is the portion of the sample (68,000 addresses) that received a set of income questions similar to those used in 2013; the source for “2013
(redesign)” is the portion of the 2014 CPS ASEC sample (30,000 addresses) that received the redesigned income questions. The redesigned income questions were
used for the entire 2015 CPS ASEC sample. Some data have been revised and differ from previous versions of
Older Americans.
Reference population: These data refer to the civilian noninstitutionalized population.
SOURCE: U.S. Census Bureau, Current Population Survey, Annual Social and Economic Supplement.

96
Tables
INDICATOR 9: Sources of Income
Table 9a. Percentage distribution of per capita family income for persons age 65 and over, by income quintile and source of income,
2014
Source of income Total Lowest fth Second fth Third fth Fourth fth Highest fth
Total 100.0 100.0 100.0 100.0 100.0 100.0
Percentage of income from
Earnings 23.7 13.1 13.8 21.0 30.4 39.6
Retirement benets 64.7 70.8 79.8 71.0 58.5 43.6
Social Security 48.7 66.7 72.3 53.6 34.2 17.8
Railroad Retirement 0.2 0.1 0.2 0.3 0.3 0.1
Government employee pensions 5.6 1.0 2.1 4.9 8.7 11.2
Private pensions or annuities 10.1 3.0 5.3 12.2 15.3 14.5
Asset income 6.4 5.8 2.4 4.2 6.3 13.1
Cash public assistance 2.0 7.6 1.6 0.6 0.3 0.1
Other 3.3 2.6 2.3 3.3 4.5 3.7
Number (in thousands) 45,079 8,630 9,114 9,120 9,100 9,115
NOTE: The denition of “other” includes, but is not limited to, unemployment compensation, workers’ compensation, veterans’ payments, and personal contributions.
Quintile limits are $12,492, $19,245, $29,027, and $47,129. Estimates may not sum to the totals because of rounding.
Reference population: These data refer to the civilian noninstitutionalized population.
SOURCE: U.S. Census Bureau, Current Population Survey, Annual Social and Economic Supplement.

97
Tables
INDICATOR 9: Sources of Income
Table 9b. Percentage of people age 55 and over with family income from specied sources, by age group, 2014
Source of family income 55–61
62–64
65 and over
Total 65–69 70–74 75–79 80 and over
Earnings 83.7 72.9 40.2 57.1 40.4 30.6 22.8
Wages and salaries 80.6 69.2 37.0 53.3 36.6 28.0 20.9
Self-employment 10.8 10.4 6.4 8.6 7.3 4.8 3.4
Retirement benets 31.4 57.3 89.1 83.2 91.7 92.4 92.2
Social Security 22.2 46.6 86.0 78.7 89.4 90.2 90.0
Benets other than Social Security 16.1 29.6 47.7 43.0 50.9 51.7 48.0
Other public pensions 7.1 13.4 17.7 17.4 18.5 18.0 17.2
Railroad Retirement 0.1 0.5 0.4 0.3 0.6 0.3 0.4
Government employee pensions 7.0 13.0 17.4 17.1 18.0 17.7 16.8
Military 1.0 1.2 2.0 1.7 2.0 2.0 2.3
Federal 1.9 2.9 4.7 4.2 5.2 5.2 4.6
State or local 4.5 9.5 12.1 12.4 12.6 12.0 11.2
Private pensions or annuities 12.0 23.0 40.9 35.7 44.4 45.7 41.2
Asset income 66.9 68.9 67.1 69.0 68.1 65.6 64.5
Interest 66.0 67.6 65.7 68.1 66.6 64.0 62.6
Other income from assets 25.4 28.0 28.4
29.2 28.1 28.3 27.6
Dividends 21.0 22.7 23.1 23.9 22.4 23.1 22.5
Rent or royalties 9.0 11.2 10.3 10.9 10.6 10.4 9.0
Estates or trusts 0.3 0.4 0.4 0.4 0.2 0.4 0.6
Veterans’ benets 2.7 4.1 5.6 6.8 5.0 4.5 5.4
Unemployment compensation 4.3 3.5 1.4 2.1 1.4 0.9 0.7
Workers’ compensation 1.1 0.9 0.5 0.7 0.4 0.4 0.4
Cash public assistance and noncash benets 15.0 13.8 13.3 12.6 13.0 13.7 14.3
Cash public assistance 7.6 6.9 5.2 5.3 4.9 5.2 5.2
Supplemental Security Income 6.9 6.3 4.8 4.9 4.5 4.9 4.9
Other 1.2 0.7 0.5 0.6 0.5 0.4 0.4
Noncash benets 11.6 10.7 11.0 10.2 10.8 11.6 12.1
Food 9.5 8.8 7.4 7.3 7.2 7.7 7.6
Energy 2.9 2.6 3.3 2.8 2.9 4.4 3.8
Housing 2.9 3.0 3.9 3.3 3.8 4.5 4.4
Personal contributions 2.4 1.8 1.4 1.3 1.2 1.4 1.7
Number (in thousands) 29,434 10,983 45,994 15,728 11,209 8,002 11,054
Reference population: These data refer to the civilian noninstitutionalized population.
SOURCE: U.S. Census Bureau, Current Population Survey, Annual Social and Economic Supplement.

98
Tables
INDICATOR 9: Sources of Income
Table 9c. Number of participants (in thousands) in private pension plans, by type of plan, 1975–2013
Year Total
Dened
Benet Contribution
1975 44,511 33,004 11,507
1976 47,679 34,207 13,472
1977 50,236 34,997 15,239
1978 52,371 36,103 16,268
1979 55,097 36,810 18,287
1980 57,903 37,979 19,924
1981 60,564 38,903 21,661
1982 63,243 38,633 24,610
1983 69,147 40,025 29,122
1984 73,895 40,980 32,915
1985 74,665 39,692 34,973
1986 76,672 39,989 36,682
1987 78,223 39,958 38,265
1988 77,685 40,722 36,963
1989 76,405 39,958 36,447
1990 76,924 38,832 38,091
1991 77,662 39,027 38,634
1992 81,914 39,531 42,383
1993 83,870 40,267 43,603
1994 85,117 40,338 44,778
1995 87,452 39,736 47,716
1996 91,716 41,111 50,605
1997 94,985 40,392 54,593
1998 99,455 41,552 57,903
1999 101,794 41,427 60,368
2000 103,329 41,613 61,716
2001 106,579 42,067 64,511
2002 107,354 42,078 65,275
2003 106,296 42,179 64,117
2004 106,335 41,707 64,627
2004
a
115,707 41,918 73,789
2005 117,406 41,925 75,481
2006 121,995 42,146 79,849
2007 123,854 42,280 81,574
2008 124,853 42,344 82,510
2009 129,268 41,820 87,448
2010 129,724 41,423 88,301
2011 129,581 40,876 88,705
2012 130,584 39,809 90,775
2013 131,631 39,084 92,547
a
The number of participants for 2004 was revised using the new denition summarized in the note below.
NOTE: The methodology for calculating participants was changed beginning with the 2005 Form 5500 series in response to the discontinuance of the IRS Form 5500
Schedule T. For 2004, the revision increases counts of participants by 9 million. Under the current methodology, participant counts include all workers eligible to
participate in a plan. The term “participants” refers to active, retired, and separated vested participants not yet in pay status. Workers participating in more than one
plan are counted separately for each plan in which they participate.
Reference population: These data refer to counts of participants reported by private pension plans on the Form 5500.
SOURCE: U.S. Department of Labor, Employee Benets Security Administration, Form 5500 lings.

99
Tables
INDICATOR 9: Sources of Income
Table 9d. Number of participants (in thousands) in private dened benet pension plans and percent of participants retired or
separated from employer, 1975–2013
Year Number of participants Percent retired or separated from employer
1975 33,004 17.5
1976 34,207 19.5
1977 34,997 19.8
1978 36,103 19.6
1979 36,810 20.0
1980 37,979 20.7
1981 38,903 22.8
1982 38,633 23.2
1983 40,025 25.4
1984 40,980 26.6
1985 39,692 27.2
1986 39,989 28.7
1987 39,958 28.9
1988 40,722 31.3
1989 39,958 32.1
1990 38,832 32.5
1991 39,027 34.4
1992 39,531 36.2
1993 40,267 37.9
1994 40,338 39.3
1995 39,736 41.1
1996 41,111 43.7
1997 40,392 44.0
1998 41,552 45.0
1999 41,427 45.4
2000 41,613 46.6
2001 42,067 47.5
2002 42,078 48.6
2003 42,179 49.5
2004 41,707 50.6
2005 41,925 51.6
2006 42,146 52.7
2007 42,280 54.1
2008 42,344 55.2
2009 41,820 56.7
2010 41,423 58.5
2011 40,876 59.6
2012 39,809 60.4
2013 39,084 61.0
Reference population: These data refer to participants in private dened benet pension plans who led a Form 5500.
SOURCE: U.S. Department of Labor, Employee Benets Security Administration, Form 5500 lings.

100
Tables
INDICATOR 9: Sources of Income
Table 9e. Number of participants (in thousands) in dened benet and dened contribution retirement plans, by selected type of
plan, 1999–2013
Year
Dened benet Dened contribution
Total
Cash balance
Total
401(k)-type plans
Number
Share of total
participants
in dened
benet plans Number
401(k)-type plans that allow
participants to direct all or
portion of investments
Number
Share of total
participants in
401(k)-type plans
1999 41,427 6,175 14.9 60,368 46,203 39,493 85.5
2000 41,613 7,016 16.9 61,716 48,348 43,834 90.7
2001 42,067 7,820 18.6 64,511 51,814 47,530 91.7
2002 42,078 8,244 19.6 65,275 53,296 49,250 92.4
2003 42,179 9,346 22.2 64,117 53,842 50,255 93.3
2004 41,707 9,808 23.5 64,627 54,892 51,250 93.4
2005 41,925 10,135 24.2 75,481 65,652 62,009 94.5
2006 42,146 10,185 24.2 79,849 70,295 66,555 94.7
2007 42,280 10,520 24.9 81,574 72,178 68,642 95.1
2008 42,344 10,812 25.5 82,510 73,156 69,542 95.1
2009 41,820 11,760 28.1 87,448 72,499 69,478 95.8
2010 41,423 12,040 29.1 88,301 72,165 69,627 96.5
2011 40,876 12,150 29.7 88,705 72,968 70,517 96.6
2012 39,809 11,833 29.7 90,775 74,881 72,532 96.9
2013 39,084 11,956 30.6 92,547
76,640 74,354 97.0
Reference population: These data refer to participants in private pension plans who led a Form 5500.
SOURCE: U.S. Department of Labor, Employee Benets Security Administration, Form 5500 lings.
Table 9f. Percentage of workers in private sector and state and local government with access to retirement benets, by type of
retirement plan, 2015
Type of employment
Dened contribution
only
Dened benet and dened
contribution
Dened benet
only
Private sector, all workers 47 14 4
State and local government, all workers 6 27 57
Reference population: These data refer to civilian workers in establishments covered by unemployment insurance.
SOURCE: National Compensation Survey, March 2015, Bureau of Labor Statistics.

101
Tables
INDICATOR 10: Social Security Beneciaries
Table 10a. Percentage distribution of people who began receiving Social Security benets in 2014, by age and sex
Sex
Total
years
Pre-Full Retirement Age Full Retirement Age Post-Full Retirement Age
Age
62
Age
63
Age
64
Age
65
Age
66
Disabled
Worker
Conversions
a
Age
66
Age
67–69
Age
70 and
over
Men 100 36 6 6 11 17 18 3 3 2
Women 100 41 7 7 11 12 16 2 3 3
a
At Full Retirement Age (FRA), persons formerly receiving disabled worker benets are reclassied and begin receiving retired worker benets.
NOTE: FRA is dened as age 66 for those born between 1943 and 1955. The percentages are not probabilities of a birth cohort claiming at a particular age. A person
begins receiving Social Security benets the month after he or she becomes entitled. Totals may not sum to 100 percent because of rounding.
Reference population: Persons fully insured for Social Security retired worker benets who became entitled to benets in 2014.
SOURCE: Social Security Administration, Master Beneciary Record.
Table 10b. Percentage distribution of female Social Security beneciaries age 62 and over, by type of benet received, selected years
1960–2014
Type of benet 1960 1970 1975 1980 1985 1990 1995 2000 2005 2010 2011 2012 2013 2014
Worker benet only
a
38.7 42.1 42.3 41.0 38.5 36.9 36.2 38.0 41.4 46.3 47.5 48.7 49.9 51.1
Spouse or widow
benet only
Spouse only 32.8 22.4 19.6 17.6 16.4 15.3 14.3 12.9 11.4 9.6 9.3 8.0 8.8 8.6
Widow only
b
23.4 26.8 26.1 25.4 24.9 24.3 23.6 21.5 19.3 17.0 15.9 15.3 14.7 14.4
Dual entitlement
Worker and
spouse 2.4 3.4 4.4 6.2 8.7 10.4 11.5 12.0 12.0 12.1 12.0 11.9 11.8 11.6
Worker and widow 2.1 5.0 7.4 9.6 11.5 13.0 14.4 15.6 16.0 15.5 15.3 15.1 11.6 14.6
a
Worker benets include retired and disabled worker benets.
b
Widow-only beneciaries include disabled workers and mothers of surviving children under age 19.
NOTE: All data for 2005 and dual-entitlement data for 1995 and 2000 are based on a 10 percent sample of administrative records. All other estimates are based on
100 percent of available data. Benets exclude special age-72 beneciaries and disabled adult children and include disabled workers. Totals may not sum to 100
percent because of rounding.
Reference population: These data refer to the civilian noninstitutionalized population.
SOURCE: Social Security Administration, Master Beneciary Record.

102
Tables
INDICATOR 11: Net Worth
Table 11a. Median household net worth, in 2013 dollars, by selected characteristics of head of household, selected years 1983–2013
Selected characteristic
In dollars
1983 1989 1992 1995 1998 2001 2004 2007 2010 2013
Age of family head
45–54 $122,780 $177,320 $127,220 $140,710 $151,000 $176,390 $178,560 $207,720 $125,550 $105,350
55–64 153,690 177,450 184,900 175,330 182,840 243,310 284,850 284,850 191,512 165,660
65 and over 116,480 137,560 149,090 153,290 196,530 221,150 219,380 247,910 227,630 210,500
65–74 135,980 140,270 160,360 168,420 209,430 233,750 234,540 268,800 221,490 232,100
75 and over 79,820 131,140 141,190 141,160 179,830 205,320 201,130 239,380 231,770 195,000
Marital status,
a
family head
age 65 and over
Married 157,050 240,810 246,330 239,230 311,210 368,090 349,350 327,970 347,340 319,800
Unmarried 75,490 74,910 104,150 116,540 125,230 121,700 142,550 180,870 132,840 119,300
Race, family head
age 65 and over
White 137,340 173,890 176,940 177,740 225,010 283,390 259,490 278,680 272,640 255,000
Black 20,160 41,280 45,220 37,950 40,370 64,150 64,740 98,580 101,650 56,700
Education, family head
age 65 and over
No high school diploma 65,160 72,300 63,220 87,130 77,770 96,390 67,180 114,300 74,270 86,650
High school diploma only 149,320
144,610 176,600 161,970 209,140 215,550 216,790 210,190 179,130 147,250
Some college or more 317,980 441,210 319,920 307,830 345,520 521,690 442,700 574,590 450,040 387,000
a
“Married” includes legally married couples.“Unmarried” includes cohabitating couples, separated, divorced, widowed, and never married.
NOTE: Median net worth is measured in constant 2013 dollars. Net worth includes assets held in investment retirement accounts such as individual retirement
accounts, Keoghs, and 401(k)-type plans. All observations are weighted for analysis. The term “household” in this indicator is from the codebook of the 2013 Survey of
Consumer Finance (www.federalreserve.gov/econresdata/). The data are for the “primary economic unit” (PEU). The PEU consists of an economically dominant single
individual or couple (married or living partners) in a household and all other members of the household who are nancially interdependent with the individual or
couple. In the majority of cases, the PEU and household are identical. All data are for households with positive values.
Reference population: These data refer to the civilian noninstitutionalized population.
SOURCE: Survey of Consumer Finances.

103
Tables
INDICATOR 11: Net Worth
Table 11b. Value of household nancial assets held in retirement investment accounts, by selected characteristics of head of household,
2007 and 2013
Selected characteristic
2007 2013
In dollars
Percent
holding
In dollars
Percent
holding
Lowest
quartile
Middle
quartiles
Highest
quartile
Lowest
quartile
Middle
quartiles
Highest
quartile
Age of family head
45–54 $24,000 $71,000 $199,000 65.0 $20,000 $87,000 $240,000 56.5
55–64 33,000 112,000 301,000 61.0 26,000 104,000 300,000 59.3
65 and over 18,000 68,000 202,000 40.8 40,000 118,000 295,000 39.4
65–74 23,000 87,000 231,000 51.7 50,000 149,000 400,000 48.0
75 and over 15,000 39,000 124,000 30.0 33,000 69,000 174,000 29.0
Marital status,
a
family head
age 65 and over
Married 21,000 83,000 224,000 53.5 60,000 160,000 440,000 51.0
Unmarried 16,000 39,000 139,000 28.9 20,000 68,000 165,000 28.7
Race, family head
age 65 and over
White 18,000 69,000 197,000 45.3 45,000 124,000 330,000 44.9
Other race
b
19,000 125,000 488,000 12.6 23,000 110,000 300,000 15.8
Education, family head
age 65 and over
No high school diploma
c
8,000 34,000 91,000 19.1 5,000 22,000 50,000 9.1
High school diploma only 11,000 39,000 84,000 35.1 24,000 62,000 135,000 31.4
Some college or more 31,000 130,000 354,000 59.1 60,000 170,000 491,000 55.5
a
“Married” includes legally married couples.“Unmarried” includes cohabitating couples, separated, divorced, widowed, and never married.
b
“Other race” includes Black, Hispanic, and Other. The gures for 2007 are based on 28 real observations. This category is dominated by household heads who belong
to the “Other” racial category.
c
The gures for households headed by a person without a high school diploma in 2013 are based on 25 real observations.
NOTE: Median net worth is measured in constant 2013 dollars. Net worth includes assets held in investment retirement accounts such as individual retirement
accounts, Keoghs, and 401(k)-type plans. All observations are weighted for analysis. The term “household” in this indicator is from the codebook of the 2013 Survey of
Consumer Finance (www.federalreserve.gov/econresdata/). The data are for the “primary economic unit” (PEU). The PEU consists of an economically dominant single
individual or couple (married or living partners) in a household and all other members of the household who are nancially interdependent with the individual or
couple. In the majority of cases, the PEU and household are identical. All data are for households with positive values.
Reference population: These data refer to the civilian noninstitutionalized population.
SOURCE: Survey of Consumer Finances.

104
Tables
INDICATOR 11: Net Worth
Table 11c. Amount of funds (in millions of dollars) held in retirement assets, by sector and type of plan, 1975–2014
Year
All sectors Private only Public only
Individual retirement
accounts (IRAs)
Dened
contribution
Dened
benet
a
Dened
contribution
Dened
benet
a
Dened
contribution
Dened
benet
a
1975 — $74,612 $315,782 $74,612 $169,719 — $146,063
1976 — 84,341 356,824 84,341 190,962 — 165,862
1977 — 92,766 388,647 92,766 204,503 — 184,144
1978 — 110,620 452,980 110,620 240,687 — 212,293
1979 — 133,307 515,723 133,307 279,781 — 235,942
1980 — 163,363 622,636 158,812 349,622 $4,551 273,014
1981 $38,000 174,363 673,378 169,597 364,853 4,766 308,525
1982 68,000 208,297 818,105 202,201 460,731 6,096 357,374
1983 107,000 254,655 974,341 246,783 560,398 7,872 413,943
1984 159,000 287,475 1,067,492 278,883 588,721 8,592 478,771
1985 241,000 431,714 1,368,996 420,382 795,064 11,332 573,932
1986 329,000 469,697 1,494,230 455,466 816,033 14,231 678,197
1987 404,000 551,750 1,567,113 535,617 803,294 16,133 763,819
1988 468,000 597,132 1,674,304 577,118 812,800 20,014 861,504
1989 546,000
715,197 1,918,853 688,709 921,494 26,488 997,359
1990 637,000 737,198 1,962,358 708,546 899,857 28,652 1,062,501
1991 776,000 890,757 2,274,407 853,052 1,051,654 37,705 1,222,753
1992 873,000 974,323 2,427,769 930,324 1,079,860 43,999 1,347,909
1993 993,000 1,111,304 2,684,968 1,057,931 1,195,109 53,373 1,489,859
1994 1,056,000 1,186,477 2,853,227 1,127,009 1,275,964 59,468 1,577,263
1995 1,288,000 1,467,738 3,299,521 1,389,546 1,466,122 78,192 1,833,399
1996 1,467,000 1,679,084 3,660,841 1,582,489 1,590,232 96,595 2,070,609
1997 1,728,000 2,223,790 4,159,755 1,950,745 1,763,538 273,045 2,396,217
1998 2,150,000 2,585,459 4,581,283 2,240,694 1,907,730 344,765 2,673,553
1999 2,651,000 2,955,912 5,084,432 2,531,038 2,074,645 424,874 3,009,787
2000 2,629,000 2,905,379 4,977,000 2,500,499 1,978,987 404,880 2,998,013
2001 2,619,000 2,638,370 4,782,651 2,254,552 1,810,236 383,818 2,972,415
2002 2,532,000 2,402,674 4,369,875 2,054,726 1,639,303 347,948 2,730,572
2003 2,993,000 2,992,979 5,182,865 2,551,316 1,994,538 441,663 3,188,327
2004 3,299,000 3,328,948 5,586,436 2,822,627 2,132,170 506,321 3,454,266
2005 3,425,000 3,706,573 5,922,727 3,146,539 2,281,326 560,034 3,641,401
2006 4,207,000 4,089,707 6,382,102 3,448,388 2,393,189 641,319 3,988,913
2007 4,748,000 4,364,497 6,678,779 3,664,143 2,516,486 700,354 4,162,293
2008 3,681,000 3,268,405 5,303,013 2,733,992 1,897,817 534,413 3,405,196
2009 4,488,000 3,986,583 5,845,781 3,327,103 2,126,880 659,480 3,718,901
2010 5,029,000 4,507,019 6,395,589 3,763,657 2,387,116 743,362 4,008,473
2011 5,241,000 4,493,069 6,388,358 3,766,231 2,429,469 726,838 3,958,889
2012 5,907,000 5,000,368 6,770,005 4,220,842 2,627,787 779,526 4,142,218
2013 6,966,000 5,891,192 7,648,274 5,003,857 2,875,486 887,335 4,772,788
2014 7,443,000 6,298,411 7,964,469 5,342,952 2,932,973 955,459 5,031,496
— Not available.
a
Public and private dened benet plans do not include claims of pension funds on sponsor.
Reference population: Public and private retirement assets for total population.
SOURCE: Federal Reserve Board Z.1 Statistical Release for Dec. 10, 2015.

105
Tables
INDICATOR 12: Participation in Labor Force
Table 12. Labor force participation rates (annual averages) of persons age 55 and over, by sex and age group, 1963–2015
Year
Men Women
55–61 62–64 65–69 70 and over 55–61 62–64 65–69 70 and over
1963 89.9 75.8 40.9 20.8 43.7 28.8 16.5 5.9
1964 89.5 74.6 42.6 19.5 44.5 28.5 17.5 6.2
1965 88.8 73.2 43.0 19.1 45.3 29.5 17.4 6.1
1966 88.6 73.0 42.7 17.9 45.5 31.6 17.0 5.8
1967 88.5 72.7 43.4 17.6 46.4 31.5 17.0 5.8
1968 88.4 72.6 43.1 17.9 46.2 32.1 17.0 5.8
1969 88.0 70.2 42.3 18.0 47.3 31.6 17.3 6.1
1970 87.7 69.4 41.6 17.6 47.0 32.3 17.3 5.7
1971 86.9 68.4 39.4 16.9 47.0 31.7 17.0 5.6
1972 85.6 66.3 36.8 16.6 46.4 30.9 17.0 5.4
1973 84.0 62.4 34.1 15.6 45.7 29.2 15.9 5.3
1974 83.4 60.8 32.9 15.5 45.3 28.9 14.4 4.8
1975 81.9 58.6 31.7 15.0 45.6 28.9 14.5 4.8
1976 81.1 56.1 29.3 14.2 45.9
28.3 14.9 4.6
1977 80.9 54.6 29.4 13.9 45.7 28.5 14.5 4.6
1978 80.3 54.0 30.1 14.2 46.2 28.5 14.9 4.8
1979 79.5 54.3 29.6 13.8 46.6 28.8 15.3 4.6
1980 79.1 52.6 28.5 13.1 46.1 28.5 15.1 4.5
1981 78.4 49.4 27.8 12.5 46.6 27.6 14.9 4.6
1982 78.5 48.0 26.9 12.2 46.9 28.5 14.9 4.5
1983 77.7 47.7 26.1 12.2 46.4 29.1 14.7 4.5
1984 76.9 47.5 24.6 11.4 47.1 28.8 14.2 4.4
1985 76.6 46.1 24.4 10.5 47.4 28.7 13.5 4.3
1986 75.8 45.8 25.0 10.4 48.1 28.5 14.3 4.1
1987 76.3 46.0 25.8 10.5 48.9 27.8 14.3 4.1
1988 75.8 45.4 25.8 10.9 49.9 28.5 15.4 4.4
1989 76.3 45.3 26.1 10.9 51.4 30.3 16.4 4.6
1990 76.7 46.5 26.0 10.7 51.7 30.7 17.0 4.7
1991 76.1 45.5 25.1 10.5
52.1 29.3 17.0 4.7
1992 75.7 46.2 26.0 10.7 53.6 30.5 16.2 4.8
1993 74.9 46.1 25.4 10.3 53.8 31.7 16.1 4.7
1994 73.8 45.1 26.8 11.7 55.5 33.1 17.9 5.5
1995 74.3 45.0 27.0 11.6 55.9 32.5 17.5 5.3
1996 74.8 45.7 27.5 11.5 56.4 31.8 17.2 5.2
1997 75.4 46.2 28.4 11.6 57.3 33.6 17.6 5.1
1998 75.5 47.3 28.0 11.1 57.6 33.3 17.8 5.2
1999 75.4 46.9 28.5 11.7 57.9 33.7 18.4 5.5
2000 74.3 47.0 30.3 12.0 58.3 34.1 19.5 5.8
2001 74.9 48.2 30.2 12.1 58.9 36.7 20.0 5.9
2002 75.4 50.4 32.2 11.5 61.1 37.6 20.7 6.0
2003 74.9 49.5 32.8 12.3 62.5 38.6 22.7 6.4
2004 74.4 50.8 32.6 12.8 62.1 38.7 23.3 6.7
2005 74.7 52.5 33.6 13.5 62.7 40.0 23.7 7.1
See notes at end of table.

106
Tables
INDICATOR 12: Participation in Labor Force
Table 12. Labor force participation rates (annual averages) of persons age 55 and over, by sex and age group, 1963–2015—continued
Year
Men Women
55–61 62–64 65–69 70 and over 55–61 62–64 65–69 70 and over
2006 75.2 52.4 34.4 13.9 63.8 41.5 24.2 7.1
2007 75.4 51.7 34.3 14.0 63.8 41.8 25.7 7.7
2008 75.8 53.0 35.6 14.6 64.6 42.0 26.4 8.1
2009 75.4 55.1 36.3 14.8 65.5 44.0 26.6 8.3
2010 75.6 54.6 36.5 14.7 65.6 45.3 27.0 8.3
2011 75.4 53.2 37.4 15.4 65.3 44.7 27.3 8.4
2012 75.5 54.6 37.1 16.2 65.2 44.1 27.6 8.5
2013 75.7 54.0 37.2 15.9 64.4 45.2 27.6 9.1
2014 74.9 56.2 36.1 15.7 64.0 44.7 27.5 9.2
2015 74.9 55.8 36.8 15.8 63.5 45.2 27.9 9.2
NOTE: Data for 1994 and later years are not strictly comparable with data for 1993 and earlier years due to a redesign of the survey and methodology of the Current
Population Survey.
Reference population: These data refer to the civilian noninstitutionalized population.
SOURCE: Bureau of Labor Statistics, Current Population Survey.

107
Tables
INDICATOR 13: Housing Problems
Table 13a. Prevalence of housing problems among older-owner/renter households,
a
by type of problem, selected years,
2009–2013
2009 2011 2013
House-
holds % Persons
b
%
House-
holds % Persons
b
%
House-
holds % Persons
b
%
Number (in thousands)
Total 24,115 100.0 32,473 100.0 26,419 100.0 35,799 100.0 28,330 100.0 38,327 100.0
Number and percent with
One or more housing problems 10,169 42.2 12,629 38.9 11,199 42.4 14,013 39.1 10,905 38.5 13,541 35.3
Housing cost burden (>30%) 9,614 39.9 11,877 36.6 10,621 40.2 13,251 37.0 10,316 36.4 12,809 33.4
Physically inadequate housing 1,003 4.2 1,252 3.9 1,120 4.2 1,380 3.9 1,063 3.8 1,290 3.4
Crowded housing 48 0.2 73 0.2 76 0.3 105 0.3 106 0.4 147 0.4
a
Older-owner/renter households are dened as households with a householder or spouse age 65 and over.
b
Number of persons age 65 and over.
NOTE: Some data for 2009 have been revised and differ slightly from previous editions of
Older Americans.
Additional years of data are available at agingstats.gov.
Reference population: These data refer to the resident noninstitutionalized population. People residing in noninstitutional group homes are excluded.
SOURCE: U.S. Department of Housing and Urban Development, American Housing Survey.
Table 13b. Prevalence of housing problems among older-member households,
a
by type of problem, selected years, 2009–2013
2009 2011 2013
House-
holds % Persons
b
%
House-
holds % Persons
b
%
House-
holds % Persons
b
%
Number (in thousands)
Total 2,022 100.0 2,225 100.0 2,111 100.0 2,363 100.0 2,115 100.0 2,366 100.0
Number and percent with
One or more housing problems 902 44.6 1,025 46.1 924 43.8 1,028 43.5 818 38.7 940 39.7
Housing cost burden (>30%) 787 38.9 890 40.0 819 38.8 907 38.4 711 33.6 820 34.7
Physically inadequate housing 98 4.9 107 4.8 101 4.8 111 4.7 81 3.8 92 3.9
Crowded housing 123 6.1 151 6.8 123 5.8 147 6.2 129 6.1 156 6.6
a
Older-member households are dened as households with one or more members age 65 and over and exclude households with a householder or spouse age 65
and over.
b
Number of persons (excluding householder and spouse) age 65 and over.
NOTE: Some data for 2009 have been revised and differ slightly from previous editions of
Older Americans.
Additional years of data are available at agingstats.gov.
Reference population: These data refer to the resident noninstitutionalized population. People residing in noninstitutional group homes are excluded.
SOURCE: U.S. Department of Housing and Urban Development, American Housing Survey.

108
Tables
INDICATOR 13: Housing Problems
Table 13c. Prevalence of housing problems among all U.S. households except those households
a
with one or more persons age 65 and
over, by type of problem, selected years, 2009–2013
2009 2011 2013
House-
holds % Persons %
House-
holds % Persons %
House-
holds % Persons %
Number (in thousands)
Total 85,740 100.0 233,778 100.0 86,377 100.0 234,244 100.0 85,406 100.0 230,689 100.0
Number and percent with
One or more housing problems 34,522 40.3 96,151 41.1 36,483 42.2 100,963 43.1 32,285 37.8 87,835 38.1
Housing cost burden (>30%) 30,976 36.1 83,254 35.6 32,703 37.9 87,475 37.3 28,606 33.5 74,587 32.3
Physically inadequate housing 4,628 5.4 11,725 5.0 5,103 5.9 13,005 5.6 4,744 5.6 11,807 5.1
Crowded housing 2,318 2.7 14,254 6.1 2,609 3.0 15,935 6.8 2,262 2.6 14,101 6.1
a
Households with no persons age 65 and over.
NOTE: Some data for 2009 have been revised and differ slightly from previous editions of
Older Americans.
Additional years of data are available at agingstats.gov.
Reference population: These data refer to the resident noninstitutionalized population. People residing in noninstitutional group homes are excluded.
SOURCE: U.S. Department of Housing and Urban Development, American Housing Survey.
Table 13d. Prevalence of housing problems among older-owner/renter intergenerational households,
a
by type of problem, selected
years, 2009–2013
2009 2011 2013
House-
holds % Persons
b
%
House-
holds % Persons
b
%
House-
holds % Persons
b
%
Number (in thousands)
Total 845 100.0 1,049 100.0 1,128 100.0 1,377 100.0 1,220 100.0 1,494 100.0
Number and percent with
One or more housing problems 383 45.2 453 43.2 536 47.5 623 45.3 532 43.6 630 42.2
Housing cost burden (>30%) 347 41.1 409 39.0 485 43.0 560 40.7 457 37.4 542 36.3
Physically inadequate housing 41 4.9 46 4.4 53 4.7 57 4.2 57 4.7 65 4.4
Crowded housing 37 4.3 51 4.8 63 5.6 83 6.0 89 7.3 121 8.1
a
Older-owner/renter intergenerational households are dened as households with a householder or spouse age 65 and over with children age 19 or younger.
b
Number of persons age 65 and over.
NOTE: Some data for 2009 have been revised and differ slightly from previous editions of
Older Americans.
Additional years of data are available at agingstats.gov.
Reference population: These data refer to the resident noninstitutionalized population. People residing in noninstitutional group homes are excluded.
SOURCE: U.S. Department of Housing and Urban Development, American Housing Survey.

109
Tables
INDICATOR 13: Housing Problems
Table 13e. Prevalence of housing problems among older-member intergenerational households,
a
by type of problem, selected years,
2009–2013
2009 2011 2013
House-
holds % Persons
b
%
House-
holds % Persons
b
%
House-
holds % Persons
b
%
Number (in thousands)
Total 763 100.0 869 100.0 865 100.0 980 100.0 862 100.0 982 100.0
Number and percent with
One or more housing problems 420 55.1 489 56.3 468 54.0 524 53.5 391 45.3 447 45.5
Housing cost burden (>30%) 348 45.7 405 46.6 408 47.1 453 46.3 319 37.0 364 37.1
Physically inadequate housing 39 5.1 42 4.8 44 5.0 50 5.1 40 4.7 48 4.9
Crowded housing 109 14.3 127 14.7 110 12.7 129 13.2 118 13.7 136 13.9
a
Older-member intergenerational households are dened as households with one or more members age 65 and over with children age 19 or younger, and exclude
households with a householder or spouse age 65 and over.
b
Number of persons age 65 and over.
NOTE: Some data for 2009 have been revised and differ slightly from previous editions of
Older Americans.
Additional years of data are available at agingstats.gov.
Reference population: These data refer to the resident noninstitutionalized population. People residing in noninstitutional group homes are excluded.
SOURCE: U.S. Department of Housing and Urban Development, American Housing Survey.
Table 13f. Prevalence of housing problems among all older households: householder, spouse, or member(s) age 65 and over,
a
by type
of problem, selected years, 2009–2013
2009 2011 2013
House-
holds % Persons
a
%
House-
holds % Persons
a
%
House-
holds % Persons
a
%
Number (in thousands)
Total 26,138 100.0 34,698 100.0 28,530 100.0 38,162 100.0 30,446 100.0 40,693 100.0
Number and percent with
One or more housing problems 11,071 42.4 13,654 39.4 12,123 42.5 15,041 39.4 11,723 38.5 14,481 35.6
Housing cost burden (>30%) 10,400 39.8 12,767 36.8 11,440 40.1 14,158 37.1 11,027 36.2 13,630 33.5
Physically inadequate housing 1,101 4.2 1,359 3.9 1,221 4.3 1,491 3.9 1,145 3.8 1,382 3.4
Crowded housing 170 0.7 223 0.6 198 0.7 252 0.7 235 0.8 303 0.7
a
Number of persons age 65 and over.
NOTE: Some data for 2009 have been revised and differ slightly from previous editions of
Older Americans.
Additional years of data are available at agingstats.gov.
Reference population: These data refer to the resident noninstitutionalized population. People residing in noninstitutional group homes are excluded.
SOURCE: U.S. Department of Housing and Urban Development, American Housing Survey.

110
Tables
INDICATOR 14: Total Expenditures
Table 14. Percentage distribution of total household annual expenditures, by age of reference person, 2014
Annual expenditure 45–54 55–64
65 and over
Total 65–74 75 and over
Personal insurance and pensions 12.8 12.6 5.2 6.5 2.8
Health care 6.9 8.8 13.4 12.2 15.6
Transportation 17.1 16.6 15.9 17.1 13.9
Housing 31.7 32.0 33.9 32.4 36.5
Food 12.2 12.1 12.5 12.9 11.9
Food at home 7.1 7.3 7.8 7.6 8.0
Food away from home 5.2 4.8 4.7 5.3 3.8
Other 19.3 17.9 19.1 18.9 19.3
NOTE: Other expenditures include apparel, personal care, entertainment, reading, education, alcohol, tobacco, cash contributions, and miscellaneous expenditures.
Data from the Consumer Expenditure Survey by age group represent average annual expenditures for consumer units by the age of the reference person, that is the
person listed as the owner or renter of the home. For example, the data on people age 65 and over reect consumer units with a reference person age 65 and over.
The Consumer Expenditure Survey collects and publishes information from consumer units, which are generally dened as a person or group of people who live in the
same household and are related by blood, marriage, or other legal arrangement (i.e., a family) or people who live in the same household who are unrelated but make
nancial decisions together. A household usually refers to a physical dwelling and may contain more than one consumer unit (e.g., roommates who are sharing an
apartment but who are nancially independent from each other). However, for convenience, the term “household” is substituted for “consumer unit” in this text.
Reference population: These data refer to the resident noninstitutionalized population.
SOURCE: Bureau of Labor Statistics, Consumer Expenditure Survey.

111
Tables
INDICATOR 15: Life Expectancy
Table 15a. Life expectancy at ages 65 and 85, by race and sex, 1981–2014
Age and year
All races
a
White Black or African American
Both sexes Men Women Both sexes Men Women Both sexes Men Women
At age 65
1981 16.7 14.4 18.6 16.8 14.4 18.8 15.2 13.2 17.0
1982 16.8 14.5 18.8 16.9 14.5 18.9 15.4 13.3 17.2
1983 16.7 14.5 18.6 16.8 14.5 18.7 15.5 13.4 17.3
1984 16.8 14.6 18.6 16.9 14.6 18.7 15.5 13.5 17.2
1985 16.7 14.6 18.6 16.8 14.6 18.7 15.3 13.3 17.0
1986 16.8 14.7 18.6 16.9 14.8 18.7 15.4 13.4 17.0
1987 16.9 14.8 18.7 17.0 14.9 18.8 15.4 13.5 17.1
1988 16.9 14.9 18.6 17.0 14.9 18.7 15.4 13.4 16.9
1989 17.2 15.2 18.8 17.3 15.2 19.0 15.5 13.6 17.0
1990 17.3 15.1 18.9 17.4 15.2 19.1 15.6 13.3 17.4
1991 17.4 15.3 19.1 17.5 15.4 19.2 15.5 13.4 17.2
1992 17.5 15.4 19.2 17.6 15.5 19.3 15.7 13.5
17.4
1993 17.3 15.3 18.9 17.4 15.4 19.0 15.5 13.4 17.1
1994 17.4 15.5 19.0 17.5 15.6 19.1 15.7 13.6 17.2
1995 17.4 15.6 18.9 17.6 15.7 19.1 15.6 13.6 17.1
1996 17.5 15.7 19.0 17.6 15.8 19.1 15.8 13.9 17.2
1997 17.7 15.9 19.2 17.8 16.0 19.3 16.1 14.2 17.6
1998 17.8 16.0 19.2 17.8 16.1 19.3 16.1 14.3 17.4
1999 17.7 16.1 19.1 17.8 16.1 19.2 16.0 14.3 17.3
2000 17.6 16.0 19.0 17.7 16.1 19.1 16.1 14.1 17.5
2001 17.9 16.2 19.2 18.0 16.3 19.3 16.2 14.2 17.7
2002 17.9 16.3 19.2 18.0 16.4 19.3 16.3 14.4 17.8
2003 18.1 16.5 19.3 18.2 16.6 19.4 16.5 14.5 18.0
2004 18.4 16.9 19.6 18.5 17.0 19.7 16.8 14.9 18.3
2005 18.4 16.9 19.6 18.5 17.0 19.7 16.9 15.0 18.3
2006 18.7 17.2
19.9 18.7 17.3 19.9 17.2 15.2 18.6
2007 18.8 17.4 20.0 18.9 17.4 20.1 17.3 15.4 18.8
2008 18.8 17.4 20.0 18.9 17.5 20.0 17.5 15.5 18.9
2009 19.1 17.7 20.3 19.2 17.7 20.3 17.8 15.9 19.2
2010 19.1 17.7 20.3 19.2 17.8 20.3 17.8 15.9 19.3
2011 19.2 17.8 20.3 19.2 17.8 20.3 18.0 16.2 19.4
2012 19.3 17.9 20.5 19.3 18.0 20.4 18.1 16.2 19.5
2013 19.3 17.9 20.5 19.3 18.0 20.5 18.1 16.3 19.5
2014 19.3 18.0 20.5 19.3 18.0 20.5 18.2 16.3 19.6
See notes at end of table.

112
Tables
INDICATOR 15: Life Expectancy
Table 15a. Life expectancy at ages 65 and 85, by race and sex, 1981–2014—continued
Age and year
All races
a
White Black or African American
Both sexes Men Women Both sexes Men Women Both sexes Men Women
At age 85
1981 6.1 5.2 6.6 6.1 5.2 6.6 5.7 4.7 6.3
1982 6.3 5.3 6.8 6.2 5.3 6.7 5.8 4.8 6.5
1983 6.1 5.2 6.6 6.1 5.2 6.5 6.9 6.0 7.4
1984 6.1 5.2 6.5 6.0 5.1 6.5 6.8 5.8 7.3
1985 6.0 5.1 6.4 5.9 5.1 6.4 6.5 5.7 6.9
1986 6.0 5.2 6.4 6.0 5.1 6.4 6.3 5.5 6.7
1987 6.1 5.2 6.4 6.0 5.2 6.4 6.4 5.6 6.8
1988 6.0 5.1 6.3 5.9 5.1 6.3 6.3 5.5 6.6
1989 6.2 5.3 6.6 6.1 5.3 6.5 6.3 5.6 6.7
1990 6.2 5.3 6.7 6.2 5.3 6.6 6.5 5.6 7.0
1991 6.2 5.3 6.5 6.1 5.3 6.5 5.9 5.1 6.3
1992 6.2 5.3 6.6 6.2 5.3 6.6 5.9 5.1
6.3
1993 6.0 5.2 6.4 6.0 5.2 6.4 5.9 5.0 6.3
1994 6.1 5.2 6.4 6.1 5.2 6.4 6.0 5.3 6.3
1995 6.0 5.2 6.3 6.0 5.2 6.3 5.9 5.1 6.2
1996 6.1 5.4 6.4 6.0 5.3 6.3 6.0 5.3 6.2
1997 6.3 5.5 6.6 6.2 5.4 6.6 6.4 5.7 6.7
1998 6.3 5.5 6.7 6.3 5.4 6.6 6.3 5.5 6.6
1999 6.3 5.5 6.6 6.2 5.4 6.6 6.2 5.6 6.5
2000 6.1 5.4 6.5 6.1 5.3 6.5 6.3 5.5 6.7
2001 6.1 5.3 6.4 6.0 5.3 6.4 6.3 5.3 6.7
2002 6.0 5.3 6.4 6.0 5.2 6.4 6.2 5.3 6.6
2003 6.1 5.4 6.4 6.1 5.3 6.4 6.3 5.4 6.7
2004 6.3 5.5 6.6 6.2 5.5 6.6 6.4 5.4 6.8
2005 6.2 5.5 6.6 6.2 5.5 6.5 6.4 5.4 6.8
2006 6.3 5.6
6.7 6.3 5.6 6.7 6.5 5.6 7.0
2007 6.4 5.7 6.8 6.4 5.7 6.8 6.6 5.6 7.0
2008 6.4 5.7 6.7 6.3 5.6 6.7 6.6 5.7 7.0
2009 6.6 5.8 7.0 6.5 5.8 6.9 6.8 5.9 7.2
2010 6.5 5.8 6.9 6.5 5.8 6.9 6.8 5.9 7.1
2011 6.5 5.9 6.9 6.5 5.8 6.8 6.8 6.0 7.2
2012 6.6 5.9 7.0 6.5 5.9 6.9 6.8 6.0 7.2
2013 6.6 5.9 7.0 6.5 5.9 6.9 6.8 6.0 7.2
2014 6.6 5.9 7.0 6.5 5.9 6.9 6.9 6.0 7.3
a
“All races” includes races not shown separately.
NOTE: Life expectancy estimates are from annual life tables produced by the National Center for Health Statistics found at http://www.cdc.gov/nchs/products/life_
tables.htm. Some estimates have been revised and may differ from previous editions of
Older Americans
due to changes in methodology and to the use of intercensal
population estimates for 2001–2009. See Appendix II, Life Expectancy, of
Health, United States, 2015
for a description of the changes in life table methodology
Reference population: These data refer to the resident population.
SOURCE: Centers for Disease Control and Prevention, National Center for Health Statistics, National Vital Statistics System.

113
Tables
INDICATOR 15: Life Expectancy
Table 15b. Life expectancy at birth, age 65, and age 85, by race and Hispanic origin and sex, 2014
Age
All races
a
White Black or African American
Both sexes Men Women Both sexes Men Women Both sexes Men Women
At birth 78.8 76.4 81.2 79.0 76.7 81.4 75.6 72.5 78.4
At age 65 19.3 18.0 20.5 19.3 18.0 20.5 18.2 16.3 19.6
At age 85 6.6 5.9 7.0 6.5 5.9 6.9 6.9 6.0 7.3
Hispanic
Non-Hispanic
White
Non-Hispanic
Black or African American
Both sexes Men Women Both sexes Men Women Both sexes Men Women
At birth 81.8 79.2 84.0 78.8 76.5 81.1 75.2 72.0 78.1
At age 65 21.1 19.6 22.2 19.3 18.0 20.5 18.1 16.2 19.5
At age 85 7.5 6.7 7.8 6.5 5.9 6.9 6.8 6.0 7.2
a
“All races” includes races not shown separately
NOTE: See data sources for the denition of race and Hispanic origin in the National Vital Statistics System. See http://www.cdc.gov/nchs/data/nvsr/nvsr64/nvsr64_11.
pdf for a description of the methodology used to calculate life expectancy for the Hispanic population.
Reference population: These data refer to the resident population.
SOURCE: Centers for Disease Control and Prevention, National Center for Health Statistics, National Vital Statistics System.

114
Tables
INDICATOR 16: Mortality
Table 16a. Death rates among people age 65 and over, by selected leading causes of death, 1981–2014
Year Total
a
Heart
disease Cancer Stroke
Chronic
lower
respiratory
diseases
Inuenza and
pneumonia Diabetes
Alzheimer's
disease
Unintentional
injuries
(Number per 100,000 population)
1981 5,714 2,547 1,056 624 186 207 106 6 94
1982 5,610 2,503 1,069 585 186 181 102 9 88
1983 5,685 2,512 1,078 564 204 207 104 16 89
1984 5,645 2,450 1,087 546 211 214 103 24 89
1985 5,694 2,431 1,091 531 225 243 103 31 89
1986 5,629 2,372 1,101 506 228 245 101 35 87
1987 5,578 2,316 1,106 496 230 237 102 42 87
1988 5,625 2,306 1,114 489 240 263 105 45 90
1989 5,457 2,172 1,133 464 240 253 120 47 88
1990 5,353 2,091 1,142 448 245 258 120 49 84
1991 5,291 2,046 1,150 435 252 245 121 49 83
1992 5,205 1,990 1,151 425 253 233 121
49 82
1993 5,349 2,024 1,159 435 274 248 128 55 84
1994 5,270 1,952 1,155 434 271 238 133 60 84
1995 5,265 1,927 1,153 438 271 237 136 65 84
1996 5,222 1,878 1,141 433 276 234 139 66 87
1997 5,179 1,827 1,127 424 280 236 140 68 87
1998 5,168 1,792 1,119 412 269 247 143 67 90
1999 5,220 1,767 1,126 433 313 167 150 129 94
2000 5,169 1,707 1,124 426 305 169 150 141 89
2001 5,096 1,652 1,105 410 303 157 152 151 93
2002 5,082 1,616 1,098 402 304 165 154 163 94
2003 4,992 1,557 1,080 381 302 159 152 173 95
2004 4,801 1,456 1,061 356 288 144 148 177 96
2005 4,804 1,422 1,053 331 304 148 149 188 99
2006 4,640
1,340 1,036 307 284 129 139 186 97
2007 4,540 1,275 1,024 298 286 117 135 187 99
2008 4,555 1,246 1,008 288 310 121 130 202 100
2009 4,373 1,180 988 270 295 107 123 190 97
2010 4,389 1,156 987 267 292 103 122 197 101
2011 4,342 1,116 962 258 294 106 126 194 102
2012 4,279 1,091 946 250 287 99 123 187 103
2013 4,267 1,085 927 245 290 106 122 184 103
2014 4,198 1,062 915 247 277 97 119 200 105
a
Includes other causes of death not shown separately.
NOTE: Death rates for 1981–1998 are based on the 9th revision of the International Classication of Diseases (ICD-9). Starting in 1999, death rates are based on ICD-
10. For the period 1981–1998, causes were coded using ICD-9 codes that are more comparable with codes for corresponding ICD-10 categories and may differ from
other published estimates. See http://www.cdc.gov/nchs/data/nvsr/nvsr49/nvsr49_02.pdf for information on the comparability of death rates between ICD-9 and ICD-
10. Some data from 2000–2009 have been revised and differ from previous versions of
Older Americans.
Rates are age adjusted using the 2000 standard population.
Ranking of causes of death are based on crude rates of death, not the age-adjusted rates shown here.
Reference population: These data refer to the resident population.
SOURCE: Centers for Disease Control and Prevention, National Center for Health Statistics, National Vital Statistics System.

115
Tables
INDICATOR 16: Mortality
Table 16b. Death rates among people age 65 and over, by selected leading causes of death, sex, and race and Hispanic origin, 2014
Total
a
Heart
disease Cancer Stroke
Chronic
lower
respiratory
diseases
Inuenza
and
pneumonia Diabetes
Alzheimer's
disease
Unintentional
injuries
(Number per 100,000 population)
All 4,198 1,062 915 247 277 97 119 200 105
Sex
Men 4,838 1,302 1,140 243 314 116 144 161 131
Women 3,724 887 755 247 252 85 101 222 86
Race and Hispanic
origin
Non-Hispanic
White 4,323 1,090 944 246 310 98 106 210 113
Non-Hispanic
Black 4,609 1,207 1,023 313 179 97 212 178 70
Hispanic 3,082 766 648 203 126 82 155 156 67
a
Includes other causes of death not shown separately.
NOTE: Rates are age adjusted using the 2000 standard population. Ranking of causes of death are based on crude rates of death, not the age-adjusted rates shown
here.
Reference population: These data refer to the resident population.
SOURCE: Centers for Disease Control and Prevention, National Center for Health Statistics, National Vital Statistics System.

116
Tables
INDICATOR 17: Chronic Health Conditions
Table 17a. Percentage of people age 65 and over who reported having selected chronic health conditions, by sex and race and Hispanic
origin, 2013–2014
Sex and
race and Hispanic origin
Heart
disease
Hyper-
tension Stroke Asthma
Chronic
bronchitis or
emphysema Cancer Diabetes Arthritis
Total 29.4 55.9 7.9 10.6 8.1 23.4 20.8 49.0
Sex
Men 35.0 54.9 8.4 8.1 7.6 26.2 22.7 42.6
Women 24.9 56.7 7.4 12.7 8.6 21.2 19.2 54.2
Race and Hispanic origin
Non-Hispanic White 30.7 54.2 7.6 10.3 8.6 26.0 18.3 50.1
Non-Hispanic Black 26.4 70.6 10.6 13.3 7.7 16.7 32.1 51.3
Hispanic 22.9 57.1 7.8 11.2 6.0 12.5 32.3 43.7
NOTE: Data are based on a 2-year average from 2013–2014. See data sources for the denition of race and Hispanic origin in the National Health Interview Survey.
Reference population: These data refer to the civilian noninstitutionalized population.
SOURCE: Centers for Disease Control and Prevention, National Center for Health Statistics, National Health Interview Survey.
Table 17b. Percentage of people age 65 and over who reported having selected chronic health conditions, 1997–1998 through 2013–
2014
Year
Heart
disease
Hyper-
tension Stroke Emphy sema Asthma
Chronic
bronchitis Cancer Diabetes Arthritis
1997–1998 32.3 46.5 8.2 5.2 7.7 6.4 18.7 13.0 —
1999–2000 29.8 47.4 8.2 5.2 7.4 6.2 19.9 13.7 —
2001–2002 31.5 50.2 8.9 5.0 8.3 6.1 20.8 15.4 —
2003–2004 31.8 51.9 9.3 5.2 8.9 6.0 20.7 16.9 50.0
2005–2006 30.9 53.3 9.3 5.7 10.6 6.1 21.1 18.0 49.5
2007–2008 31.9 55.7 8.8 5.1 10.4 5.4 22.5 18.6 49.5
2009–2010 30.4 55.9 8.6 6.2 11.3 6.2 24.0 20.5 51.2
2011–2012 30.3 55.8 8.3 5.1 10.4 5.7 24.6 20.3 48.9
2013–2014 29.4 55.9 7.9 4.2 10.6 5.3 23.4 20.8 49.0
— Not available.
NOTE: Data are based on 2-year averages.
Reference population: These data refer to the civilian noninstitutionalized population.
SOURCE: Centers for Disease Control and Prevention, National Center for Health Statistics, National Health Interview Survey.

117
Tables
INDICATOR 18: Oral Health
Table 18a. Percentage of people age 65 and over who had dental insurance, had a dental visit in the past year, or had no natural teeth,
by age group, 2014
Age group Dental insurance Dental visit in past year No natural teeth
65 and over 25.1 62.4 20.7
65–74 29.7 65.7 16.4
75–84 19.8 58.2 25.0
85 and over 15.5 56.4 31.4
NOTE: Dental insurance is estimated from questions on whether the respondent’s private health insurance plan covers dental care and whether the respondent has
a single service plan covering dental care. Dental visits in the past year were estimated from responses to the question, “About how long has it been since you last
saw or talked to a dentist?” The percentage with no natural teeth was estimated from responses to the question, “Have you lost all of your upper and lower natural
(permanent) teeth?” All estimates were calculated from the sample adult component of the National Health Interview Survey.
Reference population: These data refer to the civilian noninstitutionalized population.
SOURCE: Centers for Disease Control and Prevention, National Center for Health Statistics, National Health Interview Survey.
Table 18b. Percentage of people age 65 and over who had dental insurance, had a dental visit in the past year, or had no natural teeth,
by sex and race and Hispanic origin, 2014
Sex and race and Hispanic origin Dental insurance Dental visit in past year No natural teeth
Sex
Men 28.4 62.2 20.9
Women 22.5 62.5 20.5
Race and Hispanic origin
Non-Hispanic White 25.7 66.1 19.6
Non-Hispanic Black 23.5 43.0 28.2
Hispanic 20.1 51.3 23.2
NOTE: Dental insurance is estimated from questions on whether the respondent’s private health insurance plan covers dental care and whether the respondent has
a single service plan covering dental care. Dental visits in the past year were estimated from responses to the question, “About how long has it been since you last
saw or talked to a dentist?” The percentage with no natural teeth was estimated from responses to the question, “Have you lost all of your upper and lower natural
(permanent) teeth?” All estimates were calculated from the sample adult component of the National Health Interview Survey.
Reference population: These data refer to the civilian noninstitutionalized population.
SOURCE: Centers for Disease Control and Prevention, National Center for Health Statistics, National Health Interview Survey.

118
Tables
INDICATOR 19: Respondent-Assessed Health Status
Table 19. Percentage of people age 65 and over with respondent-assessed good to excellent health status, by race and Hispanic origin,
sex, and age group, 2012–2014
Selected characteristic Total
Non-Hispanic
White
Non-Hispanic
Black
Hispanic
(of any race)
Good to excellent health
Both sexes
65 and over 77.5 80.1 65.2 66.3
65–74 80.4 83.1 67.5 69.4
75–84 75.8 78.4 63.6 63.0
85 and over 68.1 70.6 55.6 54.7
Men
65 and over 77.5 79.6 66.5 68.5
65–74 79.9 82.2 67.4 69.9
75–84 76.1 77.9 67.2 67.7
85 and over 67.5 69.0 56.3 57.9
Women
65 and over 77.5 80.5 64.3 64.7
65–74 80.8 84.0 67.5 69.0
75–84 75.5 78.7 61.5 59.6
85 and over 68.5 71.6 55.2 52.9
Fair or poor health
Both sexes
65 and over 22.5 19.9 34.8 33.7
65–74 19.6 16.9 32.5 30.6
75–84 24.2 21.6 36.5 37.0
85 and over 31.9 29.4 44.5 45.3
Men
65 and over 22.5 20.4 33.5 31.6
65–74 20.1 17.8 32.6 30.1
75–84 23.9 22.1 32.8 32.3
85 and over 32.5 31.0 43.7 42.1
Women
65 and over 22.5 19.5 35.7 35.3
65–74 19.2 16.0 32.5 31.0
75–84 24.5 21.3 38.5 40.4
85 and over 31.5 28.4 44.8 47.1
NOTE: Data are based on a 3-year average from 2012–2014. Total includes all other races not shown separately. See data sources for the denition of race and
Hispanic origin in the National Health Interview Survey.
Reference population: These data refer to the civilian noninstitutionalized population.
SOURCE: Centers for Disease Control and Prevention, National Center for Health Statistics, National Health Interview Survey.

119
Tables
INDICATOR 20: Dementia
Table 20a. Number and percentage of the non-nursing home population age 65 and over with dementia, by age group, 2011
Age group Number Percent
65 and over 3,632,567 10.0
65–69 412,085 3.6
70–74 416,914 4.8
75–79 670,987 9.9
80–84 797,865 15.3
85–89 757,214 24.0
90 and over 577,502 36.2
Reference population: These data refer to Medicare beneciaries not living in nursing homes.
SOURCE: National Health and Aging Trends Study.
Table 20b. Percentage of the non-nursing home population age 65 and over with dementia, by sex and age group, 2011
Age group Men Women
65 and over 9.1 10.7
65–74 5.1 3.3
75–84 11.4 12.9
85 and over 23.9 29.9
Reference population: These data refer to Medicare beneciaries not living in nursing homes.
SOURCE: National Health and Aging Trends Study.
Table 20c. Percentage of the non-nursing home population age 65 and over with dementia, by sex and educational attainment, 2011
Educational attainment Total Men Women
Less than high school 20.6 19.2 21.7
High school graduate 10.0 8.8 10.7
Some college 5.5 5.3 5.7
Bachelor's degree or more 4.6 4.5 4.7
Reference population: These data refer to Medicare beneciaries not living in nursing homes.
SOURCE: National Health and Aging Trends Study.
Table 20d. Percentage of the non-nursing home population age 65 and over with dementia, by age group and educational attainment,
2011
Educational attainment 65–74 75–84 85 and over
Less than high school 11.6 22.9 37.4
High school graduate 4.0 11.6 27.3
Some college 2.4 6.8 18.6
Bachelor's degree or more 1.2 6.0 20.0
Reference population: These data refer to Medicare beneciaries not living in nursing homes.
SOURCE: National Health and Aging Trends Study.

120
Tables
INDICATOR 21: Depressive Symptoms
Table 21a. Percentage of people age 51 and over with clinically relevant depressive symptoms, by age group and sex, selected years
1998–2014
Sex
1998 2000 2002 2004 2006
51 and
over 51–64
65 and
over
51 and
over 51–64
65 and
over
51 and
over 51–64
65 and
over
51 and
over 51–64
65 and
over
51 and
over 51–64
65 and
over
Both sexes 15.2 14.7 15.8 15.5 15.4 15.6 15.2 15.1 15.4 14.7 14.8 14.6 15.6 16.6 14.4
Men 11.9 11.9 11.8 11.5 11.7 11.2 11.5 11.6 11.5 12.0 12.5 11.1 12.4 14.1 10.1
Women 17.8 17.0 18.5 18.5 18.4 18.5 17.9 17.8 18.0 16.8 16.7 17.0 18.1 18.7 17.5
2008 2010 2012 2014
51 and
over 51–64
65 and
over
51 and
over 51–64
65 and
over
51 and
over 51–64
65 and
over
51 and
over 51–64
65 and
over
Both sexes 13.9 14.6 13.3 14.1 15.6 11.9 14.2 15.6 12.5 13.7 14.7 12.8
Men 11.6 12.6 10.5 12.0 13.9 8.9 11.7 13.5 9.4 11.2 12.2 10.1
Women 15.8 16.3 15.2 15.9
17.1 14.2 16.2 17.4 14.8 15.8 16.9 14.9
NOTE: The denition of “clinically relevant depressive symptoms” is four or more symptoms out of a list of eight depressive symptoms from an abbreviated version
of the Center of Epidemiological Studies Depression Scale (CES-D), adapted by the Health and Retirement Study (HRS). The CES-D scale is a measure of depressive
symptoms and is not to be used as a diagnosis of clinical depression. A detailed explanation concerning the “four or more symptoms” cut-off can be found in the
following documentation: http://hrsonline.isr.umich.edu/sitedocs/userg/dr_005.pdf. Percentages are based on weighted data using the preliminary respondent
weights from the 2014 Early Release HRS Tracker File. Some data for 1998–2008 have been revised and differ from previous editions of
Older Americans.
Reference population: These data refer to the civilian noninstitutionalized population.
SOURCE: Health and Retirement Study.
Table 21b. Percentage of people age 51 and over with clinically relevant depressive symptoms, by age group and sex, 2014
Age group Both sexes Men Women
51–54 17.4 11.4 20.7
55–59 15.2 12.0 18.2
60–64 13.8 12.5 14.9
65–69 12.5 11.3 13.4
70–74 10.4 7.0 13.4
75–79 12.8 8.7 15.9
80–84 16.2 12.7 18.7
85 and over 15.3 13.9 16.0
NOTE: The denition of “clinically relevant depressive symptoms” is four or more symptoms out of a list of eight depressive symptoms from an abbreviated version
of the Center of Epidemiological Studies Depression Scale (CES-D), adapted by the Health and Retirement Study (HRS). The CES-D scale is a measure of depressive
symptoms and is not to be used as a diagnosis of clinical depression. A detailed explanation concerning the “four or more symptoms” cut-off can be found in the
following documentation: http://hrsonline.isr.umich.edu/sitedocs/userg/dr_005.pdf. Percentages are based on weighted data using the preliminary respondent weight
from HRS 2014.
Reference population: These data refer to the civilian noninstitutionalized population.
SOURCE: Health and Retirement Study.

121
Tables
INDICATOR 22: Functional Limitations
Table 22a. Percentage of people age 65 and over with a disability, by sex and functional domain, 2010 and 2014
Sex and functional domain 2010 2014
Total
Any disability 22.6 21.6
Vision 3.3 3.7
Hearing 4.2 6.0
Mobility 17.1 14.2
Communication 1.2 1.5
Cognition 2.7 3.1
Self-care 3.0 2.3
Men
Any disability 20.0 19.3
Vision 2.6 3.4
Hearing 6.0 8.1
Mobility 13.7 10.5
Communication 1.9 1.6
Cognition 2.8 3.1
Self-care 2.3 1.8
Women
Any disability 24.8 23.5
Vision 4.0 3.9
Hearing 2.8 4.4
Mobility 19.8 17.1
Communication 0.6 1.4
Cognition 2.6 3.0
Self-care 3.5 2.7
NOTE: Disability is dened as “a lot” or “cannot do/unable to do” when asked about difculty with seeing, even if wearing glasses (vision); hearing, even if wearing
hearing aids (hearing); walking or climbing steps (mobility); communicating, for example, understanding or being understood by others (communication);
remembering or concentrating (cognition); and self-care, such as washing all over or dressing (self-care). Any disability is dened as having difculty with at least one
of these activities. The data source and measures presented have changed from previous editions of
Older Americans.
Reference population: These data refer to the civilian noninstitutionalized population.
SOURCE: Centers for Disease Control and Prevention, National Center for Health Statistics, National Health Interview Survey

122
Tables
Table 22b. Percentage of people age 65 and over with a disability, by age group and functional domain, 2014
Functional domain 65–74 75–84 85 and over
Any disability 17.4 21.9 41.9
Vision 2.9 4.1 6.3
Hearing 5.1 5.9 11.0
Mobility 10.6 14.6 30.9
Communication 1.0 1.8 3.6
Cognition 2.2 3.1 7.4
Self-care 1.6 1.6 7.5
NOTE: Disability is dened as “a lot” or “cannot do/unable to do” when asked about difculty with seeing, even if wearing glasses (vision); hearing, even if wearing
hearing aids (hearing); walking or climbing steps (mobility); communicating, for example, understanding or being understood by others (communication);
remembering or concentrating (cognition); and self-care, such as washing all over or dressing (self-care). Any disability is dened as having difculty with at least one
of these activities. The data source and measures presented have changed from previous editions of
Older Americans.
Reference population: These data refer to the civilian noninstitutionalized population.
SOURCE: Centers for Disease Control and Prevention, National Center for Health Statistics, National Health Interview Survey.
Table 22c. Percentage of people age 65 and over with a disability, by race and Hispanic origin and functional domain, 2014
Functional domain
Non-Hispanic
White
Non-Hispanic
Black Hispanic
Any disability 20.7 26.2 26.0
Vision 3.3 4.6 5.6
Hearing 6.1 4.1 7.8
Mobility 13.3 20.6 16.9
Communication 1.1 2.4 3.1
Cognition 2.6 3.2 6.0
Self-care 1.7 4.0 4.6
NOTE: Disability is dened as “a lot” or “cannot do/unable to do” when asked about difculty with seeing, even if wearing glasses (vision); hearing, even if wearing
hearing aids (hearing); walking or climbing steps (mobility); communicating, for example, understanding or being understood by others (communication);
remembering or concentrating (cognition); and self-care, such as washing all over or dressing (self-care). Any disability is dened as having difculty with at least one
of these activities. See data sources for the denition of race and Hispanic origin in the National Health Interview Survey. The data source and measures presented
have changed from previous editions of
Older Americans.
Reference population: These data refer to the civilian noninstitutionalized population.
SOURCE: Centers for Disease Control and Prevention, National Center for Health Statistics, National Health Interview Survey.

123
Tables
INDICATOR 22: Functional Limitations
Table 22d. Percentage of Medicare beneciaries age 65 and over who have limitations in performing activities of daily living (ADLs) or
instrumental activities of daily living (IADLs), or who are in a long-term care facility, 1992–2013
Year Total IADLs only 1–2 ADLs 3–4 ADLs 5–6 ADLs
Long-term
care facility
1992 48.9 13.7 19.6 6.1 3.5 5.9
1993 46.9 13.4 18.1 5.9 3.6 5.9
1994 46.8 14.1 17.7 5.6 3.7 5.7
1995 45.0 12.9 17.2 5.7 3.4 5.8
1996 43.2 12.8 16.7 5.0 3.3 5.4
1997 42.5 12.7 16.6 4.9 3.2 5.1
1998 42.5 12.4 17.1 5.2 3.1 4.7
1999 43.8 12.8 17.9 5.1 3.2 4.8
2000 43.8 13.0 17.4 5.6 3.0 4.8
2001 43.7 13.4 17.2 5.3 3.0 4.8
2002 44.3 13.3 18.3 5.2 2.8 4.6
2003 43.3 12.9 17.6 5.5 3.1 4.2
2004 42.7 13.1 18.2 4.5 2.7 4.2
2005 42.1 12.3 18.3 4.7 2.5 4.3
2006 42.2 12.4 18.0 5.1 2.7 4.1
2007 42.1 13.8 17.7 4.5 2.3 3.9
2008 41.3 11.8 18.9 4.5 2.4 3.8
2009 41.4 12.1 17.6 5.1 2.7
3.9
2010 42.0 11.9 18.7 5.1 2.8 3.5
2011 43.7 12.3 19.7 5.2 3.0 3.6
2012 46.9 11.9 22.0 6.3 3.0 3.7
2013 44.0 11.7 20.0 5.8 2.8 3.7
NOTE: A residence is considered a long-term care facility if it is certied by Medicare or Medicaid; has three or more beds, is licensed as a nursing home or other
long-term care facility, and provides at least one personal care service; or provides 24-hour, 7-day-a-week supervision by a caregiver. Limitations in performing
activities of daily living (ADLs) refer to difculty performing (or inability to perform for a health reason) one or more of the following tasks: bathing, dressing, eating,
getting in/out of chairs, walking, or using the toilet. Limitations performing instrumental activities of daily living (IADLs) refer to difculty performing (or inability to
perform for a health reason) one or more of the following tasks: using the telephone, light housework, heavy housework, meal preparation, shopping, or managing
money. Percentages are age adjusted using the 2000 standard population. Estimates may not sum to the totals because of rounding.
Reference population: These data refer to Medicare beneciaries.
SOURCE: Centers for Medicare & Medicaid Services, Medicare Current Beneciary Survey, Access to Care.
Table 22e. Percentage of Medicare beneciaries age 65 and over who have limitations in performing activities of daily living (ADLs) or
instrumental activities of daily living (IADLs), or who are in a long-term care facility, by sex and age group, 2013
Total IADLs only 1–2 ADLs 3–4 ADLs 5–6 ADLs
Long-term
care facility
Total 44.0 11.7 20.0 5.8 2.8 3.7
Sex
Men 37.3 9.0 18.4 4.7 2.6 2.6
Women 49.1 13.9 21.3 6.6 2.9 4.4
Age group
65–74 33.9 10.3 16.3 4.1 1.9 1.2
75–84 48.4 12.8 22.7 6.7 2.6 3.6
85 and over 74.2 14.4 28.1 10.0 7.0 14.7
NOTE: A residence is considered a long-term care facility if it is certied by Medicare or Medicaid; has three or more beds, is licensed as a nursing home or other
long-term care facility, and provides at least one personal care service; or provides 24-hour, 7-day-a-week supervision by a caregiver. Limitations in performing
activities of daily living (ADLs) refer to difculty performing (or inability to perform for a health reason) one or more of the following tasks: bathing, dressing, eating,
getting in/out of chairs, walking, or using the toilet. Limitations performing instrumental activities of daily living (IADLs) refer to difculty performing (or inability to
perform for a health reason) one or more of the following tasks: using the telephone, light housework, heavy housework, meal preparation, shopping, or managing
money. Percentages are age adjusted using the 2000 standard population.
Reference population: These data refer to Medicare beneciaries.
SOURCE: Centers for Medicare & Medicaid Services, Medicare Current Beneciary Survey, Access to Care.

124
Tables
INDICATOR 23: Vaccinations
Table 23a. Percentage of people age 65 and over who reported having been vaccinated against inuenza and pneumococcal
disease, by race and Hispanic origin, selected years, 1989–2014
Year
Inuenza Pneumococcal disease
Non-Hispanic
White
Non-Hispanic
Black Hispanic
Non-Hispanic
White
Non-Hispanic
Black Hispanic
1989 32.0 17.7 23.8 15.0 6.2 9.8
1991 42.8 26.5 33.2 21.0 13.2 11.0
1993 53.1 31.1 46.2 28.7 13.1 12.2
1994 56.9 37.7 36.6 30.5 13.9 13.7
1995 60.0 39.5 49.5 34.2 20.5 21.6
1997 65.8 44.6 52.7 45.6 22.2 23.5
1998 65.6 45.9 50.3 49.5 26.0 22.8
1999 67.9 49.7 55.1 53.1 32.3 27.9
2000 66.6 47.9 55.7 56.8 30.5 30.4
2001 65.4 47.9 51.9 57.8 33.9 32.9
2002 68.7 49.5 48.5 60.3 36.9 27.1
2003 68.6 47.8 45.4 59.6 37.0 31.0
2004 67.3 45.7 54.6 60.9 38.6 33.7
2005 63.2 39.7 41.7 60.7 40.5 27.5
2006 67.5 46.8 44.9 62.0 35.5 33.4
2007 69.4 55.7 52.3 62.2 44.1 31.8
2008 69.9 50.9 54.9 64.3 44.5 36.4
2009 69.1
53.0 57.0 64.9 44.8 40.1
2010 65.9 52.6 54.6 63.6 45.9 39.0
2011 69.1 53.1 57.3 66.6 47.8 43.1
2012 68.9 53.0 57.8 63.9 46.0 43.4
2013 70.1 55.5 57.2 63.6 48.7 39.2
2014 72.4 57.4 60.8 64.9 49.8 45.2
NOTE: For inuenza, the percentage vaccinated consists of people who reported having a u shot during the past 12 months. Beginning with data from 2005,
receipt of nasal spray u vaccine is included in the estimate of u vaccinations. For pneumococcal disease, the percentage refers to people who reported
ever having a pneumonia vaccination. Questions concerning the use of inuenza and pneumonia vaccinations differed slightly on the National Health
Interview Survey across the years for which data are shown. For details, see
Health, United States, 2015
Appendix II. See data sources for the denition of
race and Hispanic origin in the National Health Interview Survey. Some data for 2005–2010 have been revised and differ from previous editions of
Older
Americans.
Reference population: These data refer to the civilian noninstitutionalized population.
SOURCE: Centers for Disease Control and Prevention, National Center for Health Statistics, National Health Interview Survey.
Table 23b. Percentage of people age 65 and over who reported having been vaccinated against inuenza and pneumococcal
disease, by selected characteristics, 2014
Selected characteristic Inuenza Pneumococcal disease
Total 70.1 61.3
Sex
Men 70.2 58.4
Women 70.0 63.7
Age group
65–74 67.1 55.8
75–84 72.9 69.3
85 and over 77.9 69.4
Education
Less than high school graduate 64.4 55.3
High school graduate or higher 71.7 62.9
NOTE: For inuenza, the percentage vaccinated consists of people who reported having a u shot during the past 12 months and includes receipt of nasal
spray u vaccines. For pneumococcal disease, the percentage refers to people who reported ever having a pneumonia vaccination.
Reference population: These data refer to the civilian noninstitutionalized population.
SOURCE: Centers for Disease Control and Prevention, National Center for Health Statistics, National Health Interview Survey.

125
Tables
INDICATOR 24: Cancer Screenings
Table 24. Percentage of women ages 50–74 who had breast cancer screening and percentage of people ages 50–75 who had colorectal
cancer screening, by sex and age group, selected years, 2000–2013
Selected characteristic 2000 2003 2005 2008 2010 2013
Breast cancer screening
Women
50–64 78.7 76.2 71.8 74.2 72.6 71.4
65–74 74.0 74.6 72.5 72.6 71.9 75.3
Colorectal cancer (CRC) screening
Men
50–64 28.6 36.3 39.2 47.3 54.0 51.2
65–75 43.4 49.9 58.2 62.4 70.1 69.8
Women
50–64 31.0 34.8 41.1 49.0 55.9 54.3
65–75 41.3 45.8 51.9 58.6 65.9 69.1
NOTE: Breast cancer screening is dened as reporting having had a mammogram in the last 2 years. Colorectal cancer (CRC) screening is dened as reporting a
fecal occult blood test (FOBT) in the past year, a sigmoidoscopy procedure in the past 5 years with FOBT in the past 3 years, or a colonoscopy in the past 10 years.
Questions concerning use of CRC screening and mammography differed slightly on the National Health Interview Survey across the years for which data are shown.
For details, see
Health, United States, 2015,
Appendix II. Breast cancer screening is reported for women ages 50–74, and colorectal cancer screening is reported for
men and women ages 50–75.
Reference population: These data refer to the civilian noninstitutionalized population.
SOURCE: Centers for Disease Control and Prevention, National Center for Health Statistics, National Health Interview Survey.

126
Tables
INDICATOR 25: Diet Quality
Table 25. Healthy Eating Index-2010 average total scores and component scores expressed as a percentage of the HEI maximum score
for the population age 65 and over, by age group, 2011–2012
Dietary component
65 and over
Total 65–74 75 and over
Total Healthy Eating Index-2010 score 68.3 68.4 67.8
Dietary adequacy components
a
Total fruit 76.8 74.2 80.8
Whole fruit 99.8 99.2 100.0
Total vegetables 83.3 86.4 78.6
Greens and beans 71.5 80.5 56.3
Whole grains 42.3 38.6 47.9
Dairy 59.9 57.6 63.5
Total protein foods 100.0 100.0 100.0
Seafood and plant proteins 98.2 99.0 91.3
Fatty acids 56.0 57.4 54.1
Dietary moderation components
b
Rened grains 73.4 71.7 75.9
Sodium 36.6 35.8 38.0
Empty calories
c
74.9 76.5 72.6
a
Higher scores reect higher intakes.
b
Higher scores reect lower intakes.
c
Empty calories are calories from solid fats (i.e., sources of saturated fats and trans fats) and added sugars (i.e., sugars not naturally occurring).
NOTE: The Healthy Eating Index-2010 (HEI-2010) is a dietary assessment tool comprising 12 components designed to measure quality in terms of how well diets meet
the recommendations of the
2010 Dietary Guidelines for Americans
and the USDA Food Patterns.
31,56,57
The HEI-2010 has 12 components; intakes equal to or better
than the standards set for each component are assigned a maximum score. For the nine adequacy components (e.g., total fruit), no intake receives a score of zero
and scores increase up to the maximum as the intakes increase toward the standard. The three moderation components (e.g., sodium) are scored in reverse so that
excessively high intakes receive zeroes and as intakes decrease toward the standard, scores increase. Higher scores reect lower intakes because lower intakes of the
moderation components are more desirable. A higher score indicates a higher quality diet that aligns with the
Dietary Guidelines for Americans.
Scores are averaged
across all adults based on usual dietary intakes.
Reference population: These data refer to the resident noninstitutionalized population.
SOURCE: Centers for Disease Control and Prevention, National Center for Health Statistics, National Health and Nutrition Examination Survey, and U.S. Department of
Agriculture, Center for Nutrition Policy and Promotion and National Cancer Institute. Healthy Eating Index-2010.

127
Tables
INDICATOR 26: Physical Activity
Table 26a. Percentage of people age 65 and over who reported participating in leisure-time aerobic and muscle-strengthening
activities that meet the 2008 Federal physical activity guidelines, by age group, 1998–2014
Year
65 and over
Total 65–74 75–84 85 and over
1998 5.5 7.0 3.9 2.0
1999 5.9 7.7 4.5 0.9
2000 6.9 8.4 5.7 1.9
2001 6.7 7.7 6.1 3.1
2002 7.1 8.8 5.8 2.1
2003 7.6 9.2 6.7 2.9
2004 7.8 9.7 6.4 3.5
2005 7.9 10.5 5.7 3.0
2006 7.5 9.1 6.5 3.0
2007 7.9 9.5 6.6 4.1
2008 9.5 11.3 9.3 2.3
2009 10.0 12.8 7.9 2.8
2010 10.5 13.6 7.3 4.0
2011 11.3 14.3 8.9 4.5
2012 11.9 14.8 9.1 4.7
2013 11.7 14.7 9.0 4.2
2014 11.7 14.5 9.0 5.1
NOTE: This measure of physical activity reects the 2008 Federal physical activity guidelines for Americans (available from: http://www.health.gov/PAGuidelines/).
The 2008 Federal guidelines recommend that adults age 65 and over who are t and have no limiting chronic conditions perform at least 150 minutes (2 hours and
30 minutes) a week of moderate-intensity, or 75 minutes (1 hour and 15 minutes) a week of vigorous-intensity aerobic physical activity or an equivalent combination
of moderate- and vigorous-intensity aerobic activity. Aerobic activity should be performed in episodes of at least 10 minutes, and preferably, it should be spread
throughout the week. In addition, they should perform muscle-strengthening activities that are moderate or high intensity and involve all major muscle groups on
two or more days a week, because these activities provide additional health benets. The measure shown here presents the percentage of people who fully met both
the aerobic activity and muscle-strengthening guidelines, irrespective of their chronic condition status.
Reference population: These data refer to the civilian noninstitutionalized population.
SOURCE: Centers for Disease Control and Prevention, National Center for Health Statistics, National Health Interview Survey.

128
Tables
INDICATOR 26: Physical Activity
Table 26b. Percentage of people age 65 and over who reported participating in leisure-time aerobic and muscle-strengthening
activities that meet the 2008 Federal physical activity guidelines, by sex and race and Hispanic origin, 2014
Activity and race and Hispanic origin Total Men Women
Aerobic and muscle-strengthening activities
Total 11.7 14.9 9.2
Non-Hispanic White 12.5 15.6 9.9
Non-Hispanic Black 8.9 12.9 6.2
Hispanic (of any race) 7.4 8.7 6.5
Aerobic activity
Total 36.5 41.6 32.5
Non-Hispanic White 37.9 42.9 33.9
Non-Hispanic Black 26.4 33.7 21.5
Hispanic (of any race) 29.0 30.5 27.9
Muscle-strengthening activity
Total 16.5 19.1 14.5
Non-Hispanic White 17.2 19.9 14.9
Non-Hispanic Black 13.5 17.1 11.1
Hispanic (of any race) 13.4 12.5 14.0
NOTE: This measure of physical activity reects the 2008 Federal physical activity guidelines for Americans (available from: http://www.health.gov/PAGuidelines/).
The 2008 Federal guidelines recommend that adults age 65 and over who are t and have no limiting chronic conditions perform at least 150 minutes (2 hours and
30 minutes) a week of moderate-intensity, or 75 minutes (1 hour and 15 minutes) a week of vigorous-intensity aerobic physical activity or an equivalent combination
of moderate- and vigorous-intensity aerobic activity. Aerobic activity should be performed in episodes of at least 10 minutes, and preferably, it should be spread
throughout the week. In addition, they should perform muscle-strengthening activities that are moderate or high intensity and involve all major muscle groups on
two or more days a week, because these activities provide additional health benets. The combined measure shown here presents the percentage of people who fully
met both the aerobic activity and muscle-strengthening guidelines, irrespective of their chronic condition status. Total includes all other races not shown separately.
Reference population: These data refer to the civilian noninstitutionalized population.
SOURCE: Centers for Disease Control and Prevention, National Center for Health Statistics, National Health Interview Survey.

129
Tables
INDICATOR 27: Obesity
Table 27. Percentage of people age 65 and over overweight and with obesity, by sex and age group, selected years, 1976–2014
Sex and age group 1976–1980 1988–1994 1999–2002 2003–2006 2007–2010 2011–2014
Overweight
Both sexes
65 and over — 60.1 68.8 69.5 72.0 70.9
65–74 57.2 64.1 73.3 73.8 75.7 73.5
75 and over — 53.9 62.8 63.9 67.2 67.3
Men
65 and over — 64.4 72.8 73.0 75.7 74.2
65–74 54.2 68.5 76.2 78.0 77.5 76.1
75 and over — 56.5 67.4 65.8 73.2 71.0
Women
65 and over — 56.9 65.9 66.7 69.1 68.4
65–74 59.5 60.3 70.9 70.3 74.2 71.2
75 and over — 52.3 59.9 62.6 63.2 64.6
Obese
Both sexes
65 and over — 22.2 29.6 30.1 35.1 34.7
65–74 17.9 25.6 35.7 34.8 40.8 38.6
75 and over — 17.0 21.3 24.1 27.8 29.0
Men
65 and over — 20.3 26.2 29.3 35.3 32.6
65–74 13.2 24.1 31.6 33.0 41.5 36.2
75 and over — 13.2 17.7 24.0 26.5 26.8
Women
65 and over — 23.6 32.0 30.8 34.9 36.4
65–74 21.5 26.9 39.0 36.4 40.3 40.7
75 and over — 19.2 23.6 24.2 28.7 30.5
— Not available.
NOTE: Data are based on measured height and weight. Height was measured without shoes. Overweight is dened as having a body mass index (BMI) greater than
or equal to 25 kilograms/meter
2
. Obese is dened by a BMI of 30 kilograms/meter
2
or greater. The percentage of people with obesity is a subset of the percentage
of those who are overweight. See glossary for the denition of BMI. Beginning in 1999, the National Health and Nutrition Examination Survey has been in the eld
continuously with data released every 2 years. Some data have been revised and differ from previous editions of
Older Americans.
Reference population: These data refer to the civilian noninstitutionalized population.
SOURCE: Centers for Disease Control and Prevention, National Center for Health Statistics, National Health and Nutrition Examination Survey.

130
Tables
INDICATOR 28: Cigarette Smoking
Table 28a. Percentage of people age 65 and over who are current cigarette smokers, by sex and race, selected years, 1965–2014
Year
Men Women
Total White
Black or African
American Total White
Black or African
American
1965 28.5 27.7 36.4 9.6 9.8 7.1
1974 24.8 24.3 29.7 12.0 12.3 *8.9
1979 20.9 20.5 26.2 13.2 13.8 *8.5
1983 22.0 20.6 38.9 13.1 13.2 *13.1
1985 19.6 18.9 27.7 13.5 13.3 14.5
1987 17.2 16.0 30.3 13.7 13.9 11.7
1988 18.0 16.9 29.8 12.8 12.6 14.8
1990 14.6 13.7 21.5 11.5 11.5 11.1
1991 15.1 14.2 24.3 12.0 12.1 9.6
1992 16.1 14.9 28.3 12.4 12.6 *11.1
1993 13.5 12.5 *27.9 10.5 10.5 *10.2
1994 13.2 11.9 25.6 11.1 11.1 13.6
1995 14.9 14.1 28.5 11.5 11.7 13.3
1997 12.8 11.5 26.0 11.5 11.7 10.7
1998 10.4 10.0 16.3 11.2 11.2 11.5
1999 10.5 10.0 17.3 10.7 10.5 13.5
2000 10.2 9.8 14.2 9.3 9.1 10.2
2001 11.5 10.7 21.1
†9.1 9.4
9.3
2002 10.1 9.3 19.4 8.6 8.5 9.4
2003 10.1 9.6 18.0 8.3 8.4 8.0
2004 9.8 9.4 14.1 8.1 8.2 6.7
2005 8.9 7.9 16.8 8.3 8.4 10.0
2006 12.6 12.6 16.0 8.3 8.4 9.3
2007 9.3 8.9 14.3 7.6 8.0 6.4
2008 10.5 9.9 17.5 8.3 8.6 8.1
2009 9.5 9.3 14.0 9.5 9.6 11.5
2010 9.7 9.6 10.0 9.3 9.4 9.4
2011 8.9 8.7 13.7 7.1 7.0 9.1
2012 10.6 10.3 17.4 7.5 7.5 9.1
2013 10.6 10.0 15.5 7.5 7.9 6.5
2014 9.8 9.4 13.9 7.5 7.6 8.2
* Estimates are considered unreliable. Data preceded by an asterisk have a relative standard error of 20 to 30 percent.
† The value for all women includes other races who may have very low rates of cigarette smoking. Thus, the weighted average for all women is lower than that for the
race groups shown in the table.
NOTE: Questions concerning cigarette smoking differed slightly on the National Health Interview Survey across the years for which data are shown. Data starting in
1997 are not strictly comparable with data for earlier years due to the 1997 National Health Interview Survey (NHIS) questionnaire redesign. Total includes all other
races not shown separately. See data sources for the denition of race and Hispanic origin in the NHIS. For details, see
Health, United States, 2015,
Appendix II.
Reference population: These data refer to the civilian noninstitutionalized population.
SOURCE: Centers for Disease Control and Prevention, National Center for Health Statistics, National Health Interview Survey.

131
Tables
INDICATOR 28: Cigarette Smoking
Table 28b. Percentage distribution of people age 18 and over, by cigarette smoking status, sex, and age group, 2014
Sex and age group
Current smokers
Former smokers Non-smokersTotal Every day smokers Some day smokers
Both sexes 16.8 12.9 3.9 21.9 61.3
Men
18–44 21.7 15.0 6.7 14.7 63.6
45–64 19.4 15.5 3.8 27.8 52.8
65 and over 9.8 8.0 1.7 49.6 40.6
Women
18–44 16.6 12.9 3.7 11.3 72.1
45–64 16.8 13.8 3.0 22.0 61.2
65 and over 7.5 6.2 1.3 30.3 62.2
NOTE: Current cigarette smokers were dened as ever smoking 100 cigarettes in their lifetime and smoking now, every day or some days. Former smokers smoked
at least 100 cigarettes in their lifetime but do not currently smoke. Non-smokers had never smoked or smoked fewer than 100 cigarettes in their lifetime. The sum of
every day smokers and some day smokers may not equal total smokers due to rounding.
Reference population: These data refer to the civilian noninstitutionalized population.
SOURCE: Centers for Disease Control and Prevention, National Center for Health Statistics, National Health Interview Survey.
Table 28c. Percentage of people age 65 and over who are current cigarette smokers, by sex and poverty status, 2014
Sex All
Poverty threshold
Below 100 percent 100–199 percent 200 percent or more
Both sexes 8.5 13.9 11.3 6.9
Men 9.8 21.1 14.0 7.5
Women 7.5 9.5 9.7 6.3
NOTE: Current cigarette smokers were dened as ever smoking 100 cigarettes in their lifetime and smoking now, every day or some days. Poverty status is calculated
according to the U.S. Census Bureau thresholds for the corresponding year. See glossary for denition of poverty.
Reference population: These data refer to the civilian noninstitutionalized population.
SOURCE: Centers for Disease Control and Prevention, National Center for Health Statistics, National Health Interview Survey.

132
Tables
INDICATOR 29: Use of Health Care Services
Table 29a. Use of Medicare-covered health care services per 1,000 Medicare beneciaries age 65 and over, 1992–2013
Year
Utilization measure
Average length
of hospital stay
Hospital
stays
Skilled nursing
facility stays
Physician visits
and consultations
Home health
care visits
Number per 1,000 Days
1992 306 28 — 3,822 8.4
1993 300 33 — 4,648 8.0
1994 331 43 — 6,352 7.5
1995 336 50 — 7,608 7.0
1996 341 59 — 8,376 6.6
1997 351 67 — 8,227 6.3
1998 354 69 — 5,058 6.1
1999 365 67 11,395 3,708 6.0
2000 361 67 11,490 2,913 6.0
2001 364 69 11,546 2,295 5.9
2002 361 72 12,232 2,358 5.9
2003 359 74 12,662 2,440 5.8
2004 353 75 12,730 2,594 5.7
2005 350 79 13,302 2,770 5.7
2006 343 80 13,193 3,072 5.6
2007 336 81 14,599 3,409 5.6
2008 331 82 14,839 3,609 5.6
2009 320 80 14,975 3,864 5.4
2010 338 80 15,045 3,687 5.3
2011 307
79 14,767 3,555 5.3
2012 291 75 14,635 3,321 5.2
2013 276 73 14,587 3,276 5.3
— Data not available.
NOTE: Data are for Medicare beneciaries in fee-for-service only. Physician visits and consultations include all settings, such as physician ofces, hospitals, emergency
rooms, and nursing homes. The database used to generate rates of physician visits and consultations in previous
Older Americans
reports is no longer available. This
table uses two different databases based on availability of data to estimate rates of physician visits and consultations. The rst database provides data from 1999
through 2006, and the second database has data beginning with 2007. A comparison of overlapping years shows that the two databases yield slightly different rates.
As a result, some data for 2007–2009 have been revised and differ from previous editions of
Older Americans.
Beginning in 1994, managed care beneciaries were
excluded from the denominator of all utilization rates because utilization data are not available for them. Prior to 1994, managed care beneciaries were included in
the denominators; they made up 7 percent or less of the Medicare population. See glossary for denition of fee-for-service.
Reference population: These data refer to Medicare beneciaries.
SOURCE: Centers for Medicare & Medicaid Services, Medicare claims and enrollment data.
Table 29b. Use of Medicare-covered home health care and skilled nursing facility services per 1,000 Medicare beneciaries age 65 and
over, by age group, 2013
Utilization measure 65–74 75–84 85 and over
Number per 1,000
Skilled nursing facility stays 67 185 204
Home health care visits 1,475 4,129 8,604
NOTE: Data are for Medicare beneciaries in fee-for-service only.
Reference population: These data refer to Medicare beneciaries.
SOURCE: Centers for Medicare & Medicaid Services, Medicare claims and enrollment data.

133
Tables
INDICATOR 30: Health Care Expenditures
Table 30a. Average annual health care costs, in 2012 dollars, for Medicare beneciaries age 65 and over, by age group, 1992–2012
Age group 1992 1993 1994 1995 1996 1997 1998 1999 2000 2001 2002
(Average cost in 2012 dollars)
Total $15,801 $16,524 $17,443 $17,819 $17,551 $17,558 $16,907 $17,020 $17,086 $17,535 $18,521
65–74 11,759 11,986 12,888 12,966 12,704 12,405 11,828 12,922 12,724 13,332 14,275
75–84 17,291 18,887 19,319 19,499 19,756 19,506 18,809 18,048 18,625 19,500 20,112
85 and over 30,563 30,913 32,688 33,707 32,134 31,813 31,587 29,890 29,457 29,255 30,024
2003 2004 2005 2006 2007 2008 2009 2010 2011 2012
(Average cost in 2012 dollars)
Total $18,279 $18,083 $18,523 $18,342 $17,668 $16,752 $16,954 $17,211 $16,350 $16,970
65–74 13,842 13,441 13,984 13,727 13,207 12,576 12,967 12,765 12,331 13,206
75–84 20,428 19,692 20,473 20,499 19,813 19,365 18,972 20,020 18,786 19,311
85 and over 28,723 30,350 29,393 28,780 28,141 25,265 26,122 26,564 25,304 25,900
NOTE: Data include both out-of-pocket costs and costs covered by insurance. Dollars are ination adjusted to 2012 using the Consumer Price Index (Series CPI-U-RS).
Some data have been revised from previously published tables as a result of a CPI adjustment.
Reference population: These data refer to Medicare beneciaries.
SOURCE: Centers for Medicare & Medicaid Services, Medicare Current Beneciary Survey, Cost and Use.
Table 30b. Total amount and percentage distribution of annual health care costs among Medicare beneciaries age 65 and over, by
major cost component, 2008 and 2012
Major cost component
2008 2012
Total dollars Percent Total dollars Percent
Total $593,814,582,768 100 $718,814,057,899 100
Inpatient hospital 144,225,616,200 24 157,288,552,385 22
Physician/outpatient hospital 214,888,544,309 36 253,728,764,587 35
Nursing home/long-term institution 72,458,957,283 12 88,104,428,735 12
Home health care 19,976,448,445 3 23,853,729,622 3
Prescription drugs 90,800,824,928 15 121,139,985,089 17
Other (short-term institution/hospice/dental) 51,464,191,603 9 74,698,597,482 10
NOTE: Data include both out-of-pocket costs and costs covered by insurance. Dollars are not ination adjusted. Estimates may not sum to the totals because of
rounding.
Reference population: These data refer to Medicare beneciaries.
SOURCE: Centers for Medicare & Medicaid Services, Medicare Current Beneciary Survey, Cost and Use.

134
Tables
INDICATOR 30: Health Care Expenditures
Table 30c. Average annual health care costs among Medicare beneciaries age 65 and over, by selected characteristics, 2012
Selected characteristic Cost
Total $16,970
Race and ethnicity
Non-Hispanic White 16,862
Non-Hispanic Black 18,962
Hispanic 17,002
Other 15,512
Institutional status
Community 13,831
Long-term care facility 71,739
Annual income
Under $10,000 24,596
$10,000–$20,000 19,937
$20,001–$30,000 15,662
$30,001 and over 14,687
Number of chronic conditions
0 6,533
1–2 11,445
3–4 18,931
5 and over 30,253
Veteran status (men only)
Yes 16,274
No 16,997
NOTE: Data include both out-of-pocket costs and costs covered by insurance. See data sources for the denition of race and Hispanic origin in the Medicare Current
Beneciary Survey. Chronic conditions include cancer (other than skin cancer), stroke, diabetes, heart disease, hypertension, arthritis, and respiratory conditions
(emphysema/asthma/chronic obstructive pulmonary disease). Annual income includes that of respondent and spouse.
Reference population: These data refer to Medicare beneciaries.
SOURCE: Centers for Medicare & Medicaid Services, Medicare Current Beneciary Survey, Cost and Use.

135
Tables
INDICATOR 30: Health Care Expenditures
Table 30d. Average annual health care costs among Medicare beneciaries age 65 and over, by age group and major cost
component, 2012
Major cost component 65–74 75–84 85 and over
Total $13,206 $19,311 $25,900
Inpatient hospital 2,813 4,579 4,651
Physician/outpatient hospital 2,718 3,218 3,082
Nursing home/long-term institution 718 1,856 7,175
Home health care 245 755 1,241
Prescription drugs 2,764 3,061 2,356
Other (short-term institution/hospice/dental) 332 650 1,303
NOTE: Data include both out-of-pocket costs and costs covered by insurance.
Reference population: These data refer to Medicare beneciaries.
SOURCE: Centers for Medicare & Medicaid Services, Medicare Current Beneciary Survey, Cost and Use.
Table 30e. Percentage of noninstitutionalized Medicare beneciaries age 65 and over who reported problems with access
to health care, 1992–2012
Problem with access to health care 1992 1993 1994 1995 1996 1997 1998 1999 2000 2001 2002
Difculty obtaining care 3.1 2.6 2.6 2.6 2.3 2.4 2.4 2.8 2.9 2.8 2.5
Delayed getting care due to cost 9.8 9.1 7.6 6.8 5.5 4.8 4.4 4.7 4.8 5.1 6.1
2003 2004 2005 2006 2007 2008 2009 2010 2011 2012
Difculty obtaining care 2.3 2.3 2.5 2.8 2.7 2.6 2.8 3.0 3.1 2.7
Delayed getting care due to cost 5.3 5.3 4.8 5.3 4.6 5.2 4.6 5.8 6.4 6.3
Reference population: These data refer to noninstitutionalized Medicare beneciaries.
SOURCE: Centers for Medicare & Medicaid Services, Medicare Current Beneciary Survey, Cost and Use and Access to Care.

136
Tables
INDICATOR 31: Prescription Drugs
Table 31a. Average prescription drug costs, in 2012 dollars, among noninstitutionalized Medicare beneciaries age 65 and over, by
sources of payment, 1992–2012
Sources of
payment 1992 1993 1994 1995 1996 1997 1998 1999 2000 2001 2002
Total $1,041 $1,348 $1,401 $1,435 $1,508 $1,612 $1,840 $2,018 $2,233 $2,434 $2,658
Out-of-pocket 626 783 762 753 749 799 851 887 937 973 1,049
Private 265 338 385 424 501 526 644 706 778 847 968
Public 150 226 255 259 258 288 345 425 519 614 641
2003 2004 2005 2006 2007 2008 2009 2010 2011 2012
Total $2,793 $2,919 $3,287 $3,098 $3,054 $3,022 $3,272 $3,077 $3,024 $3,201
Out-of-pocket 1,047 1,057 1,169 910 750 707 751 712 709 719
Private 1,063 1,122 1,348 992 757 717 733 625 573 563
Public 683 740 770 1,196 1,547 1,598 1,788 1,740 1,742 1,919
NOTE: Dollars have been ination adjusted to 2012 using the Consumer Price Index (Series CPI-U-RS). Some data have been revised from previously published tables
as a result of a CPI adjustment. Reported costs have been adjusted to account for underreporting of prescription drug use. The adjustment factor changed in 2006
with the initiation of the Medicare Part D prescription drug program. Public programs include Medicare, Medicaid, Department of Veterans Affairs, and other State
and Federal programs.
Reference population: These data refer to noninstitutionalized Medicare beneciaries.
SOURCE: Centers for Medicare & Medicaid Services, Medicare Current Beneciary Survey, Cost and Use.
Table 31b. Percentage distribution of annual prescription drug costs among noninstitutionalized Medicare beneciaries age 65 and
over, 2012
Cost in dollars Percent of beneciaries
Total 100.0
$0 5.4
1–499 22.8
500–999 13.4
1,000–1,499 9.0
1,500–1,999 6.9
2,000–2,499 5.6
2,500–2,999 5.4
3,000–3,499 4.2
3,500–3,999 3.4
4,000–4,499 3.1
4,500–4,999 2.4
5,000 or more 18.3
NOTE: Reported costs have been adjusted to account for underreporting of prescription drug use.
Reference population: These data refer to noninstitutionalized Medicare beneciaries.
SOURCE: Centers for Medicare & Medicaid Services, Medicare Current Beneciary Survey, Cost and Use.

137
Tables
INDICATOR 31: Prescription Drugs
Table 31c. Number of Medicare beneciaries age 65 and over who enrolled in Part D prescription drug plans or who were covered by
retiree drug subsidy payments, 2006 and 2014
Part D benet categories 2006 2014
All Medicare beneciaries age 65 and over 36,454,840 45,312,272
Enrollees in prescription drug plans 16,935,231 31,090,534
Type of plan
Stand-alone plan 11,345,012 18,834,209
Medicare Advantage plan 5,590,219 12,256,326
Low-income subsidy
Yes 5,560,171 6,869,995
No 11,375,060 24,220,540
Retiree drug subsidy 6,548,138 2,569,243
Other 12,971,471 11,652,495
NOTE: Some data for 2006 have been revised and differ from previous editions of
Older Americans.
Reference population: These data refer to Medicare beneciaries.
SOURCE: Centers for Medicare & Medicaid Services, Medicare claims and enrollment data.
Table 31d. Average prescription drug costs among noninstitutionalized Medicare beneciaries age 65 and over, by selected
characteristics, selected years 2000–2012
Selected characteristic 2000 2004 2008 2012
Number of chronic conditions
0 $837 $1,108 $1,312 $1,389
1–2 1,752 2,412 2,427 2,559
3–4 3,085 3,942 3,895 4,488
5 and over 4,212 5,351 5,651 8,263
Annual income
Under $10,001 2,102 2,685 3,764 4,043
$10,001–$20,000 2,130 2,882 3,090 3,447
$20,001–$30,000 2,387 2,962 2,942 2,894
$30,001 and over 2,310 3,033 2,843 3,068
NOTE: Dollars have been ination adjusted to 2012 using the Consumer Price Index (Series CPI-U-RS). Some data have been revised from previously published tables
as a result of a CPI adjustment. Reported costs have been adjusted to account for underreporting of prescription drug use. Chronic conditions include cancer (other
than skin cancer), stroke, diabetes, heart disease, hypertension, arthritis, and respiratory conditions (emphysema/asthma/chronic obstructive pulmonary disease).
Annual income includes that of respondent and spouse.
Reference population: These data refer to noninstitutionalized Medicare beneciaries.
SOURCE: Centers for Medicare & Medicaid Services, Medicare Current Beneciary Survey, Cost and Use.

138
Tables
INDICATOR 32: Sources of Health Insurance
Table 32a. Percentage of noninstitutionalized Medicare beneciaries age 65 and over with supplemental health insurance, by type of
insurance, 1991–2013
Type of insurance 1991 1992 1993 1994 1995 1996 1997 1998 1999 2000 2001 2002
Private (employer- or
union-sponsored) 40.7 41.0 40.8 40.3 39.1 37.8 37.6 37.0 35.8 35.9 36.0 36.1
Private (Medigap)
a
44.8 45.0 45.3 45.2 44.3 38.6 35.8 33.9 33.2 33.5 34.5 37.5
Medicare Advantage/
Capitated Payment
Plans 6.3 5.9 7.7 9.1 10.9 13.8 16.6 18.6 20.5 20.4 18.0 15.5
Medicaid 8.9 9.0 9.4 9.9 10.1 9.5 9.4 9.6 9.7 9.9 10.6 10.7
TRICARE — — — — — — — — — — — —
Other public 4.0 5.3 5.8 5.5 5.0 4.8 4.7 4.8 5.1 4.9 5.4 5.5
No supplement 11.3 10.4 9.7 9.3 9.1 9.4 9.2 8.9 9.0 9.7 10.1 12.3
2003 2004 2005 2006 2007 2008 2009 2010 2011 2012 2013
Private (employer- or
union-sponsored) 36.1 36.6 36.1 34.9 35.3 34.2 32.5 31.6 29.8 29.4 28.0
Private (Medigap)
a
34.3 33.7 34.6 32.5 31.5 29.5 27.8 26.5 26.4 25.4 25.4
Medicare Advantage/
Capitated Payment
Plans 14.8 15.6 15.5 20.7 21.5 23.2 28.5 29.2 31.3 32.3 33.8
Medicaid 11.6 11.3 11.8 11.9 11.9 11.7 11.8 12.5 12.9 13.1 12.8
TRICARE 4.5 4.2 5.1 5.2 5.1 5.4 5.2 5.0 4.9 5.2 5.0
Other public 5.7 5.2 5.6 4.3 4.0 3.9 3.6 3.3 3.2 2.7 2.3
No supplement 9.1 9.7 8.9 9.4 10.5 10.5 9.3 9.9 10.0 10.6 10.8
— Not available.
a
Includes people with private supplement of unknown sponsorship.
NOTE: Medicare Advantage/Capitated Payment Plans include Health Maintenance Organizations (HMOs), Preferred Provider Organizations (PPOs), and private fee-
for-service (PFFS) plans. Not all types of plans were available in all years. Since 2003 these types of plans have been known collectively as Medicare Advantage and/
or Medicare Part C. Estimates are based on beneciaries’ insurance status in the fall of each year. Categories are not mutually exclusive (i.e., individuals may have
more than one supplemental policy). Table excludes beneciaries whose primary insurance is not Medicare (approximately 1 to 3 percent of beneciaries). Medicaid
coverage was determined from both survey responses and Medicare administrative records. TRICARE coverage was added to Medicare Current Beneciary Survey
Access to Care les beginning in 2003. Previous versions of the
Older Americans
did not include data on TRICARE coverage. Adding TRICARE coverage to the table
changes the percentage of beneciaries in the “No supplement” group. Some data for 2009 have been revised and differ from previous editions of
Older Americans.
Reference population: These data refer to noninstitutionalized Medicare beneciaries.
SOURCE: Centers for Medicare & Medicaid Services, Medicare Current Beneciary Survey, Access to Care.

139
Tables
INDICATOR 32: Sources of Health Insurance
Table 32b. Percentage of people ages 55–64 with health insurance coverage, by poverty status and type of insurance, 2014
Type of insurance Total
Poverty threshold
Below 100 percent 100–199 percent 200 percent or more
Private 71.7 18.5 42.3 85.3
Medicaid 9.7 43.6 19.4 2.9
Medicare 5.0 8.8 13.3 2.8
Other coverage 3.8 4.4 4.7 3.6
Uninsured 9.7 24.6 20.3 5.4
NOTE: Classication of health insurance is based on a hierarchy of mutually exclusive categories. People with more than one type of health insurance were assigned
to the rst appropriate category in the hierarchy. The “uninsured” category includes people who had no coverage as well as those who only had Indian Health Service
coverage or had only a private plan that paid for one type of service such as accidents or dental care. See glossary for denition of poverty.
Reference population: These data refer to the civilian noninstitutionalized population.
SOURCE: Centers for Disease Control and Prevention, National Center for Health Statistics, National Health Interview Survey.
Table 32c. Percentage of people ages 55–64 with health insurance coverage, by type of insurance, 2010–2014
Year Private Medicaid Medicare Other coverage Uninsured
2010 71.8 6.5 4.4 4.5 12.8
2011 71.2 6.8 4.7 4.3 13.0
2012 70.4 7.5 4.8 4.0 13.2
2013 69.1 7.9 5.5 4.0 13.5
2014 71.7 9.7 5.0 3.8 9.7
NOTE: Classication of health insurance is based on a hierarchy of mutually exclusive categories. People with more than one type of health insurance were assigned
to the rst appropriate category in the hierarchy. The “uninsured” category includes people who had no coverage as well as those who only had Indian Health Service
coverage or had only a private plan that paid for one type of service such as accidents or dental care.
Reference population: These data refer to the civilian noninstitutionalized population.
SOURCE: Centers for Disease Control and Prevention, National Center for Health Statistics, National Health Interview Survey.

140
Tables
INDICATOR 33: Out-of-Pocket Health Care Expenditures
Table 33a. Percentage of people age 55 and over with out-of-pocket expenditures for health care service use, by age group, 1977,
1987, 1996, and 2000–2013
Age group 1977 1987 1996 2000 2001 2002 2003 2004 2005 2006 2007 2008 2009 2010 2011 2012 2013
55–64 81.9 84.0 89.6 90.2 90.4 90.9 90.4 90.0 90.5 88.9 89.5 90.1 88.5 89.4 89.1 90.0 88.2
55–61 81.6 83.9 89.5 89.4 90.2 90.7 89.6 89.5 89.6 88.4 88.7 89.0 88.6 88.3 87.9 89.4 87.1
62–64 82.6 84.3 89.7 92.4 91.1 91.3 92.7 91.6 93.3 90.6 91.9 93.0 88.3 92.2 92.0 91.6 91.3
65 and over 83.3 88.6 92.4 93.6 94.7 94.4 94.7 95.5 95.0 95.0 94.3 95.0 94.3 93.7 94.0 94.3 92.7
65–74 83.4 87.9 91.8 93.3 94.1 94.4 93.7 95.1 94.2 94.1 93.2 94.3 93.8 93.4 93.7 93.6 92.2
75–84 83.8 90.0 92.9 93.5 95.6 94.6 95.7 95.8 96.1 96.2 95.3 95.7 94.8 94.1 94.9 95.9 94.7
85 and over 80.8 88.6 93.9 95.2 94.6 93.8 95.8
96.3 95.1 95.5 95.6 95.8 95.1 93.9 93.1 93.7 89.9
NOTE: Out-of-pocket health care expenditures exclude personal spending for health insurance premiums. Data for the 1987 survey have been adjusted to permit
comparability across years; for details, see Zuvekas and Cohen.
58
Reference population: These data refer to the civilian noninstitutionalized population.
SOURCE: Agency for Healthcare Research and Quality, Medical Expenditure Panel Survey (MEPS) and MEPS predecessor surveys.
Table 33b. Ratio of out-of-pocket expenditures to household income per person among people age 55 and over, by selected
characteristics, 1977, 1987, 1996, and 2000–2013
Selected characteristic 1977 1987 1996 2000 2001 2002 2003 2004 2005 2006 2007 2008 2009 2010 2011 2012 2013
Total
55–64 5.2 5.8 7.1 7.0 7.6 7.1 7.3 7.5 7.1 7.1 6.0 6.2 6.2 6.1 6.5 5.6 5.6
55–61 5.1 5.7 6.2 6.1 6.9 6.6 6.9 7.1 6.7 6.6 5.8 5.8 5.8 5.8 6.1 5.7 5.7
62–64 5.5 5.9 9.5 9.3 9.6 8.5 8.4 8.8 8.2 8.5 6.6 7.3 7.4 7.1 7.6 5.4 5.5
65 and over 7.2 8.8 8.4 9.1 10.0 10.8 11.6 11.6 10.9 10.0 8.6 8.4 8.1 7.8 7.1 7.0 6.5
65–74 6.4 7.2 7.7 8.1 8.7 9.5 9.2 10.7 9.2 9.1 7.2 7.0 7.0 7.4 6.3 5.9 5.3
75–84 8.8 11.0 9.0 10.4 11.4 11.9 13.4 11.8 12.5 10.5 10.0 9.5 9.3 7.5 7.7 7.2 6.9
85 and over 7.9 12.0 9.8 10.1 11.8 12.7
16.4 14.9 13.0 12.2 10.1 10.7 9.4 10.2 8.9 10.5 11.0
Income category
Poor/near poor
55–64 16.1 18.1 30.0 29.9 31.2 27.1 29.9 30.0 27.7 28.8 23.3 24.3 26.1 24.8 25.3 21.7 20.2
55–61 17.5 19.8 27.6 28.1 29.6 26.5 30.0 29.6 27.9 27.7 24.1 24.2 25.1 24.3 23.8 23.2 21.1
62–64 13.3 14.0 34.3 * 34.9 28.5 29.9 30.9 27.3 31.5 21.2 24.4 28.5 26.1 28.6 18.2 17.4
65 and over 12.3 15.8 19.2 22.6 23.5 27.6 27.8 29.3 27.6 28.1 21.9 19.4 22.4 21.4 20.5 20.0 17.5
65–74 11.0 13.7 21.6 24.4 25.7 27.7 23.4 29.0 26.2 29.4 20.2 19.4 23.3 27.1 21.0 19.5 15.3
75–84 14.4 19.0 18.3 22.9 23.3 28.4 30.2 29.4 28.6 27.9 24.5 18.3 21.5 15.3 20.2 17.5 15.9
85 and over 12.4 14.7 * 17.6 18.7 25.7 32.4 30.0 28.6 24.9 20.0 21.6
22.5 19.9 20.1 25.2 25.1
Low/middle/high
55–64 3.9 3.7 3.2 3.4 4.2 4.1 4.5 4.1 4.2 4.0 3.8 3.8 3.4 3.4 3.4 3.2 3.3
55–61 3.7 3.4 2.9 3.1 3.9 3.8 4.2 4.0 3.9 3.8 3.5 3.4 3.2 3.0 3.3 3.1 3.1
62–64 4.2 4.6 3.8 4.3 5.3 5.0 5.5 4.8 5.3 4.8 4.5 4.9 4.0 4.3 3.6 3.3 3.7
65 and over 5.4 7.0 5.6 6.3 7.3 7.2 8.0 8.1 7.4 6.0 5.6 5.9 5.2 5.2 4.7 4.5 4.5
65–74 5.0 5.9 4.9 5.6 6.2 6.4 6.9 7.4 6.2 5.2 4.9 4.8 4.3 4.3 4.1 3.9 3.8
75–84 6.2 8.4 6.3 6.9 8.4 8.2 9.1 8.2 8.8 6.5 6.1 7.2 6.2 5.8 5.2 5.0 5.1
85 and over 5.2 10.9 7.8 7.6 9.3 7.9 10.3 11.1 8.2 8.2 7.2 7.4 6.4 7.8 5.7 5.8 6.6
Health status category
Poor or fair health
55–64 8.7 8.5 13.0 14.1 13.6 13.3 13.3 13.8 12.7 13.2 10.0 11.3 9.8 10.9 12.0 9.5 10.0
55–61 8.8 9.0 11.8 12.8 12.9 12.8 12.4 13.5 11.8 12.9 9.8 10.9 10.2 10.9 11.3 10.0 11.1
62–64 8.6 7.6 15.9 17.4 15.2 14.7 15.9 14.7 15.3 14.0 10.5 12.2 8.8 11.1 13.6 8.1 7.3
65 and over 9.5 11.0 11.7 13.1 13.9 14.6 16.0 15.2 15.5 12.9 11.3 11.8 10.5 10.9 9.0 9.7 8.7
65–74 8.7 10.0 10.7 11.8 13.5 14.4 13.8 14.3 14.3 13.1 11.3 11.4 9.6 11.0 8.3 8.8 6.9
75–84 11.3 12.4 11.8 14.6 14.7 15.2 17.5 15.4 17.1 13.0 11.3 11.2 11.9 9.8 9.9 9.7 8.6
85 and over 8.9 12.2 * 13.8 13.2 13.5 19.5 17.9 14.5 12.2 11.2 14.4 10.0 13.2 9.2 11.9 13.5
See notes at end of table.

141
Tables
INDICATOR 33: Out-of-Pocket Health Care Expenditures
Table 33b. Ratio of out-of-pocket expenditures to household income per person among people age 55 and over, by selected
characteristics, 1977, 1987, 1996, and 2000–2013—continued
Selected characteristic 1977 1987 1996 2000 2001 2002 2003 2004 2005 2006 2007 2008 2009 2010 2011 2012 2013
Excellent, very good,
or good health
55–64 3.9 4.6 5.0 4.0 5.2 4.6 5.0 5.0 4.9 4.8 4.4 4.1 4.8 4.3 4.3 4.1 3.9
55–61 3.9 4.5 4.1 3.5 4.8 4.4 4.9 4.5 4.6 4.3 4.3 3.9 4.1 4.0 3.9 4.0 3.7
62–64 4.1 4.9 7.3 5.6 6.6 5.6 5.4 6.4 5.6 6.3 5.0 4.8 6.8 5.3 5.2 4.3 4.7
65 and over 6.1 7.1 6.6 6.7 7.6 8.4 8.9 9.4 8.1 8.2 7.0 6.4 6.8 6.1 6.1 5.6 5.5
65–74 5.3 5.4 6.3 6.2 6.2 7.1 6.9 8.9 6.6 7.1 5.3 5.0 5.7 5.8 5.5 4.7 4.7
75–84 7.5 9.7 7.2 7.5 9.1 9.6 10.7 9.3 9.2 8.8 9.2 8.3 7.8 6.0 6.3 5.9 6.0
85 and over 7.6 11.8 6.4 7.1 10.6 11.9
13.9 12.8 11.9 12.2 9.2 7.9 9.0 7.8 8.7 9.2 8.8
* Base is not large enough to produce reliable results.
NOTE: Out-of-pocket health care expenditures exclude personal spending for health insurance premiums. Including expenditures for out-of-pocket premiums in
the estimates of out-of-pocket spending would increase the percentage of household income spent on health care in all years. People are classied into the “poor/
near poor” income category if their household income is below 125 percent of the poverty level; otherwise, people are classied into the “low/middle/high” income
category. The poverty level is calculated according to the U.S. Census Bureau guidelines for the corresponding year. The ratio of a person’s out-of-pocket expenditures
to their household income was calculated based on the person’s per capita household income. For people whose ratio of out-of-pocket expenditures to income
exceeded 100 percent, the ratio was capped at 100 percent. For people with out-of-pocket expenditures, and with zero income (or negative income), the ratio was
set at 100 percent. For people with no out-of-pocket expenditures the ratio was set to zero. These methods differ from those used in
Older Americans 2004,
which
excluded persons with no out-of-pocket expenditures from the calculations (17 percent of the population age 65 and over in 1977, and 4.5 percent of the population
age 65 and over in 2004). Data from the 1987 survey have been adjusted to permit comparability across years; for details see Zuvekas and Cohen.
58
Reference population: These data refer to the civilian noninstitutionalized population.
SOURCE: Agency for Healthcare Research and Quality, Medical Expenditure Panel Survey (MEPS) and MEPS predecessor surveys.
Table 33c. Percentage distribution of total out-of-pocket health care expenditures among people age 55 and over, by age group and
type of health care service, 2000–2013
Year and type of health care service
55–64 65 and over
Total 55–61 62–64 Total 65–74 75–84 85 and over
2000
Hospital care 8.5 7.5 * 6.4 7.3 4.6 8.6
Ofce-based medical provider services 18.9 19.8 16.7 9.8 11.6 9.0 6.0
Dental services 20.0 21.3 17.0 15.8 17.5 15.9 9.6
Prescription drugs 44.7 44.0 46.5 53.6 57.1 51.5 48.0
Other health care 7.8 7.5 8.7 14.3 6.6 19.0 27.9
2001
Hospital care 9.8 9.4 10.7 5.4 5.2 5.8 *
Ofce-based medical provider services 19.8 19.9 19.7 9.4 10.5 9.6 6.0
Dental services 18.6 20.0 15.2 13.0 15.6 11.9 8.3
Prescription drugs 45.7 44.3 48.9 56.0 57.2 58.9 45.1
Other health care 6.1 6.4 5.5 16.2 11.5 13.8 *
2002
Hospital care 10.2 9.2 13.1 5.0 4.6 5.5 5.1
Ofce-based medical provider services 21.3 21.6 20.3 10.5 12.3 9.3 7.8
Dental services 18.1 18.3 17.7 14.0 17.6 12.3 6.2
Prescription drugs 43.8 43.5 44.7 58.2 57.9 56.6 65.5
Other health care 6.6 7.4 4.3 12.3 7.7 16.3 15.4
2003
Hospital care 9.2 8.8 10.1 5.2 5.9 4.5 5.1
Ofce-based medical provider services 18.8 18.3 19.9 8.7 9.4 9.1 5.4
Dental services 16.7 16.7 16.9 11.8 14.5 9.5 9.5
Prescription drugs 48.5 49.0 47.5 58.3 61.3 54.5 59.8
Other health care 6.8 7.3 5.6 16.0 8.9 22.4 20.2
See notes at end of table

142
Tables
INDICATOR 33: Out-of-Pocket Health Care Expenditures
Table 33c. Percentage distribution of total out-of-pocket health care expenditures among people age 55 and over, by age group and
type of health care service, 2000–2013—continued
Year and type of health care service
56–64 65 and over
Total 55–61 62–64 Total 65–74 75–84 85 and over
2004
Hospital care 9.2 10.1 6.9 5.0 5.1 4.5 *
Ofce-based medical provider services 20.1 18.7 23.6 10.1 12.4 9.2 5.3
Dental services 16.9 18.5 12.8 11.8 13.2 12.0 7.5
Prescription drugs 46.0 45.0 48.7 61.4 61.9 64.8 51.9
Other health care 7.8 7.7 8.1 11.8 7.4 9.5 29.5
2005
Hospital care 12.2 12.8 10.8 5.4 5.1 5.7 5.4
Ofce-based medical provider services 19.6 19.6 19.9 11.4 11.4 12.3 8.7
Dental services 15.7 16.3 14.3 15.3 19.4 12.6 9.8
Prescription drugs 45.9 44.7 49.0 57.8 57.9 59.1 53.3
Other health care 6.5 6.7 6.1 10.1 6.2 10.4 22.7
2006
Hospital care * 9.4 * 7.2 6.6 5.9 12.2
Ofce-based medical provider services 19.8 20.9 17.4 12.3 14.1 11.0 9.5
Dental services 13.9 15.4 10.6 16.2 19.7 15.3 7.6
Prescription drugs 43.2 48.5 32.0 51.1 51.5 53.2 45.2
Other health care 5.5 5.8 4.9 13.2 8.1 14.7 25.5
2007
Hospital care 12.4 12.6 11.9 * 4.4 * *
Ofce-based medical provider services 22.1 21.7 23.1 13.7 15.5 12.7 10.4
Dental services 21.1 21.3 20.7 18.5 21.4 16.4 14.9
Prescription drugs 38.8 38.8 38.7 47.3 49.5 45.4 45.3
Other health care 5.6 5.7 5.5 11.6 9.2 10.2 21.6
2008
Hospital care 14.2 14.7 13.3 6.3 7.3 5.9 4.5
Ofce-based medical provider services 23.1 24.0 21.4 15.0 17.3 14.9 9.3
Dental services 19.9 19.8 20.2 19.6 21.4 19.8 14.2
Prescription drugs 35.9 35.8 36.3 42.0 44.8 41.2 35.9
Other health care 6.8 5.8 8.8 17.1 9.2 18.2 36.1
2009
Hospital care 16.0 13.3 * 10.6 6.4 14.5 12.7
Ofce-based medical provider services 23.2 24.6 20.3 15.8 18.8 14.0 11.8
Dental services 21.6 23.0 18.6 18.7 23.0 15.4 15.0
Prescription drugs 32.2 32.2 32.1 41.3 44.2 40.2 36.1
Other health care 7.0 6.9 7.1 13.6 7.7 15.9 24.4
2010
Hospital care 12.2 12.6 11.4 7.9 7.8 6.8 10.8
Ofce-based medical provider services 24.7 24.4
25.4 15.8 17.5 14.6 13.0
Dental services 20.6 19.2 23.4 20.4 21.4 22.2 13.4
Prescription drugs 36.3 37.6 33.9 44.4 46.3 44.0 39.3
Other health care 6.2 6.4 5.8 11.4 7.0 12.4 23.5
See notes at end of table.

143
Tables
INDICATOR 33: Out-of-Pocket Health Care Expenditures
Table 33c. Percentage distribution of total out-of-pocket health care expenditures among people age 55 and over, by age group and
type of health care service, 2000–2013—continued
Year and type of health care service
55–64 65 and over
Total 55–61 62–64 Total 65–74 75–84 85 and over
2011
Hospital care 16.6 15.5 19.1 7.8 8.6 7.4 6.0
Ofce-based medical provider services 24.1 23.7 24.9 15.9 18.0 14.8 12.0
Dental services 18.3 18.5 18.1 20.0 20.2 24.3 11.4
Prescription drugs 34.6 35.0 33.7 40.2 42.4 41.5 30.7
Other health care 6.4 7.3 4.2 16.1 10.9 11.9 39.9
2012
Hospital care 18.0 15.5 * 9.2 10.0 8.2 *
Ofce-based medical provider services 23.7 24.3 22.4 15.6 19.7 13.5 8.6
Dental services 17.3 18.1 15.6 22.1 23.0 26.7 *
Prescription drugs 34.9 36.2 32.1 34.2 37.7 39.4 18.4
Other health care 6.2 6.0 6.5 18.8 9.5 12.2 50.8
2013
Hospital care 16.0 18.4 10.9 7.7 7.4 9.6 5.6
Ofce-based medical provider services 27.2 25.5 30.8 19.2 22.1 16.9 14.5
Dental services 18.5 17.7 20.0 21.0 23.2 23.6 10.5
Prescription drugs 30.5 29.9 31.7 33.3 35.7 35.5 22.6
Other health care 7.9 8.5 6.7 18.8 11.7 14.3 46.9
* Estimate not shown due to a relative standard error greater than 30 percent.
NOTE: Out-of-pocket health care expenditures exclude personal spending for health insurance premiums. Hospital care includes hospital inpatient care and care
provided in hospital outpatient departments and emergency rooms. Ofce-based medical provider services include services provided by medical providers in
non-hospital-based medical ofces or clinic settings. Dental services include care provided by any type of dental provider. Prescription drugs include prescribed
medications purchased, including rells. Other health care includes care provided by home health agencies and independent home health providers and expenses
for eyewear, ambulance services, orthopedic items, hearing devices, prostheses, bathroom aids, medical equipment, disposable supplies, and other miscellaneous
services. The majority of expenditures in the “other” category are for home health services and eyeglasses. Estimates might not sum to 100 percent because of
rounding.
Reference population: These data refer to the civilian noninstitutionalized population.
SOURCE: Agency for Healthcare Research and Quality, Medical Expenditure Panel Survey (MEPS).

144
Tables
INDICATOR 34:
Sources of Payment for Health Care Services
Table 34a. Average cost per beneciary and percentage distribution of sources of payment for health care services for Medicare
beneciaries age 65 and over, by type of service, 2012
Type of service
Average
cost per
beneciary
Sources of payment
Total Medicare Medicaid Out-of-pocket Other
All $16,959 100.0 59.0 6.8 17.7 16.4
Hospice 343 100.0 100.0
Inpatient hospital 3,627 100.0 87.0 0.8 *2.2 9.9
Home health care 550 100.0 76.8 ** 19.0 **
Short-term institution 933 100.0 70.4 11.9 8.8 8.8
Physician/medical 4,050 100.0 61.5 1.2 16.7 20.6
Outpatient hospital 1,801 100.0 71.8 1.4 7.3 19.6
Prescription drugs 2,793 100.0 50.5 0.3 21.3 27.8
Dental 447 100.0 1.8 ** 77.3 20.6
Long-term care facility 2,032 100.0 ** 44.3 45.0 9.7
* Estimates are considered unreliable. Data preceded by an asterisk have a relative standard error of 20 to 30 percent.
** Estimate not shown due to a relative standard error greater than 30 percent.
NOTE: “Other” refers to private insurance, Department of Veterans Affairs, uncollected liability, and other public programs. Estimates may not sum to the totals
because of rounding or suppression due to high relative standard errors.
Reference population: These data refer to Medicare beneciaries.
SOURCE: Centers for Medicare & Medicaid Services, Medicare Current Beneciary Survey, Cost and Use.
Table 34b. Average cost per beneciary and percentage distribution of sources of payment for health care services for Medicare
beneciaries age 65 and over, by income, 2012
Income
Average
cost per
beneciary
Sources of payment
Total Medicare Medicaid Out-of-pocket Other
All $16,959 100.0 59.0 6.8 17.7 16.4
Under $10,000 24,585 100.0 61.8 20.2 11.2 6.8
$10,000–$20,000 19,925 100.0 62.8 11.4 15.7 10.1
$20,001–$30,000 15,649 100.0 63.3 4.1 17.8 14.8
$30,001 and over 14,679 100.0 54.0 1.0 20.9 23.8
NOTE: Income refers to annual income of respondent and spouse. “Other” refers to private insurance, Department of Veterans Affairs, uncollected liability, and other
public programs. Estimates may not sum to the totals because of rounding.
Reference population: These data refer to Medicare beneciaries.
SOURCE: Centers for Medicare & Medicaid Services, Medicare Current Beneciary Survey, Cost and Use.

145
Tables
INDICATOR 35: Veterans’ Health Care
Table 35a. Total number of veterans age 65 and over who are enrolled in the Veterans Health Administration, by age group, 1999–2014
and projected 2019–2034
Year All ages
65 and over
Total 65–69 70–74 75–79 80–84 85 and over
Actual
1999 4,542,964 1,880,346 540,126 546,299 516,076 213,069 64,776
2004 7,356,161 3,355,949 690,284 882,646 847,977 670,116 264,926
2009 8,165,680 3,494,830 724,280 675,320 811,308 694,053 589,869
2014 9,078,615 4,317,646 1,486,698 758,428 632,674 680,238 759,608
Projected
2019 9,578,000 4,715,000 1,135,000 1,469,000 746,000 552,000 814,000
2024 9,698,000 4,875,000 1,004,000 1,116,000 1,359,000 650,000 747,000
2029 9,651,000 4,945,000 973,000 993,000 1,031,000 1,143,000 804,000
2034 9,455,000 4,863,000 913,000 966,000 921,000 861,000 1,202,000
NOTE: Department of Veterans Affairs (VA) enrollees are veterans who have signed up to receive health care from the Veterans Health Administration (VHA). Counts
for 2019–2034 are projections from the 2015 VA Enrollee Health Care Projection Model.
Reference population: These data refer to the count of unique VHA enrollees per scal year.
SOURCE: Department of Veterans Affairs, Ofce of the Assistant Deputy Under Secretary for Health for Policy and Planning, 2015 VA Enrollee Health Care Projection
Model.
Table 35b. Percentage of enrolled veterans age 65 and over with service-connected disabilities, by service-connected disability rating,
2004–2014 and projected 2019–2034
Year
70 percent or more
service-connected disability
10 percent or more
service-connected disability No service-connected disability
Actual
2004 4.5 21.8 78.2
2009 6.5 24.8 75.2
2014 13.2 35.9 64.1
Projected
2019 18.0 43.3 56.7
2024 21.4 48.2 51.8
2029 24.4 52.0 48.0
2034 27.0 55.0 45.0
NOTE: Department of Veterans Affairs (VA) enrollees service-connected disability ratings reect the severity of the disability and how much the impairment impacts
the ability to work.
Reference population: These data refer to the count of unique VHA enrollees per scal year.
SOURCE: Department of Veterans Affairs, Ofce of the Assistant Deputy Under Secretary for Health for Policy and Planning, 2015 VA Enrollee Health Care Projection
Model.

146
Tables
INDICATOR 36: Residential Services
Table 36a. Percentage distribution of Medicare beneciaries age 65 and over residing in selected residential settings, by age group,
2013
Residential setting
65 and over
Total 65–74 75–84 85 and over
Total 100.0 100.0 100.0 100.0
Traditional community 93.2 97.5 93.4 77.1
Community housing with services 2.8 1.3 3.1 8.2
Long-term care facilities 3.9 1.2 3.6 14.7
Number (in thousands) 40,700 21,800 12,900 6,000
NOTE: Community housing with services applies to respondents who reported they lived in retirement communities or apartments, senior citizen housing, continuing
care retirement facilities, assisted living facilities, staged living communities, board and care facilities/homes, and similar situations AND who reported they had
access to one or more of the following services through their place of residence: meal preparation, cleaning or housekeeping services, laundry services, or help with
medications. Respondents were asked about access to these services, but not whether they actually used the services. A residence (or unit) is considered a long-term
care facility if it is certied by Medicare or Medicaid; or has 3 or more beds, is licensed as a nursing home or other long-term care facility, and provides at least one
personal care service; or provides 24-hour, 7-day-a-week supervision by a non-family, paid caregiver.
Reference population: These data refer to Medicare beneciaries.
SOURCE: Centers for Medicare & Medicaid Services, Medicare Current Beneciary Survey, Access to Care.
Table 36b. Percentage distribution of Medicare beneciaries age 65 and over with limitations in performing activities of daily living
(ADLs) and instrumental activities of daily living (IADLs), by residential setting, 2013
Functional status Overall
Traditional
community
Community housing
with services
Long-term
care facilities
Total 100.0 100.0 100.0 100.0
No functional limitations 55.8 58.5 36.4 4.9
IADL limitation(s) only 12.2 12.1 15.0 11.7
1–2 ADL limitations 20.7 20.6 32.0 16.4
3 or more ADL limitations 11.3 8.8 16.7 67.0
NOTE: Community housing with services applies to respondents who reported they lived in retirement communities or apartments, senior citizen housing, continuing
care retirement facilities, assisted living facilities, staged living communities, board and care facilities/homes, and similar situations AND who reported they had
access to one or more of the following services through their place of residence: meal preparation, cleaning or housekeeping services, laundry services, or help with
medications. Respondents were asked about access to these services, but not whether they actually used the services. A residence (or unit) is considered a long-term
care facility if it is certied by Medicare or Medicaid; or has 3 or more beds, is licensed as a nursing home or other long-term care facility, and provides at least one
personal care service; or provides 24-hour, 7-day-a-week supervision by a non-family, paid caregiver. Long-term care facility residents with no limitations may include
individuals with limitations in performing certain IADLs, such as doing light or heavy housework or meal preparation. These questions were not asked of facility
residents.
Reference population: These data refer to Medicare beneciaries.
SOURCE: Centers for Medicare & Medicaid Services, Medicare Current Beneciary Survey, Access to Care.
Table 36c. Percent availability of specic services among Medicare beneciaries age 65 and over residing in community housing with
services, 2013
Access to service Percent
Prepared meals 86.0
Housekeeping, maid, or cleaning services 79.4
Laundry services 68.5
Help with medications 49.3
NOTE: Community housing with services applies to respondents who reported they lived in retirement communities or apartments, senior citizen housing, continuing
care retirement facilities, assisted living facilities, staged living communities, board and care facilities/homes, and similar situations AND who reported they had access
to one or more services listed in the table through their place of residence. Respondents were asked about access to these services, but not whether they actually
used the services.
Reference population: These data refer to Medicare beneciaries.
SOURCE: Centers for Medicare & Medicaid Services, Medicare Current Beneciary Survey, Access to Care.
147
Tables
INDICATOR 36: Residential Services
Table 36d. Percentage distribution of annual income of Medicare beneciaries age 65 and over, by residential setting, 2013
Income
Traditional
community
Community housing
with services
Long-term care
facilities
Total 100.0 100.0 100.0
Under $10,000 8.3 8.4 32.5
$10,001–$20,000 19.5 32.8 37.8
$20,001–$30,000 17.8 20.3 13.7
$30,001 and over 54.4 38.5 16.1
NOTE: Community housing with services applies to respondents who reported they lived in retirement communities or apartments, senior citizen housing, continuing
care retirement facilities, assisted living facilities, staged living communities, board and care facilities/homes, and similar situations AND who reported they had
access to one or more of the following services through their place of residence: meal preparation, cleaning or housekeeping services, laundry services, or help with
medications. Respondents were asked about access to these services, but not whether they actually used the services. A residence (or unit) is considered a long-term
care facility if it is certied by Medicare or Medicaid; or has 3 or more beds, is licensed as a nursing home or other long-term care facility, and provides at least one
personal care service; or provides 24-hour, 7-day-a-week supervision by a non-family, paid caregiver. Income refers to annual income of respondent and spouse.
Table excludes data for respondents who reported only that their income was greater or less than $25,000.
Reference population: These data refer to Medicare beneciaries.
SOURCE: Centers for Medicare & Medicaid Services, Medicare Current Beneciary Survey, Access to Care.
Table 36e. Characteristics of services available to Medicare beneciaries age 65 and over residing in community housing with
services, 2013
Selected characteristic Percent
Services included in housing costs 100.0
All included 46.5
Some included/some separate 41.8
All separate 11.7
Can continue living there if they need substantial services 100.0
Yes 60.7
No 39.3
NOTE: Community housing with services applies to respondents who reported they lived in retirement communities or apartments, senior citizen housing, continuing
care retirement facilities, assisted living facilities, staged living communities, board and care facilities/homes, and similar situations AND who reported they had
access to one or more of the following services through their place of residence: meal preparation, cleaning or housekeeping services, laundry services, or help with
medications. Respondents were asked about access to these services, but not whether they actually used the services.
Reference population: These data refer to Medicare beneciaries.
SOURCE: Centers for Medicare & Medicaid Services, Medicare Current Beneciary Survey, Access to Care.

148
Tables
INDICATOR 37: Personal Assistance and Equipment
Table 37a. Percentage distribution of noninstitutionalized Medicare beneciaries age 65 and over who have limitations in performing
activities of daily living (ADLs), by type of assistance, 1992–2013
Year
Personal
assistance only
Equipment
only
Personal assistance
and equipment None
1992 9.2 28.3 20.9 41.6
1993 9.0 28.6 20.8 41.5
1994 8.2 31.4 22.4 38.0
1995 8.2 32.0 22.1 37.7
1996 7.7 32.5 22.4 37.5
1997 5.6 34.2 21.4 38.8
1998 6.1 30.7 23.0 40.2
1999 6.7 34.7 19.7 39.0
2000 6.6 35.6 20.7 37.0
2001 6.3 36.3 22.0 35.3
2002 6.7 35.7 21.8 35.9
2003 6.2 34.8 22.9 36.2
2004 6.9 33.5 22.2 37.4
2005 6.6 36.3 21.9 35.2
2006 6.9 36.3 23.1 33.8
2007 6.0 37.6 22.1 34.3
2008 5.4 38.1 21.4 35.1
2009 6.4 38.4 23.4 31.8
2010 7.0 36.9 22.5 33.6
2011 5.7 38.6 22.9 32.8
2012 7.8 33.1 24.5 34.6
2013 7.0 35.3 25.4 32.4
NOTE: Limitations in performing activities of daily living (ADLs) refer to difculty performing (or inability to perform for a health reason) one or more of the following
tasks: bathing, dressing, eating, getting in/out of chairs, walking, or using the toilet. Respondents who report difculty with an activity are subsequently asked about
receiving help or supervision from another person with the activity and about using special equipment or aids. In this table, personal assistance does not include
supervision. Percentages are age adjusted using the 2000 standard population. Estimates may not sum to the totals because of rounding.
Reference population: These data refer to noninstitutionalized Medicare beneciaries who have limitations in performing one or more ADLs.
SOURCE: Centers for Medicare & Medicaid Services, Medicare Current Beneciary Survey, Access to Care.
Table 37b. Percentage distribution of noninstitutionalized Medicare beneciaries age 65 and over who have limitations in performing
activities of daily living (ADLs), by type of assistance, age group, and sex, 2013
Age group and sex
Personal
assistance only
Equipment
only
Personal assistance
and equipment None
65 and over 7.0 35.3 25.4 32.4
Men 6.2 34.6 22.9 36.2
Women 7.4 35.6 27.0 30.0
65–74 6.7 31.0 21.5 40.8
75–84 7.5 39.9 26.0 26.6
85 and over 6.5 39.9 40.5 13.2
NOTE: Limitations in performing activities of daily living (ADLs) refer to difculty performing (or inability to perform for a health reason) one or more of the following
tasks: bathing, dressing, eating, getting in/out of chairs, walking, or using the toilet. Respondents who report difculty with an activity are subsequently asked about
receiving help or supervision from another person with the activity and about using special equipment or aids. In this table, personal assistance does not include
supervision. Estimates for persons age 65 or over are age adjusted using the 2000 standard population.
Reference population: These data refer to noninstitutionalized Medicare beneciaries who have limitations in performing one or more ADLs.
SOURCE: Centers for Medicare & Medicaid Services, Medicare Current Beneciary Survey, Access to Care.

149
Tables
INDICATOR 37: Personal Assistance and Equipment
Table 37c. Percentage of noninstitutionalized Medicare beneciaries age 65 and over who have limitations in performing instrumental
activities of daily living (IADLs) and who receive personal assistance, by age group, 1992–2013
Year Total
65 and over
65–74 75–84 85 and over
1992 61.6 58.9 63.2 69.2
1993 59.6 56.6 59.4 73.3
1994 61.3 60.2 59.8 71.4
1995 61.9 59.1 64.5 66.1
1996 61.2 59.8 61.2 66.7
1997 63.6 61.8 63.2 71.1
1998 65.7 64.9 65.3 70.1
1999 62.9 61.5 62.8 68.7
2000 62.7 56.8 64.4 76.6
2001 65.2 60.9 66.5 73.7
2002 68.0 68.1 66.7 71.9
2003 66.8 66.4 65.0 72.9
2004 65.4 64.2 65.6 68.8
2005 66.4 62.7 67.4 74.0
2006 63.7 63.2 61.7 70.5
2007 66.3 65.4 66.0 69.7
2008 68.2 69.7 66.6 67.8
2009 66.2 64.8 67.3 67.6
2010 65.7 64.2 64.5 72.2
2011 67.1 65.6 66.3 72.1
2012 69.7 70.1 66.4 75.8
2013 68.1 63.3 71.2 75.8
NOTE: Limitations in performing instrumental actitivites of daily living (IADLs) refer to difculty performing (or inability to perform for a health reason) one or more of
the following tasks: using the telephone, light housework, heavy housework, meal preparation, shopping, or managing money. Respondents who report difculty with
an activity are subsequently asked about receiving help from another person with the activity. In this table, personal assistance does not include supervision or special
equipment.
Reference population: These data refer to noninstitutionalized Medicare beneciaries who have limitations in performing one or more IADLs.
SOURCE: Centers for Medicare & Medicaid Services, Medicare Current Beneciary Survey, Access to Care.
Table 37d. Percentage of noninstitutionalized Medicare beneciaries age 65 and over who have limitations in performing instrumental
activities of daily living (IADLs) and who receive personal assistance, by sex and age group, 2013
Age group Men Women
65–74 58.5 66.0
75–84 75.0 69.5
85 and over 83.8 71.7
NOTE: Limitations in performing instrumental activities of daily living (IADLs) refer to difculty performing (or inability to perform for a health reason) one or more of
the following tasks: using the telephone, light housework, heavy housework, meal preparation, shopping, or managing money. Respondents who report difculty with
an activity are subsequently asked about receiving help from another person with the activity. In this table, personal assistance does not include supervision or special
equipment.
Reference population: These data refer to noninstitutionalized Medicare beneciaries who have limitations in performing one or more IADLs.
SOURCE: Centers for Medicare & Medicaid Services, Medicare Current Beneciary Survey, Access to Care.

150
Tables
INDICATOR 38: Long-Term Care Providers
Table 38a. Number of users of long-term care services, by sector and age group, 2013 and 2014
Age group Nursing homes
Residential care
communities
Adult day
services centers
Home health
agencies Hospices
Less than 65 206,825 60,134 102,721 863,555 75,079
65–74 220,522 86,861 56,440 1,258,323 229,260
75–84 372,558 249,725 77,605 1,534,661 402,210
85 and over 569,795 439,315 45,716 1,282,996 634,151
NOTE: Long-term care services are provided by paid, regulated providers. They comprise both health care-related and non-health care-related services, including
post-acute care and rehabilitation. People can receive more than one type of service. The estimated number of users of nursing homes, residential care communities,
and adult day services centers represents participants or residents enrolled on the day of data collection in 2014. The estimated number of users of home health
agencies represents patients who ended care (i.e., were discharged) in 2013. The estimated number of users of hospice represents patients who received care at any
time in 2013. The number in each age group is calculated by applying the percentage distribution by age to the estimated total number of users. See http://www.cdc.
gov/nchs/data/series/sr_03/sr03_038.pdf for denitions.
Reference population: These data refer to the resident population.
SOURCE: Centers for Disease Control and Prevention, National Center for Health Statistics, National Study of Long-Term Care Providers.
Table 38b. Percentage of users of long-term care services needing any assistance with activities of daily living (ADLs), by sector and
activity, 2013 and 2014
Activity Nursing homes
Residential care
communities
Adult day
services centers
Home health
agencies
Bathing 96.4 62.4 41.0 96.4
Dressing 91.8 47.4 37.1 88.4
Toileting 87.9 39.3 35.6 73.2
Walking or locomotion 90.7 29.1 33.7 94.0
Transferring in/out of bed or chair 85.2 29.7 29.8 87.8
Eating 58.0 19.8 24.3 56.7
NOTE: Long-term care services are provided by paid, regulated providers. They comprise both health care-related and non-health care-related services, including
post-acute care and rehabilitation. People can receive more than one type of service. The estimated number of users of nursing homes, residential care communities,
and adult day services centers represents participants or residents enrolled on the day of data collection in 2014. The estimated number of users of home health
agencies represents patients who ended care (i.e., were discharged) in 2013. Users of formal long-term care include persons of all ages. In nursing homes, 85
percent of residents were age 65 and over. In residential care communities, 93 percent of residents were age 65 and over. In adult day services centers, 64 percent
of participants were age 65 and over. Among home health care patients, 83 percent were age 65 and over. Data were not available for hospice patients. Participants,
patients, or residents were considered needing any assistance with a given activity if they needed help or supervision from another person or used special equipment
to perform the activity. See http://www.cdc.gov/nchs/data/series/sr_03/sr03_038.pdf for denitions.
Reference population: These data refer to the resident population.
SOURCE: Centers for Disease Control and Prevention, National Center for Health Statistics, National Study of Long-Term Care Providers.

151
Tables
INDICATOR 39: Use of Time
Table 39a. Average number of hours per day and percentage of day that people age 55 and over spent doing selected activities on an
average day, by age group, 2014
Selected activity
55 and over 55–64 65–74 75 and over
Average
hours
per day
Percent
of day
Average
hours
per day
Percent
of day
Average
hours
per day
Percent
of day
Average
hours
per day
Percent
of day
Sleeping 8.73 36.4 8.43 35.1 8.88 37.0 9.16 38.2
Leisure activities 6.48 27.0 5.45 22.7 6.94 28.9 8.02 33.4
Work and work-related activities 2.37 9.9 4.02 16.8 1.32 5.5 0.33 1.4
Household activities 2.18 9.1 2.01 8.4 2.44 10.2 2.19 9.1
Caring for and helping others 0.36 1.5 0.41 1.7 0.36 1.5 0.28 1.2
Eating and drinking 1.30 5.4 1.21 5.0 1.37 5.7 1.41 5.9
Purchasing goods and services 0.84 3.5 0.82 3.4 0.90 3.8 0.81 3.4
Grooming 0.65 2.7 0.69 2.9 0.62 2.6 0.61 2.5
Other activities 1.07 4.5 0.94 3.9 1.17 4.9 1.19 5.0
NOTE: “Other activities” includes activities such as educational activities; organizational, civic, and religious activities; and telephone calls. Table includes people who
did not work at all.
Reference population: These data refer to the civilian noninstitutionalized population.
SOURCE: Bureau of Labor Statistics, American Time Use Survey.
Table 39b. Average number of hours and percentage of total leisure time that people age 55 and over spent doing selected leisure
activities on an average day, by age group, 2014
Selected leisure activity
55 and over 55–64 65–74 75 and over
Average
hours
per day
Percent
of leisure
time
Average
hours
per day
Percent
of leisure
time
Average
hours
per day
Percent
of leisure
time
Average
hours
per day
Percent
of leisure
time
Socializing and communicating 0.65 10.1 0.58 10.6 0.73 10.5 0.71 8.8
Watching TV 3.78 58.2 3.25 59.6 4.03 58.1 4.52 56.3
Participation in sports, exercise,
and recreation 0.23 3.6 0.24 4.3 0.27 3.9 0.17 2.1
Relaxing and thinking 0.40 6.2 0.30 5.6 0.35 5.0 0.69 8.7
Reading 0.61 9.4 0.37 6.8 0.63 9.1 1.09 13.5
Other leisure activities 0.81 12.5 0.71 13.0 0.93 13.4 0.85 10.5
NOTE: “Other leisure activities” includes activities such as playing games, using the computer for leisure, doing arts and crafts as a hobby, experiencing arts and
entertainment (other than sports), and engaging in related travel.
Reference population: These data refer to the civilian noninstitutionalized population.
SOURCE: Bureau of Labor Statistics, American Time Use Survey.

152
Tables
INDICATOR 40: Air Quality
Table 40a. Percentage of people age 65 and over living in counties with “poor air quality,” by selected pollutant measures, 2000–2014
Pollutant measures 2000 2001 2002 2003 2004 2005 2006 2007 2008 2009 2010 2011 2012 2013 2014
Particulate Matter (PM
2.5
) 50.1 47.7 47.1 43.0 37.8 45.6 35.5 38.4 25.7 17.7 15.0 14.1 7.2 9.4 9.1
Ozone 51.4 54.5 53.4 53.5 34.4 51.1 49.0 47.1 35.6 16.4 31.6 35.3 38.9 14.1 11.3
Any standard 65.5 64.8 62.7 63.2 54.6 62.4 59.1 57.6 45.3 27.1 38.4 40.4 41.6 21.1 16.5
NOTE: The term “poor air quality” is dened as air quality concentrations above the level of the National Ambient Air Quality Standards (NAAQS). The term “any
standard” refers to any NAAQS for ozone, particulate matter, nitrogen dioxide, sulfur dioxide, carbon monoxide, or lead. Data for previous years have been computed
using the the standards in effect as of August 2015 to enable comparisons over time. This results in percentages that are not comparable to those in previous
publications of
Older Americans.
Measuring concentrations above the level of a standard is not equivalent to violating the standard. The level of a standard may be
exceeded on multiple days before the exceedance is considered a violation of the standard.
Reference population: These data refer to the resident population.
SOURCE: U.S. Environmental Protection Agency, Ofce of Air Quality Planning and Standards, Air Quality System; U.S. Census Bureau, 2010 Population.
Table 40b. Counties with “poor air quality” for any standard in 2014
State County
Total population
(in Census 2010)
Population 65 and over
(in Census 2010)
Alaska Anchorage Municipality 291,826 21,139
Alaska Fairbanks North Star Borough 97,581 6,375
Alaska Kenai Peninsula Borough 55,400 6,276
Alaska Matanuska-Susitna Borough 88,995 7,069
Arizona Cochise County 131,346 22,688
Arizona Gila County 53,597 12,450
Arizona Maricopa County 3,817,117 462,641
Arizona Pinal County 375,770 52,071
Arizona Santa Cruz County 47,420 6,224
Arizona Yavapai County 211,033 50,767
Arizona Yuma County 195,751 30,646
California Alameda County 1,510,271 167,746
California El Dorado County 181,058 26,524
California Fresno County 930,450 93,421
California Imperial County 174,528 18,152
California Inyo County 18,546 3,535
California Kern County 839,631 75,437
California Kings County 152,982 12,030
California Los Angeles County 9,818,605 1,065,699
California Madera County 150,865 17,262
California Mariposa County 18,251 3,821
California Merced County 255,793 23,960
California Mono County 14,202 1,377
California Nevada County 98,764 19,174
California Orange County 3,010,232 349,677
California Placer County 348,432 53,562
California Plumas County 20,007 4,154
See notes at end of table.

153
Tables
INDICATOR 40: Air Quality
Table 40b. Counties with “poor air quality” for any standard in 2014—continued
State County
Total population
(in Census 2010)
Population 65 and over
(in Census 2010)
California Riverside County 2,189,641 258,586
California Sacramento County 1,418,788 158,551
California San Bernardino County 2,035,210 181,348
California San Diego County 3,095,313 351,425
California San Joaquin County 685,306 71,181
California San Luis Obispo County 269,637 41,022
California Santa Barbara County 423,895 54,398
California Siskiyou County 44,900 8,782
California Stanislaus County 514,453 54,831
California Tehama County 63,463 10,071
California Tulare County 442,179 41,779
California Ventura County 823,318 96,309
Colorado Alamosa County 15,445 1,752
Colorado Jefferson County 534,543 67,411
Colorado Prowers County 12,551 1,835
Connecticut Faireld County 916,829 124,075
Connecticut Hartford County 894,014 130,119
Connecticut Middlesex County 165,676 25,621
Connecticut Tolland County 152,691 18,220
Georgia Rockdale County 85,215 9,066
Hawaii Hawaii County 185,079 26,834
Idaho Lemhi County 7,936 1,758
Idaho Shoshone County 12,765 2,537
Illinois Tazewell County 135,394 21,139
Indiana Daviess County 31,648 4,461
Indiana Gibson County 33,503 5,122
Indiana Marion County 903,393 96,102
Indiana Morgan County 68,894 8,919
Indiana Pike County 12,845 2,175
Indiana Vigo County 107,848 14,511
Iowa Linn County 211,226 27,488
Iowa Muscatine County
42,745 5,843
Kentucky Jefferson County 741,096 99,095
Louisiana St. Bernard Parish 35,897 3,288
Michigan Allegan County 111,408 14,438
Missouri Iron County 10,630 1,899
Missouri Jackson County 674,158 83,990
Missouri Jefferson County 218,733 24,394
Missouri St. Louis city 319,294 35,175
Montana Yellowstone County 147,972 20,868
Nevada Clark County 1,951,269 220,445
Nevada Nye County 43,946 10,301
Nevada Washoe County 421,407 50,879
New Jersey Warren County 108,692 15,292
New Mexico Bernalillo County 662,564 81,014
New Mexico Doña Ana County 209,233 25,881
New Mexico Luna County 25,095 4,907
See notes at end of table.

154
Tables
INDICATOR 40: Air Quality
Table 40b. Counties with “poor air quality” for any standard in 2014—continued
State County
Total population
(in Census 2010)
Population 65 and over
(in Census 2010)
North Dakota Williams County 22,398 3,328
Ohio Cuyahoga County 1,280,122 198,541
Ohio Hamilton County 802,374 106,863
Ohio Morgan County 15,054 2,611
Oklahoma Adair County 22,683 2,934
Oklahoma Love County 9,423 1,618
Oregon Crook County 20,978 4,203
Oregon Lake County 7,895 1,612
Oregon Lane County 351,715 52,781
Pennsylvania Allegheny County 1,223,348 205,059
Pennsylvania Beaver County 170,539 31,660
Pennsylvania Delaware County 558,979 79,726
Pennsylvania Lancaster County 519,445 77,780
Pennsylvania Lebanon County 133,568 22,729
Pennsylvania Philadelphia County 1,526,006 185,309
Pennsylvania Warren County 41,815 7,840
Pennsylvania Washington County 207,820 36,366
Tennessee Sullivan County 156,823 29,215
Texas Denton County 662,614 46,043
Texas Tarrant County 1,809,034 161,385
Utah Cache County 112,656 8,694
Utah Davis County 306,479 24,992
Utah Salt Lake County 1,029,655 89,367
Utah Uintah County 32,588 2,997
Utah Utah County 516,564 33,457
Wisconsin Brown County 248,007 28,789
Wisconsin Kenosha County 166,426 18,679
Wisconsin Oneida County 35,998 7,800
Wyoming Carbon County 15,885 2,044
Wyoming Sweetwater County 43,806 3,643
Puerto Rico Arecibo Municipio, Puerto Rico 96,440 15,727
NOTE: The term “poor air quality” is dened as air quality concentrations above the level of the National Ambient Air Quality Standards (NAAQS). The term “any
standard” refers to any NAAQS for ozone, particulate matter, nitrogen dioxide, sulfur dioxide, carbon monoxide, or lead. Measuring concentrations above the level of
a standard is not equivalent to violating the standard. The level of a standard may be exceeded on multiple days before the exceedance is considered a violation of
the standard.
Reference population: These data refer to the resident population.
SOURCE: U.S. Environmental Protection Agency, Ofce of Air Quality Planning and Standards, Air Quality System; U.S. Census Bureau, 2010 Population.

155
Tables
INDICATOR 41: Transportation
Table 41. Percentage of noninstitutionalized Medicare beneciaries age 65 and over who made a change in transportation mode due to
a health or physical problem, by age group and type of change, 2013
Type of change
65 and over
Total 65–74 75–84 85 and over
Limits driving to daytime 33.4 24.8 39.2 55.3
Has given up driving altogether 19.1 11.3 21.2 46.5
Has trouble getting places 24.5 18.5 26.5 44.6
Has reduced travel 33.8 25.9 37.3 58.4
Reference population: These data refer to noninstitutionalized Medicare beneciaries.
SOURCE: Centers for Medicare & Medicaid Services, Medicare Current Beneciary Survey, Access to Care.

156
Tables
SPECIAL FEATURE: Informal Caregiving
Table CG1. Number of informal caregivers, by age group and sex, 2011
Sex Less than 45 45–54 55–64 65–74 75 and over
Number (in thousands)
Total 2,738 4,358 4,960 3,464 2,428
Men 999 1,727 1,512 1,412 1,204
Women 1,740 2,631 3,449 2,052 1,224
Reference population: People of all ages who, in the last month, helped with one or more self-care, household, or medical activities for a Medicare enrollee age 65 or
over who had a chronic disability.
SOURCE: National Study on Caregiving.
Table CG2. Number of informal caregivers and percentage distribution of caregiving hours provided, by relationship to care recipient,
2011
Relationship to care recipient
Number of caregivers
(in thousands)
Percentage of
caregivers
Number of aggregate
monthly hours
(in thousands)
Percentage of
caregiving hours
Total 17,949 100.0 1,342,520 100.0
Spouse 3,802 21.2 417,018 31.1
Daughter 5,263 29.3 411,138 30.6
Son 3,287 18.3 213,530 15.9
Other relative 4,011 22.3 245,508 18.3
Non-relative 1,586 8.8 55,326 4.1
NOTE: Estimates may not sum to the totals because of rounding.
Reference population: People of all ages who, in the last month, helped with one or more self-care, household, or medical activities for a Medicare enrollee age 65 or
over who had a chronic disability.
SOURCE: National Study on Caregiving.

157
Tables
SPECIAL FEATURE: Informal Caregiving
Table CG3. Percentage of caregivers providing assistance, by sex of caregiver and type of assistance, 2011
Type of assistance Total Men Women
Self care 49.3 45.5 51.6
Mobility 71.6 76.4 68.7
Transportation 86.4 86.4 86.3
Medical or health care 57.1 55.4 58.1
NOTE: Respondents reported whether they helped with different types of activities. Self-care activities include bathing, dressing, eating, and toileting. Mobility-related
activities include getting out of bed, getting around inside one’s home or building, and leaving one’s home or building. Health or medical care tasks were assistance
with diet, foot care, giving injections, and managing medical tasks, such as ostomy care, IV therapy assistance, or blood tests.
Reference population: People of all ages who, in the last month, helped with one or more self-care, household, or medical activities for a Medicare enrollee age 65 or
over who had a chronic disability.
SOURCE: National Study on Caregiving.
Table CG4. Percentage of caregiver recipients, caregivers, and hours of help provided, by level of assistance needed by care recipients,
2011
Level of assistance Care recipients Caregivers Hours of help
Household activities only 33.3 31.1 21.2
1–2 self-care/mobility tasks 39.4 38.0 32.4
3 or more self-care/mobility tasks 27.3 30.9 46.4
Reference population: People of all ages who, in the last month, helped with one or more self-care, household, or medical activities for a Medicare enrollee age 65 or
over who had a chronic disability.
SOURCE: National Study on Caregiving.
Table CG5. Percentage of informal caregivers reporting positive and negative aspects of caregiving, by level of impact, 2011
Aspects of caregiving
Level of impact
Some Substantial
Positive aspects
More condent about abilities 34.8 45.5
Brought you closer to care receipient 21.2 68.7
Satised that recipient is well-cared for 12.5 86.3
Negative aspects
Financial difculties 11.4 6.6
Emotional difculties 23.7 13.5
Physical difculties 11.8 6.3
Have more things than you can handle 27.1 18.8
Don't have time for yourself 26.4 15.1
Reference population: People of all ages who, in the last month, helped with one or more self-care, household, or medical activities for a Medicare enrollee age 65 or
over who had a chronic disability.
SOURCE: National Study on Caregiving.

158

Data Sources

160
Data Sources
Air Quality System
e Air Quality System (AQS) contains ambient air
pollution data collected by the U.S. Environmental
Protection Agency (EPA) and state, local, and tribal air
pollution control agencies. Data on criteria pollutants
consist of air quality measurements collected by sensitive
equipment at thousands of monitoring stations located
across all 50 states plus the District of Columbia,
Puerto Rico, and the U.S. Virgin Islands. Each monitor
measures the concentration of a particular pollutant in
the air. Monitoring data indicate the average pollutant
concentration during a specied time interval (usually
1hour or 24 hours). AQS also contains meteorological
data, descriptive information about each monitoring
station (including its geographic location and its operator),
and data quality assurance or quality control information.
e system is administered by EPA, Oce of Air Quality
Planning and Standards, Outreach and Information
Division, located in Research Triangle Park, NC
.
For more information, contact:
Nick Mangus
U.S. Environmental Protection Agency
Phone: 919-541-5549
Website: http://www.epa.gov/aqs
American Housing Survey
e American Housing Survey (AHS) was mandated by
Congress in 1968 to provide data for evaluating progress
toward “a decent home and a suitable living environment
for every American family.” It is the primary source of
detailed information on housing in the United States and
is used to generate a biennial report to Congress on the
conditions of housing in the United States, among other
reports. e survey is conducted for the Department of
Housing and Urban Development by the U.S. Census
Bureau. e AHS encompasses a national survey and
60 metropolitan surveys and is designed to collect data
from the same housing units for each survey. e national
survey, a representative sample of approximately 45,000
housing units as of 2015, is conducted biennially in odd-
numbered years; the metropolitan surveys, representative
samples of 3,000 housing units, are conducted in odd-
numbered years on a 4-year cycle. e AHS collects data
about the inventory and condition of housing in the
United States and the demographics of its inhabitants. e
survey provides detailed data on the types of housing in
the United States and their characteristics and conditions;
nancial data on housing costs, utilities, mortgages,
equity loans, and market value; and demographic data
on family composition, income, education, and race and
ethnicity. Rotating supplements to the survey collect
information on neighborhood quality, walkability, public
transportation and recent movers; the health and safety
aspects of a home; accommodations for older and disabled
household members; doubling up of households; working
from home; access to arts and culture; use of housing
counseling; food security; and energy eciency.
Race and Hispanic origin: Data from this survey are not
shown by race and Hispanic origin in this report.
For more information, contact:
Meena Bavan
U.S. Department of Housing and Urban Development
E-mail: M[email protected]
Phone: 202-708-0614
Website: http://www.huduser.gov/portal/datasets/ahs.html
American Time Use Survey
e American Time Use Survey (ATUS) is a nationally
representative sample survey conducted for the Bureau
of Labor Statistics by the U.S. Census Bureau. e
ATUS measures how people living in the United States
spend their time. Estimates show the kinds of activities
people do and the time they spend doing them by sex,
age, educational attainment, labor force status, and other
characteristics, as well as by weekday and weekend day.
ATUS respondents are interviewed one time about
how they spent their time on the previous day, where
they were, and whom they were with. e survey is a
continuous survey, with interviews conducted nearly every
day of the year and a sample that builds over time. About
12,000 members of the civilian noninstitutionalized
population age 15 and over are interviewed each year.
Race and Hispanic origin: Data from this survey are not
shown by race and Hispanic origin in this report.
For more information, contact:
American Time Use Survey Sta
Bureau of Labor Statistics
U.S. Department of Labor
E-mail: [email protected]
Phone: 202-691-6339
Website: http://www.bls.gov/tus/
Consumer Expenditure Survey
e Consumer Expenditure Survey (CE) is conducted for
the Bureau of Labor Statistics by the U.S. Census Bureau.
e survey consists of two separate components, the

161
Data Sources
Quarterly Interview Survey and the Diary Suvey. Data are
integrated before publication. e data presented in this
Chartbook are derived from the integrated data available
on the CE website. e published data are weighted to
reect the U.S. population.
e Quarterly Interview Survey is designed to obtain data
on the types of expenditures respondents can recall for a
period of 3 months or longer. ese include relatively large
expenditures, such as those for property, automobiles,
and major durable goods and those that occur on a
regular basis, such as rent and utilities. Each consumer
unit is interviewed once per quarter for four consecutive
quarters. e Diary Survey is designed to obtain data
on frequently purchased smaller items, including food
and beverages both at home and in food establishments,
housekeeping supplies, tobacco, nonprescription drugs,
and personal care products and services. Each consumer
unit records its expenditures in a diary for two consecutive
1-week periods. Respondents are less likely to recall such
purchases over longer periods.
Race and Hispanic origin: Data from this survey are not
shown by race and Hispanic origin in this report.
For more information, contact:
Bureau of Labor Statistics
U.S. Department of Labor
E-mail: [email protected]
Phone: 202-691-6900
Website: http://www.bls.gov/cex/
Current Population Survey
e Current Population Survey (CPS) is a nationally
representative sample survey of about 60,000 households
conducted monthly for the Bureau of Labor Statistics
(BLS) by the U.S. Census Bureau. e CPS is the primary
source of information on the labor force characteristics of
the civilian noninstitutionalized population age 16 and
over, including a comprehensive body of monthly data
on the labor force, employment, unemployment, persons
not in the labor force, hours of work, earnings, and other
demographic and labor force characteristics.
In most months, CPS supplements provide additional
demographic and social data. e Annual Social and
Economic Supplement (ASEC) is the primary source
of detailed information on income and poverty in the
United States. e ASEC is used to generate the annual
Population Prole of the United States, reports on
geographical mobility and educational attainment, and
is the primary source of detailed information on income
and poverty in the United States. e ASEC, historically
referred to as the March supplement, now is conducted
in February, March, and April with a sample of about
100,000 addresses. e questionnaire asks about income
from more than 50 sources and records up to 27 dierent
income amounts, including receipt of many noncash
benets, such as food stamps and housing assistance.
Race and Hispanic origin: CPS respondents are asked to
identify themselves as belonging to one or more of ve
racial groups (White, Black, American Indian and Alaska
Native, Asian, and Native Hawaiian and other Pacic
Islander). People who responded to the question on race
by indicating only one race are referred to as the race alone
or single-race population, and individuals who chose more
than one race category are referred to as the Two or more
races population.
e CPS includes separate questions on Hispanic origin.
People who identify themselves as Hispanic, Latino,
or Spanish are further classied by detailed Hispanic
ethnicity (such as Mexican, Puerto Rican, or Cuban).
People of Hispanic origin may be of any race.
For more information regarding the CPS, its sampling
structure, and estimation methodology, see “Explanatory
Notes and Estimates of Error.”
59
For more information, contact:
Bureau of Labor Statistics
U.S. Department of Labor
E-mail: [email protected]
Phone: 202-691-6378
Website: http://www.bls.gov/cps
Additional website: http://www.census.gov/cps/
Decennial Census
Every 10 years, beginning with the first census in 1790,
the United States government conducts a census, or
count, of the entire population as mandated by the U.S.
Constitution. For most data collections, Census Day was
April 1 of the respective year.
For the 2010 Census, the Bureau devised a short-form
questionnaire that asked for the age, sex, race, and
ethnicity (Hispanic or Not Hispanic) of each household
resident; his or her relationship to the person lling out
the form; and whether the housing unit was rented or
owned by a member of the household. e census long
form, which for decades collected detailed socioeconomic
and housing data from a sample of the population
on education, housing, jobs, etc., was replaced by the
American Community Survey (ACS), an ongoing survey

162
Data Sources
of about 295,000 addresses per month that gathers largely
the same data as its predecessor.
Race and Hispanic origin: Starting with Census 2000, and
continuing in the 2010 Census, respondents were given
the option of selecting one or more race categories to
indicate their racial identities. People who responded to
the question on race by indicating only one of the six race
categories (White, Black, American Indian and Alaska
Native, Asian, Native Hawaiian and other Pacific Islander,
and Some Other Race) are referred to as the race alone or
single-race population. Individuals who chose more than
one of the race categories are referred to as the Two or
More Races population. e six single-race categories—
which made up nearly 98 percent of all respondents—
and the Two or More Races category sum to the total
population. Because respondents were given the option of
selecting one or more race categories in Census 2000 and
the 2010 Census, these data are not directly comparable
with data from the 1990 or earlier censuses.
As in earlier censuses, the 2010 Census included a
separate question on Hispanic origin. In the 2010 Census,
people of Spanish/Hispanic/Latino origin could identify
themselves as Mexican, Mexican American or Chicano,
Puerto Rican, Cuban, or Another Hispanic, Latino, or
Spanish origin. People of Hispanic origin may be of any
race.
For more information, contact:
Sex and Age Statistics Branch
Phone: 301-763-2378
Website: https://www.census.gov/2010census/
Federal Reserve Board
e Board of Governors of the Federal Reserve, also
called the Federal Reserve Board, publish the “Financial
Accounts of the United States” (Z.1) data quarterly
(about 10 weeks after the end of the quarter) on their
website. is data release presents the nancial ows and
levels of sectors in the U.S. economy as well as selected
balance sheets, supplemental tables, and the Integrated
Macroeconomic Accounts (IMA).
e IMA relate production, income, saving, and capital
formation from the national income and product
accounts (NIPA) to changes in net worth from the
“Financial Accounts” on a sector-by-sector basis. e
IMA are published jointly by the Federal Reserve Board
and the Bureau of Economic Analysis and are based on
international guidelines and terminology as dened in the
System of National Accounts (SNA 2008).
Data shown for the most recent quarters are based on
preliminary and potentially incomplete information.
Nonetheless, when source data are revised or estimation
methods are improved, all data are subject to revision.
ere is no specic revision schedule; rather, data are
revised on an ongoing basis. In each release of the
“Financial Accounts,” major revisions are highlighted at
the beginning of the publication.
e data in the “Financial Accounts” come from a
large variety of sources and are subject to limitations
and uncertainty due to measurement errors, missing
information, and incompatibilities among data sources.
e size of this uncertainty cannot be quantied,
but its existence is acknowledged by the inclusion of
“statistical discrepancies” for various sectors and nancial
instruments.
For more information, contact:
Federal Reserve Board of Governors
E-mail: rs-z1-sta@frb.gov
Website: http://www.federalreserve.gov/apps/fof/
Form 5500 Filings
Each year, most private pension and many private welfare
benet plans satisfy their annual reporting requirement by
ling a Form 5500 Annual Return/Report regarding their
nancial condition, investments, and operations with the
U.S. Department of Labor, Internal Revenue Service, and
the Pension Benet Guaranty Corporation.
e pension research sample supports analysis of the plan,
participant, and nancial characteristics of the private
pension plan universe and is used to produce the Private
Pension Plan Bulletin Abstract of Form 5500 Annual
Reports, an annual publication that summarizes data on
private pension plans.
For more information, contact:
Employee Benets Security Administration
U.S. Department of Labor
Phone: 202-693-8410
Website: http://www.dol.gov/ebsa/publications/
form5500dataresearch.html
Health and Retirement Study
e Health and Retirement Study (HRS) is a national
panel study conducted by the University of Michigan’s
Institute for Social Research under a cooperative
agreement with the National Institute on Aging (NIA).
In 1992, the study had an initial sample of over 12,600
people from the 1931–1941 birth cohort and their

163
Data Sources
spouses. e HRS was joined in 1993 by a companion
study, Asset and Health Dynamics Among the Oldest Old
(AHEAD), with a sample of 8,222 respondents (who were
born before 1924 and were age 70 and over) and their
spouses. In 1998, these two data collection eorts were
combined into a single survey instrument and eld period
and were expanded through the addition of baseline
interviews with two new birth cohorts: Children of the
Depression Age (1924–1930) and War Babies (1942–
1947). e HRS steady-state design calls for the addition
of a new 6-year cohort of Americans entering their 50s.
us, the Early Boomer birth cohort (1948–1953) was
added in 2004, the Mid-“Baby Boomer” birth cohort
(1954–1959) was added in 2010, and the Late “Baby
Boomers” (1960–1965) will be added in 2016. e 2010
wave also included an expansion of the minority sample
of Early and Mid-“Baby Boomers.” Telephone follow-ups
are conducted every second year, with proxy interviews
after death. Beginning with the 2006 wave, one-half of the
sample goes through an enhanced face-to-face interview
that includes the collection of physical measures and
biomarker collection. e Aging, Demographics, and
Memory Study (ADAMS) and forthcoming Harmonized
Cognitive Assessment Protocol (HCAP) supplement the
HRS with data to support a population-based study of
dementia. A genome-wide scan on 2012 samples is still
being processed, after which approximately 19,000 HRS
participants will support genetic and genomic studies.
e combined studies, which are collectively called
the HRS, have become a steady state sample that is
representative of the entire U.S. population age 50 and
over (excluding people who resided in a nursing home or
other institutionalized setting at the time of sampling).
e HRS will follow respondents longitudinally until they
die (including following people who move into a nursing
home or other institutionalized setting).
e HRS is designed to explain the antecedents and
consequences of retirement; examine the relationship
between health, income, and wealth over time;
examine life cycle patterns of wealth accumulation and
consumption; monitor work disability; provide a rich
source of interdisciplinary data, including linkages with
administrative data; monitor transitions in physical,
functional, and cognitive health in advanced old age;
relate late-life changes in physical and cognitive health
to patterns of spending down assets and income ows;
relate changes in health to economic resources and
intergenerational transfers; and examine how the mix and
distribution of economic, family, and program resources
aect key outcomes, including retirement, spending down
assets, health declines, and institutionalization.
Race and Hispanic origin: Data from this survey are not
shown by race and Hispanic origin in this report.
For more information, contact:
Health and Retirement Study
E-mail: hrsquest@isr.umich.edu
Phone: 734-936-0314
Website: http://hrsonline.isr.umich.edu/
Intercensal Population Estimates: 2000 to
2010
Intercensal population estimates are produced for the years
between two decennial censuses when both the beginning
and ending populations are known. ey are produced by
adjusting the existing time series of postcensal estimates
for the entire decade to smooth the transition from one
decennial census count to the next. ey dier from the
annually released postcensal estimates in that they rely on
mathematical formulae that redistribute the dierence
between the April 1 postcensal estimate and April 1 census
count for the end of the decade across the postcensal
estimates for that decade. For dates when both postcensal
and intercensal estimates are available, intercensal
estimates are preferred.
e 2000–2010 intercensal estimates reconcile the
postcensal estimates with the 2010 Census counts and
provide a consistent time series of population estimates
that reect the 2010 Census results. e 2000–2010
intercensal estimates were produced for the nation, states,
and counties by demographic characteristics (age, sex, and
race and Hispanic origin).
For a more detailed discussion of the methods used to
create the intercensal estimates, see http://www.census.
gov/popest/data/intercensal/index.html.
For more information, contact:
Population Estimates Branch
Phone: 301-763-2385
Website: http://www.census.gov/popest/index.html
International Data Base
e U.S. Census Bureau produces the International Data
Base (IDB), which includes regularly updated population
estimates and projections for over 200 countries and areas.
e series of estimates and projections provide a consistent
set of demographic indicators, including population size
and growth, mortality, fertility, and net migration. e
IDB is accessible via the Internet at www.census.gov/
population/international/data/idb.

164
Data Sources
For more information, contact:
Demographic and Economic Studies Branch
International Programs
Population Division
Phone: 301-763-1360
Website: http://www.census.gov/population/international/
data/
Master Beneciary Record
e Social Security Administration maintains a record of
Social Security Title II benets for each beneciary and
applicant for benets. e administrative database is for
each disabled insurance, retired worker insurance, survivor
insurance, and spouse insurance beneciary. e system
of records is the Master Beneciary Record (MBR). e
MBR extract le contains a record for every person who
has a record on the MBR. is general-purpose extract
le is comprised of 134 variables. e MBR extract is
produced semi-annually, and is used to support a variety
of research and statistical projects.
e data in Indicator 10 on Social Security beneciaries
come from tabulations of the MBR data that are
published annually in the Statistical Supplement to the
Social Security Bulletin. e Supplement tables used in
Indicator 10 include 5A.1.2, 5A1.6, 5A5, 5A.6, 5A, and
6B5.1.
For more information, contact:
Email: [email protected]
Website: https://www.socialsecurity.gov/policy/docs/
statcomps/supplement
Medicare Claims and Enrollment Data
e Medicare claims and enrollment data are captured
in the Chronic Condition Warehouse. e Centers for
Medicare & Medicaid Services (CMS) launched the
Chronic Condition Data Warehouse (CCW), a research
database, in response to the Medicare Modernization Act
of 2003 (MMA). Section 723 of the MMA outlines a
plan to improve the quality of care and reduce the cost of
care for chronically ill Medicare beneciaries. In addition
to chronic conditions, the CCW supports health policy
analysis and other CMS initiatives.
e CCW data les were designed to facilitate research
across the continuum of care, using data les that
could be easily merged and analyzed by beneciary.
Each beneciary in the CCW is assigned a unique,
unidentiable link key, which allows researchers to easily
merge data les and perform relevant analyses across
dierent claim types, enrollment les, Part D event data,
assessment data, and other CCW le types. CCW data
les are available upon request from CMS.
e CCW claims data les have been streamlined to
include only those variables determined by CMS to be
of value and useful for research or analytic purposes. e
data les delivered from the CCW contain a subset of the
original source les. Variables used infrequently or not
applicable to a particular setting have been removed.
For more information, contact:
e Research Data Assistance Center
E-mail: [email protected]
Phone: 1-888-973-7322
Website: http://www.resdac.umn.edu
Chronic Conditions Data Warehouse
E-mail: [email protected]
Phone: 1-866-766-1915
Website: https://www.ccwdata.org/web/guest/home
Medicare Current Beneciary Survey
e Medicare Current Beneciary Survey (MCBS) is
a continuous, multipurpose survey of a representative
sample of the Medicare population designed to help
the Centers for Medicare & Medicaid Services (CMS)
administer, monitor, and evaluate the Medicare program.
e MCBS collects information on health care use,
cost, and sources of payment; health insurance coverage;
household composition; sociodemographic characteristics;
health status and physical functioning; income and assets;
access to care; satisfaction with care; usual source of care;
and how beneciaries get information about Medicare.
MCBS data enable CMS to determine sources of payment
for all medical services used by Medicare beneciaries,
including copayments, deductibles, and non-covered
services; develop reliable and current information on the
use and cost of services not covered by Medicare (such
as long-term care); ascertain all types of health insurance
coverage and relate coverage to sources of payment; and
monitor the nancial eects of changes in the Medicare
program. Additionally, the MCBS is the only source of
multidimensional person-based information about the
characteristics of the Medicare population and their access
to and satisfaction with Medicare services and information
about the Medicare program. e MCBS sample
consists of Medicare enrollees in the community and in
institutions.
e survey is conducted in three rounds each year, with
each round being about 4 months in length. e MCBS
has a multistage, stratied, random sample design and

165
Data Sources
a rotating panel survey design. Each panel is followed
for 12 interviews. In-person interviews are conducted
using computer-assisted personal interviewing. A sample
of approximately 16,000 people are interviewed in each
round. However, because of the rotating panel design,
only 12,000 people receive all three interviews in a given
calendar year. Information collected in the survey is
combined with information from CMS administrative
data les.
e MCBS has two components: the Cost and Use le
and the Access to Care le. Medicare claims are linked
to survey-reported events to produce the Cost and Use
le, which provides complete expenditure and source-of-
payment data on all health care services, including those
not covered by Medicare. e Access to Care le contains
information on beneciaries’ access to health care,
satisfaction with care, and usual source of care. e sample
for this le represents the “always enrolled” population—
those who participated in the Medicare program for the
entire year. In contrast, the Cost and Use le represents
the “ever enrolled” population, including those who
entered Medicare and those who died during the year.
Race and Hispanic origin: e MCBS denes race as
White, Black, Asian, Native Hawaiian or Pacic Islander,
American Indian or Alaska Native, or Other. People are
allowed to choose more than one category. ere is a
separate question on whether the person is of Hispanic
or Latino origin. e “Other” category in Table 30c
consists of people who answered “No” to the Hispanic/
Latino question and who answered something other than
“White” or “Black” to the race question. People who
answer with more than one racial category are assigned to
the “Other” category.
For more information, contact:
MCBS Sta
Centers for Medicare & Medicare Services
E-mail: [email protected]
Website: http://www.cms.hhs.gov/mcbs
e Research Data Assistance Center
E-mail: [email protected]
Phone: 1-888-973-7322
Website: http://www.resdac.umn.edu
Medical Expenditure Panel Survey
e Medical Expenditure Panel Survey (MEPS) is an
ongoing annual survey of the civilian noninstitutionalized
population that collects detailed information on health
care use and expenditures (including sources of payment),
health insurance, income, health status, access, and quality
of care. e MEPS, which began in 1996, is the third in
a series of national probability surveys conducted by the
Agency for Healthcare Research and Quality (AHRQ) on
the nancing and use of medical care in the United States.
MEPS predecessor surveys are the National Medical Care
Expenditure Survey (NMCES) conducted in 1977 and the
National Medical Expenditure Survey (NMES) conducted
in 1987. Each of the three surveys (NMCES, NMES, and
MEPS) used multiple rounds of in-person data collection
to elicit expenditures and sources of payments for each
health care event experienced by household members
during the calendar year. e current MEPS Household
Component (HC) sample is drawn from respondents to
the National Health Interview Survey (NHIS) conducted
by the National Center for Health Statistics (NCHS). To
yield more complete information on health care spending
and payment sources, followback surveys of health
providers were conducted for a subsample of events in the
MEPS (and events in the MEPS predecessor surveys).
Since 1977, the structure of billing mechanism for
medical services has grown more complex as a result
of increasing penetration of managed care and health
maintenance organizations and various cost containment
reimbursement mechanisms instituted by Medicare,
Medicaid, and private insurers. As a result, there has
been substantial discussion about what constitutes an
appropriate measure of health care expenditures.
60
Health
care expenditures presented in this report refer to what
is actually paid for health care services. More specically,
expenditures are dened as the sum of direct payments
for care received, including out-of-pocket payments
for care received. is denition of expenditures diers
somewhat from what was used in the 1987 NMES, which
used charges (rather than payments) as the fundamental
expenditure construct. To improve comparability of
estimates between the 1987 NMES and the 1996 and
2001 MEPS, the 1987 data presented in this report were
adjusted using the method described by Zuvekas and
Cohen.
58
Adjustments to the 1977 data were considered
unnecessary because virtually all of the discounting
for health care services occurred after 1977 (essentially
equating charges with payments in 1977).
A number of quality-related enhancements were made to
the MEPS beginning in 2000, including the elding of an
annual adult self-administered questionnaire (SAQ). is
questionnaire contains items regarding patient satisfaction
and accountability measures from the Consumer
Assessment of Healthcare Providers and Systems

166
Data Sources
(CAHPS®; previously known as the Consumer Assessment
of Health Plans), the SF-12 physical and mental health
assessment tool, EQ-5D EuroQol 5 dimensions with
visual scale (2000–2003), and several attitude items.
Starting in 2004, the K–6 Kessler mental health distress
scale and the PH2 two-item depression scale were added
to the SAQ.
Race and Hispanic origin: Data from this survey are not
shown by race and Hispanic origin in this report.
For more information:
Agency for Healthcare Research and Quality
Website: http://meps.ahrq.gov/mepsweb
National Health and Aging Trends Study
and National Study of Caregiving
e National Health and Aging Trends Study (NHATS)
is a scientic study of how Americans function in later
life that is conducted by the Johns Hopkins University
Bloomberg School of Public Health, with data collection
by Westat and support from the National Institute on
Aging. e NHATS is intended to foster research that
will guide eorts to reduce disability, maximize health and
independent functioning, and enhance quality of life at
older ages.
Since 2011, the NHATS has been gathering information
on a nationally representative sample of Medicare
beneciaries ages 65 and over through annual in-person
interviews. e interviews collect detailed information
on activities of daily life, living arrangements, economic
status and well-being, aspects of early life, and quality
of life. Among the specic content areas included are
the general and technological environment of the home,
health conditions, work status and participation in valued
activities, mobility and use of assistive devices, cognitive
functioning, and help provided with daily activities (self-
care, household, and medical). Study participants are
re-interviewed every year in order to compile a record of
change over time. e content and questions included
in the NHATS were developed by a multidisciplinary
team of researchers from the elds of demography,
geriatric medicine, epidemiology, health services research,
economics, and gerontology. As the population ages, the
NHATS will provide the basis for understanding trends
in late-life functioning, how these dier for various
population subgroups, and the economic and social
consequences of aging and disability for individuals,
families, and society.
e National Study of Caregiving (NSOC) is a national
study of people who help older family members and
friends with their daily activities and is conducted as a
supplement to the NHATS. NHATS respondents who
reported receiving assistance with household, mobility,
or self-care activities were asked to identify all persons
providing help with each activity. Caregivers were eligible
to participate in the NSOC if they were a family member
or an unpaid caregiver who was not a relative and helped
with any of the activities. NSOC participants took
part in telephone interviews and provided information
about the caregiving experience, caregiving support, and
demographic, socioeconomic, and family characteristics,
as well as type and amount of help provided and family
situation, positive and negative aspects of caregiving (i.e.,
gains from and burdens of caregiving activities), physical
and mental health (including symptoms and impairments
that limited participants’ activities), participation in valued
activities and whether caregiving limited participation,
and subjective well-being. e NSOC was conducted in
2011 and 2015, concurrent with the “refreshing” of the
NHATS sample.
For more information, contact:
National Health and Aging Trends Study
E-mail: NHA[email protected]
Website: http://www.nhats.org/
National Health Interview Survey
e National Health Interview Survey (NHIS) is the
principal source of information on the health of the
civilian noninstitutionalized population of the United
States. It is also one of the major data collection programs
of the National Center for Health Statistics (NCHS),
which is part of the Centers for Disease Control and
Prevention (CDC).
e main objective of the NHIS is to monitor the health
of the United States population through the collection and
analysis of data on a broad range of health topics. A major
strength of this survey is its ability to display these health
characteristics by many demographic and socioeconomic
characteristics.
e NHIS covers the civilian noninstitutionalized
population residing in the United States at the time of the
interview. Because of technical and logistical problems,
several segments of the population are not included in the
sample or in the estimates from the survey. Examples of
persons excluded are patients in long-term care facilities,
persons on active duty with the Armed Forces (though

167
Data Sources
their dependents are included), persons incarcerated in
the prison system, and U.S. nationals living in foreign
countries.
Race and Hispanic origin: Starting with data year 1999,
race-specic estimates in the NHIS are tabulated according
to 1997 standards for federal data on race and ethnicity
and are not strictly comparable with estimates for earlier
years. In Older Americans 2016, the NHIS estimates
by race represent people who report one race, or if they
reported more than one race, identied one race as best
representing their race. See Health, United States, 2015,
Appendix II for details on race and ethnicity in the NHIS
.
For more information, contact:
Division of Health Interview Statistics
E-mail: [email protected]
Phone: 1-800-232-4636
Website: http://www.cdc.gov/nchs/nhis.htm
National Health and Nutrition Examination
Survey
e National Health and Nutrition Examination Survey
(NHANES) is a program of studies designed to assess the
health and nutritional status of adults and children in the
United States. e survey is unique in that it combines
interviews and physical examinations. NHANES is
a major program of the National Center for Health
Statistics (NCHS). NCHS is part of the Centers for
Disease Control and Prevention (CDC) and is responsible
for producing vital and health statistics for the nation.
e NHANES program began in the early 1960s and
has been conducted as a series of surveys focusing on
dierent population groups and health topics. In 1999,
the survey became a continuous program with a changing
focus on a variety of health and nutrition measurements
to meet emerging needs. e survey examines a nationally
representative sample of about 5,000 persons each year.
ese persons are located in counties across the country,
15 of which are visited each year.
e NHANES interview includes demographic,
socioeconomic, dietary, and health-related questions. e
examination component consists of medical, dental, and
physiological measurements, as well as laboratory tests
administered by highly trained medical personnel.
Race and Hispanic origin: Data from this survey are not
shown by race and Hispanic origin in this report.
For more information, contact:
Division of Health and Nutrition Examination Survey
E-mail: [email protected]
Phone: 1-800-232-4636
Website: http://www.cdc.gov/nchs/nhanes.htm
National Study of Long-Term Care
Providers
e 2014 National Study of Long-Term Care Providers
(NSLTCP) is designed to provide nationally representative
statistical information about the supply and use of long-
term care services in the United States. NSLTCP includes
ve sectors: residential care communities, adult day
services centers, nursing homes, home health agencies,
and hospices. NSLTCP replaces three previous National
Center for Health Statistics (NCHS) surveys: the National
Nursing Home Survey, National Home and Hospice Care
Survey, and National Survey of Residential Care Facilities.
NSLTCP comprises two components: (1) primary
data collected by NCHS through surveys of residential
care communities and adult day services centers, and
(2)administrative data on nursing homes, home health
agencies, and hospices obtained from the Centers for
Medicare & Medicaid Services. Estimates in Older
Americans 2016 are from the study’s second wave and use
data from surveys about adult day services centers and
participants; residential care communities and residents
(elded by NCHS between June 2014 and January 2015);
and administrative records obtained from CMS on home
health agencies and patients, hospices and patients, and
nursing homes and residents, which reect these providers
and services users between 2013 and 2014.
Race and Hispanic origin: Data from this survey are not
shown by race and Hispanic origin in this report.
For more information, contact:
Long-Term Care Statistics Branch
E-mail: [email protected]
Phone: 1-800-232-4636
Website: http://www.cdc.gov/nchs/nsltcp.htm
National Vital Statistics System
e National Vital Statistics System (NVSS) collects and
publishes ocial national statistics on births, deaths, fetal
deaths, and—prior to 1996—marriages and divorces
occurring in the United States, based on U.S. Standard
Certicates.
NVSS collects and presents U.S. resident data for the
aggregate of 50 states, New York City, and Washington,
D.C., as well as for each individual state and D.C. and the
U.S. dependent areas of Puerto Rico, the Virgin Islands,

168
Data Sources
Guam, American Samoa, and the Northern Marianas.
Vital events occurring in the United States to non-U.S.
residents and vital events occurring abroad to U.S.
residents are excluded.
By law, the registration of deaths is the responsibility
of the funeral director. e funeral director obtains
demographic data for the death certicate from an
informant. e physician in attendance at the death is
required to certify the cause of death. When a death is
from other than natural causes, a coroner or medical
examiner may be required to examine the body and
certify the cause of death. e National Center for Health
Statistics (NCHS) is responsible for compiling and
publishing annual national statistics on causes of death.
In carrying out this responsibility, NCHS adheres to
the World Health Organization (WHO) Nomenclature
Regulations. ese regulations require (a) that cause of
death be coded in accordance with the applicable revision
of the International Classication of Diseases (ICD),
and (b)that underlying cause of death be selected in
accordance with international rules.
Race and Hispanic origin: Race and Hispanic origin are
reported separately on the death certificate. erefore, data
by race shown in Indicator 15 (Life Expectancy) include
people of Hispanic or non-Hispanic origin. See Appendix
II of Health, United States 2015 for more information on
race in the mortality les of the NVSS.
For more information, contact:
Division of Vital Statistics
E-mail: [email protected]
Phone: 1-800-232-4636
Website: http://www.cdc.gov/nchs/nvss.htm
Population Projections
e 2014 National Population Projections provide
projections of the resident population and demographic
components of change (births, deaths, and international
migration) through 2060. Population projections are
available by age, sex, and race and Hispanic origin. Where
both estimates and projections are available for the same
time period, the Census Bureau recommends the use of
the population estimates. Below is a general description
of the methods used to produce the 2014 National
Population Projections.
e 2014 National Population Projections start with
the Vintage July 1, 2013, population estimates and are
developed using a cohort-component method. Many
of the characteristics of the U.S. resident population,
as measured by the 2010 Census, are preserved as
demographic patterns that work their way through the
projection period. e components of population change
(births, deaths, and international migration) are projected
for each birth cohort (persons born in a given year).
For each passing year, the Census Bureau advances the
population 1 year of age. e Census Bureau updates
the new age categories using survival rates and levels of
international migration projected for the passing year. A
new birth cohort is added to form the population under
1 year of age by applying projected age-specic fertility
rates to the female population age 14 to 54, and by
updating the new cohort for the eects of mortality and
international migration.
e assumptions for the components of change are based
on time series analysis. Because of limited information
about racial characteristics in the fertility and mortality
historical series, the assumptions were developed for
mutually exclusive and exhaustive groups. Five groups
were used for the fertility assumptions: native-born Asian/
Pacic Islander, all other native-born, foreign-born non-
Hispanic Asian/Pacic Islander, all other non-Hispanic
foreign-born, and foreign-born Hispanic. ree groups
were used for the mortality assumptions: non-Hispanic
White/Asian/Native Hawaiian/Pacic Islander, non-
Hispanic Black/American Indian/Alaska Native, and
Hispanic of any race. e resulting births and deaths were
then applied to the matching racial and ethnic categories
to project the population.
For more information, contact:
Population Evaluation
Analysis and Projections Branch
Phone: 301-763-2438
Website: https://www.census.gov/population/projections/
data/national/2014.html
Postcensal Population Estimates
Each year, the United States Census Bureau produces
and publishes population estimates of the nation, states,
counties, state/county equivalents, and Puerto Rico.
61
e Census Bureau estimates the resident population for
each year since the most recent decennial census by using
measures of population change. e resident population
includes all people currently residing in the United States.
e population estimates are used for federal funding
allocations, as controls for major surveys including the
Current Population Survey and the American Community
Survey, for community development, to aid business
planning, and as denominators for statistical rates.

169
Data Sources
Overall, the estimate time series from 2000 to 2010 was
very accurate, even accounting for 10 years of population
change. e average absolute dierence between the nal
total resident population estimates and 2010 Census
counts was only about 3.1 percent across all counties.
62
e population estimate at any given time point starts
with a population base (the last decennial census or the
previous point in the time series), adds births, subtracts
deaths, and adds net migration (both international and
domestic).
63
e individual methods used by the Census
Bureau account for additional factors such as input data
availability and the requirement that all estimates be
consistent by geography, age, sex, and race and Hispanic
origin.
e Census Bureau produces these estimates using a “top-
down” approach. It rst estimates the national population
and the populations of states and counties. All of these
follow a cohort component method. One key principle
used by the Census Bureau is that all estimates produced
must be consistent across geography and demographic
characteristics. To accomplish this, the Census Bureau
controls the estimates of the smaller geographic areas so
that they sum to the totals produced at higher levels.
For more information contact:
Population Estimates Branch
Phone: 301-763-2385
Website: http://www.census.gov/popest/methodology/
index.html
Supplemental Poverty Measure
Concerns about the adequacy of the ocial measure of
poverty culminated in a congressional appropriation in
1990 for an independent scientic study of the concepts,
measurement methods, and information needed for a
poverty measure. In response, the National Academy
of Sciences (NAS) established the Panel on Poverty and
Family Assistance, which released its report in the spring
of 1995.
64
In 2010, an interagency technical working group,
which included representatives from the Bureau of
Labor Statistics (BLS), the U.S. Census Bureau, the
Economics and Statistics Administration, the Council
of Economic Advisers, the U.S. Department of Health
and Human Services, and the Oce of Management
and Budget, issued a series of suggestions to the Census
Bureau and the BLS on how to develop the Supplemental
Poverty Measure (SPM). eir suggestions drew on
the recommendations of the 1995 NAS report and the
extensive research on poverty measurement conducted
after the report’s publication.
65
Since 2011, the Census Bureau has published poverty
estimates using the new measure based on these
suggestions.
66
e SPM serves as an additional indicator of
economic well-being and provides a deeper understanding
of economic conditions and policy eects. e SPM
creates a more complex statistical picture incorporating
additional items such as tax payments, work expenses, and
medical out-of-pocket expenditures in its family resource
estimates. e resource estimates also take into account
the value of noncash benets, including nutritional,
energy, and housing assistance. resholds used in the new
measure are derived by sta at the BLS from Consumer
Expenditure Survey expenditure data on basic necessities
(food, shelter, clothing, and utilities) and are adjusted for
geographic dierences in the cost of housing.
In addition to the annual report, the Census Bureau
makes available a research data le that enables analysts to
create their own SPM estimates and cross tabulations.
67
For more information, contact:
Dr. Trudi J. Renwick
U.S. Census Bureau
E-mail: [email protected]
Phone: 301-763-5133
Website: http://www.census.gov/hhes/povmeas/
methodology/supplemental/overview.html
Survey of Consumer Finances
e Survey of Consumer Finances (SCF) is a triennial,
cross-sectional, national survey of noninstitutionalized
Americans conducted by the Federal Reserve Board with
the cooperation of the Statistics of Income Division of the
Internal Revenue Service. It includes data on household
assets and debts, use of nancial services, income,
demographics, and labor force participation.
e survey is considered one of the best sources for
wealth measurement because of its detailed treatment
of assets and debts, and because it oversamples wealthy
households.
68,69
e data for the panels of the SCF used
in this study were collected by the National Opinion
Research Center at the University of Chicago. e
SCF uses a dual-frame sample consisting of both a
standard random sample and a special over-sample of
wealthier households in order to correct for the under-
representation of high-income families in the survey.
It uses multiple imputation techniques to deal with
missing data, which results in the creation of ve data

170
Data Sources
sets called “implicates.” ere are ve implicates for every
record. In the SCF, a household unit is divided into
a “primary economic unit” (PEU)—the family—and
everyone else in the household. e PEU is intended to
be the economically dominant single person or couple
(whether married or living together as partners) and
all other persons in the household who are nancially
interdependent with the economically dominant person or
couple.
70
e Indicator 11 data represent the PEU, which
are referred to as households in the chart and discussion.
Race and Hispanic origin: Data in this report for the head
of the primary economic unit are shown for White and
Black. Data are not shown by Hispanic origin.
For more information, contact:
Chris Angelov
E-mail: [email protected]v
Phone: 202-755-3114
VA Enrollee Health Care Projection Model
e Veterans Administration (VA) uses the VA Enrollee
Health Care Projection Model (Model) to project
enrollment and utilization of the enrolled veteran
population for 20 years into the future for more than
90categories of health care services. First, the VA uses the
Model to determine how many veterans will be enrolled
each year and their age, priority, and geographic location.
Next, the VA uses the Model to project the total health
care services needed by those enrollees and then estimates
the portion of that care that those enrollees will demand
from the VA.
e Model accounts for the unique demographic
characteristics of the enrolled veteran population,
including Operation Enduring Freedom/Operation Iraqi
Freedom/Operation New Dawn (OEF/OIF/OND) and
other enrollee cohorts, as well as other factors that impact
a veteran’s decision to enroll in the VA and use VA health
care services:
• Enrollee age, gender, income, travel distance to VA
facilities, and geographic migration patterns
• Signicant morbidity of the enrolled veteran
population, particularly for mental health services
• Economic conditions, including changes in local
unemployment rates and home values (as a proxy for
asset values) and the long-term downward trend in
labor force participation, particularly for high school-
educated males
• Enrollee transition between enrollment priorities as a
result of movement into service-connected priorities or
changes in income
• Enrollee reliance on VA health care versus the other
health care options available to them, i.e., Medicare,
Medicaid, TRICARE, and commercial insurance
• Unique health care utilization patterns of OEF/OIF/
OND, female, and new enrollees, and other enrollee
cohorts with unique utilization patterns for particular
services
• New policies, regulations, and legislation, such as the
implementation of the Medicare drug benet
• VA health care initiatives, such as the mental health
capacity improvement initiative
• A continually evolving VA health care system, i.e.,
quality and eciency initiatives
• Changes in health care practice and technology such as
new diagnostics, drugs, and treatments
For more information, contact:
Carolyn Stoesen
Veterans Health Administration
Oce of Policy and Planning
E-mail: [email protected]v
Phone: 202-461-7151
Website: http://www.va.gov/HEALTHPOLICY
PLANNING/planning.asp
Veteran Population Estimates and
Projections
e VA Oce of the Chief Actuary (OACT) provided
veteran population projection by key demographic
characteristics such as age and gender as well as geographic
areas. VetPop2014 was last updated using Census 2000
data, VA administrative data, and Department of Defense
data. VetPop2016 will be released in Winter 2017.
Race and Hispanic origin: Data from this model are not
shown by race and Hispanic origin in this report.
For more information, contact:
e National Center for Veterans Analysis and Statistics
E-mail: VANCV[email protected]v
Website: http://va.gov/vetdata/veteran_population.asp

Glossary

172
Glossary
Activities of daily living (ADLs): Activities of daily living
(ADLs) are basic activities that support survival, including
eating, bathing, and toileting. See Instrumental activities of
daily living (IADLs).
In the Medicare Current Beneficiary Survey, ADL
disabilities are measured as diculty performing (or
inability to perform because of a health reason) one or
more of the following activities: eating, getting in/out of
chairs, walking, dressing, bathing, or toileting.
Asset income: Asset income includes money income
reported in the Current Population Survey from interest
(on savings or bonds), dividends, income from estates
or trusts, and net rental income. Capital gains are not
included.
Auxiliary benets: ese benets provide wives of
dependents with half of their husband’s basic benet and
surviving widows with their husband’s full basic benet.
Divorced women can receive auxiliary spouse/widow
benets based on a marriage of at least 10 years’ duration.
Body mass index (BMI): is is a measure of body
weight adjusted for height that correlates with body
fat. A tool for indicating weight status in adults, BMI
is generally computed using metric units and is defined
as weight divided by height
2
or kilograms/meters
2
. e
categories used in this report are consistent with those set
by the World Health Organization. For adults 20 years
of age and over, underweight is defined as having a BMI
less than 18.5; healthy weight is defined as having a BMI
of at least 18.5 and less than 25; overweight is defined as
having a BMI equal to 25 or greater; and obese is defined
as having a BMI equal to 30 or greater. To calculate your
own body mass index, go to http://www.nhlbi.nih.gov/
health/educational/lose_wt/BMI/bmicalc.htm. For more
information about BMI, see “Clinical guidelines on the
identification, evaluation, and treatment of overweight
and obesity in adults.”
71
Cause of death: For the purpose of national mortality
statistics, every death is attributed to one underlying
condition, based on information reported on the death
certificate and using the international rules for selecting
the underlying cause of death from the conditions stated
on the death certificate. In addition to the underlying
cause, all other conditions reported on the death certicate
are captured and coded and are referred to as multiple
causes of death. Cause of death is coded according to the
appropriate revision of the International Classification of
Diseases (ICD). Eective with deaths occurring in 1999,
the United States began using the Tenth Revision of the
ICD (ICD–10).
72
Civilian noninstitutionalized population: See
Population.
Civilian population: See Population.
Crowded housing: Crowded housing is dened as
households that have more than one person per room.
Death rate: e death rate is calculated by dividing the
number of deaths in a population in a year by the midyear
resident population. For census years, rates are based on
unrounded census counts of the resident population as of
April 1. Death rates are expressed as the number of deaths
per 100,000 people. e rate may be restricted to deaths
in specific age, race, sex, or geographic groups or from
specific causes of death (specific rate), or it may be related
to the entire population (crude rate).
Dened benet plan: A plan that promises a specied
monthly benet at retirement. e plan may state this
promised benet as an exact dollar amount, such as $100
per month at retirement. Or, more often, it may calculate
a benet through a plan formula that considers such
factors as salary and service (e.g., 1 percent of average
salary for the last 5 years of employment for every year of
service with an employer).
Dened contribution plan: A plan that does not promise
a specic benet amount at retirement. Instead, employers
and/or employees contribute money to each employee’s
individual account in the plan. In many cases, employees
are responsible for choosing how these contributions are
invested and deciding how much to contribute from their
paychecks through pretax deductions. Employers may
add to employees’ accounts, in some cases, by matching
a certain percentage of the employee’s contributions. e
value of an employee’s account depends on how much is
contributed and how well the investments perform.
Dental services: In the Medicare Current Beneciary
Survey (Indicators 30 and 34), the Medical Expenditure
Panel Survey (MEPS), and the data used from the MEPS
predecessor surveys used in this report (Indicator 33)
this category covers expenses for any type of dental care
provider, including general dentists, dental hygienists,
dental technicians, dental surgeons, orthodontists,
endodontists, and periodontists. In Indicator 30, dental
services are included as part of the “Other” category; in
Indicator 34, dental services are included as a separate
category.
Disability rating: Ratings reect the severity of the
disability and how much the impairment impacts the
ability to work.

173
Glossary
Earnings: Earnings are considered money income
reported in the Current Population Survey from wages or
salaries and net income from self-employment (farm and
nonfarm).
Emergency room services: In the Medical Expenditure
Panel Survey (MEPS) and the data used from the MEPS
predecessor surveys used in this report (Indicator 33), this
category includes expenses for visits to medical providers
seen in emergency rooms (except visits resulting in a
hospital admission). ese expenses include payments
for services covered under the basic facility charge and
those for separately billed physician services. In the
Medicare Current Beneciary Survey (Indicators 30 and
34) emergency room services are included as a hospital
outpatient service unless they are incurred immediately
prior to a hospital stay, in which case they are included as
a hospital inpatient service.
Fee-for-service: is is the method of reimbursing health
care providers on the basis of a fee for each health service
provided to the insured person.
Full Retirement Age (FRA): e age when benets are
not reduced for early retirement. Benets are increased by
about 8 percent a year until age 70 for delayed retirement.
Early Retirement Age (ERA) for retired workers begins
at age 62 with a 25 percent reduced level from benets
at Full Retirement Age (FRA), age 66 in 2014. Initial
benets at age 62 increase approximately 75 percent
for a delay from ERA to age 70. e FRA was age 65
until 1937 and increased at 2 months per year for each
birth year after 1937 until 1943. Please note that the
percentages are not the probabilities of claiming at an
age because dierent birth year cohorts are in each age
group in a given year and somewhat vary in the size of the
eligible population.
Group quarters: A group quarters is a place where people
live or stay in a group living arrangement that is owned or
managed by an entity or organization providing housing
and/or services for the residents. is is not a typical
household-type living arrangement. ese services may
include custodial or medical care as well as other types of
assistance, and residency is commonly restricted to those
receiving these services. People living in group quarters
are usually not related to each other. e group quarters
denitions used in the 2010 Census are available in
Appendix B at: http://www.census.gov/prod/cen2010/
doc/sf1.pdf.
Head of household: e Survey of Consumer Finances
(SCF) estimates wealth for the “Primary Economic Unit,”
which is similar to the Census Bureau’s Household.
e “Primary Economic Unit” is the economically
dominant single person or couple (whether married or
living together as partners) and all other persons in the
household who are nancially interdependent with the
economically dominant person or couple. If a couple is
economically dominant in the PEU, the head is the male
in a mixed sex couple or the older person in a same-sex
couple. If a single person is economically dominant, that
person is designated as the family head in this report.
Health care expenditures: In the Consumer Expenditure
Survey (Indicator 14), health care expenditures include
out-of-pocket expenditures for health insurance, medical
services, prescription drugs, and medical supplies. In the
Medicare Current Beneciary Survey (Indicators 30 and
34), health care expenditures include all expenditures for
inpatient hospital, medical, nursing home, outpatient
(including emergency room visits), dental, prescription
drugs, home health care, and hospice services, including
both out-of-pocket expenditures and expenditures covered
by insurance. Personal spending for health insurance
premiums is excluded. In the Medical Expenditure
Panel Survey (MEPS) and the data used from the MEPS
predecessor surveys used in this report (Indicator 33),
health care expenditures refer to payments for health care
services provided during the year. (Data from the 1987
survey have been adjusted to permit comparability across
years; see Zuvekas and Cohen.
58
) Out-of-pocket health
care expenditures are the sum of payments paid to health
care providers by the person, or the person’s family, for
health care services provided during the year. Health care
services include inpatient hospital, hospital emergency
room, and outpatient department care; dental services;
oce-based medical provider services; prescription
drugs; home health care; and other medical equipment
and services. Personal spending for health insurance
premium(s) is excluded.
Health maintenance organization (HMO): An HMO
is a prepaid health plan delivering comprehensive care to
members through designated providers, having a fixed
monthly payment for health care services, and requiring
members to be in a plan for a specified period of time
(usually 1 year).
Health Eating Index-2010 (HEI-2010): A measure
of diet quality that assesses conformance to the Dietary
Guidelines for Americans. e primary use of the HEI is to
monitor the diet quality of the U.S. population. e HEI-
2010
31
has 12 components, nine of which are adequacy
components and three are moderation components.

174
Glossary
Intakes equal to or better than the standards set for each
component are assigned a maximum score. For the nine
adequacy components (e.g., total fruit, total vegetable), no
intake gets zero and scores increase up to the maximum
as the intakes increase towards the standard. e three
moderation components (e.g., rened grains, sodium)
are scored in reverse; that is, excessively high intakes get
zeros and as intakes decrease toward the standard, scores
increase; higher scores reect lower intakes because lower
intakes are more desirable. A higher score indicates a
higher quality diet that aligns with the 2010 Dietary
Guidelines for Americans. Scores are averaged across all
adults based on usual dietary intakes.
Hispanic origin: See specific data source descriptions.
Home health care/services/visits: Home health care is
care provided to individuals and families in their places
of residence for promoting, maintaining, or restoring
health or for minimizing the eects of disability and
illness, including terminal illness. In the Medicare Current
Beneciary Survey and Medicare claims data (Indicators
29, 30, and 34), home health care refers to skilled
nursing care, physical therapy, speech language pathology
services, occupational therapy, and home health aide
services provided to homebound patients. In the Medical
Expenditure Panel Survey (Indicator 33), home health
care services are classied into the “Other health care”
category and are considered any paid formal care provided
by home health agencies and independent home health
providers. Services can include visits by professionals,
including nurses, doctors, social workers, and therapists,
as well as home health aides, homemaker services,
companion services, and home-based hospice care. Home
care provided free of charge (informal care by family
members) is not included.
Hospice care/services: Hospice care is a program of
palliative and supportive care services providing physical,
psychological, social, and spiritual care for dying persons,
their families, and other loved ones by a hospice program
or agency. Hospice services are available in home and
inpatient settings. In the Medicare Current Beneciary
Survey (MCBS) (Indicators 30 and 34) hospice care
includes only those services provided as part of a Medicare
benet. In Indicator 30, hospice services are part of the
“Other” category. In Indicator 34, hospice services are
a separate category. In the Medical Expenditure Panel
Survey (MEPS) (Indicator 33), hospice care provided in
the home (regardless of the source of payment) is included
in the “Other health care” category, while hospice care
provided in an institutional setting (e.g., nursing home) is
excluded from the MEPS universe.
Hospital care: Hospital care in the Medical Expenditure
Panel Survey (Indicator 33) includes hospital inpatient
care and care provided in hospital outpatient departments
and emergency rooms. Care can be provided by physicians
or other health practitioners. Payments for hospital care
include payments billed directly by the hospital and those
billed separately by providers for services provided in the
hospital.
Hospital inpatient services: In the Medicare Current
Beneciary Survey (Indicators 30 and 34) hospital
inpatient services include room and board and all hospital
diagnostic and laboratory expenses associated with the
basic facility charge, as well as emergency room expenses
incurred immediately prior to inpatient stays. Expenses
for hospital stays with the same admission and discharge
dates are included if the Medicare bill classied the
stay as an “inpatient” stay. Payments for separate billed
physician inpatient services are excluded. In the Medical
Expenditure Panel Survey (Indicator 33) these services
include room and board and all hospital diagnostic and
laboratory expenses associated with the basic facility
charge, payments for separately billed physician inpatient
services, and emergency room expenses incurred
immediately prior to inpatient stays. Expenses for reported
hospital stays with the same admission and discharge dates
are also included.
Hospital outpatient services: ese services in the
Medicare Current Beneciary Survey (Indicators 30 and
34) include visits to both physicians and other medical
providers seen in hospital outpatient departments or
emergency rooms (provided the emergency room visit
does not result in an inpatient hospital admission), as well
as diagnostic laboratory and radiology services. Payments
for these services include those covered under the basic
facility charge. Expenses for in-patient hospital stays with
the same admission and discharge dates and classied
on the Medicare bill as “outpatient” are also included.
Separately billed physician services are excluded.
Hospital stays: Hospital stays in the Medicare claims data
(Indicator 29) refers to admission to and discharge from a
short-stay acute care hospital.
Housing cost burden: In the American Housing Survey,
housing cost burden is dened as expenditures on housing
and utilities in excess of 30 percent of household reported
income.
Housing expenditures: In the Consumer Expenditure
Survey’s Interview Survey, housing expenditures
include payments for mortgage interest; property taxes;
maintenance, repairs, insurance, and other expenses;

175
Glossary
rent; rent as pay (reduced or free rent for a unit as a form
of pay); maintenance, insurance, and other expenses for
renters; and utilities.
Income: In the Current Population Survey, income
includes money income (prior to payments for personal
income taxes, Social Security, union dues, Medicare
deductions, etc.) from: (1) money wages or salary;
(2)net income from nonfarm self-employment; (3) net
income from farm self-employment; (4) Social Security
or Railroad Retirement; (5) Supplemental Security
Income; (6) public assistance or welfare payments;
(7)interest (on savings or bonds); (8) dividends, income
from estates or trusts, or net rental income; (9) veterans’
payment or unemployment and worker’s compensation;
(10)private pensions or government employee pensions;
(11)distributions from retirement accounts; and
(12)alimony or child support, regular contributions from
people not living in the household, and other periodic
income. Certain money receipts such as capital gains are
not included.
In the Medicare Current Beneficiary Study, income is for
the sample person or the sample person and spouse if the
sample person was married at the time of the survey. All
sources of income from jobs, pensions, Social Security
benefits, Railroad Retirement and other retirement
income, Supplemental Security Income, interest,
dividends, and other income sources are included.
Income, household: Household income from the
Medical Expenditure Panel Survey (MEPS) and the
MEPS predecessor surveys used in this report was created
by summing personal income from each household
member to create family income. Family income was
then divided by the number of people that lived in the
household during the year to create per capita household
income. Potential income sources asked about in the
survey interviews include annual earnings from wages,
salaries, or withdrawals; Social Security and VA payments;
Supplemental Security Income and cash welfare payments
from public assistance; Temporary Assistance for Needy
Families, formerly known as Aid to Families with
Dependent Children; gains or losses from estates, trusts,
partnerships, C corporations, rent, and royalties; and a
small amount of other income. See Poverty Indicator 33:
Out-of-Pocket Health Care Expenditures.
Income fifths: A population can be divided into groups
with equal numbers of people based on the size of
their income to show how the population diers on a
characteristic at various income levels. Income fifths are
five groups of equal size, ordered from lowest to highest
income.
Inpatient hospital: See Hospital inpatient services.
Institutionalized population: See Population.
Institutions: For the 2010 Census, the Census Bureau
dened institutions as adult correctional facilities, juvenile
facilities, skilled-nursing facilities, and other institutional
facilities such as mental (psychiatric) hospitals and in-
patient hospice facilities. See Population.
Instrumental activities of daily living (IADLs): IADLs
are indicators of functional well-being that measure the
ability to perform more complex tasks than the related
activities of daily living (ADLs). See Activities of daily living
(ADLs).
In the Medicare Current Beneficiary Survey. IADLs are
measured as difficulty performing (or inability to perform
because of a health reason) one or more of the following
activities: heavy housework, light housework, preparing
meals, using a telephone, managing money, or shopping.
Only the questions on telephone use, shopping, and
managing money are asked of long-term care facility
residents.
Long-term care facility: In the Medicare Current
Beneciary Survey (MCBS) (Indicators 22 and 36), a
residence (or unit) is considered a long-term care facility
if it is certied by Medicare or Medicaid; has three or
more beds, is licensed as a nursing home or other long-
term care facility, and provides at least one personal care
service; or provides 24-hour, 7-day-a-week supervision
by a non-family, paid caregiver. In the MCBS (Indicators
30 and 34), a long-term care facility excludes “short-term
institutions” (e.g., sub-acute care) stays. See Short-term
institution (Indicators 30 and 34), and Skilled nursing home
(Indicator 29).
Mammography: Mammography is an X-ray image of the
breast used to detect irregularities in breast tissue.
Mean: e mean is an average of n numbers computed by
adding the numbers and dividing by n.
Median: e median is a measure of central tendency, the
point on the scale that divides a group into two parts.
Medicaid: is nationwide health insurance program
is operated and administered by the states with Federal
financial participation. Within certain broad, federally
determined guidelines, states decide who is eligible; the
amount, duration, and scope of services covered; rates
of payment for providers; and methods of administering
the program. Medicaid pays for health care services,
community-based supports, and nursing home care for
certain low-income people. Medicaid does not cover

176
Glossary
all low-income people in every state. e program was
authorized in 1965 by Title XIX of the Social Security Act.
Medicare: is nationwide program provides health
insurance to people age 65 and over, people entitled to
Social Security disability payments for 2 years or more,
and people with end-stage renal disease, regardless of
income. e program was enacted July 30, 1965, as
Title XVIII, Health Insurance for the Aged of the Social
Security Act, and became eective on July 1, 1966.
Medicare covers acute care services and post-acute
care settings such as rehabilitation and long-term care
hospitals, and generally does not cover nursing home care.
Prescription drug coverage began in 2006.
Medicare Advantage: See Medicare Part C.
Medicare Part A: Medicare Part A (Hospital Insurance)
covers inpatient care in hospitals, critical access hospitals,
skilled nursing facilities, and other post-acute care settings
such as rehabilitation and long-term care hospitals. It also
covers hospice and some home health care.
Medicare Part B: Medicare Part B (Medical Insurance)
covers doctor’s services, outpatient hospital care, and
durable medical equipment. It also covers some other
medical services that Medicare Part A does not cover, such
as physical and occupational therapy and some home
health care. Medicare Part B also pays for some supplies
when they are medically necessary.
Medicare Part C: With the passage of the Balanced
Budget Act of 1997, Medicare beneciaries were given
the option to receive their Medicare benets through
private health insurance plans instead of through the
original Medicare plan (Parts A and B). ese plans were
known as “Medicare+Choice” or “Part C” plans. Pursuant
to the Medicare Prescription Drug, Improvement, and
Modernization Act of 2003, the types of plans allowed to
contract with Medicare were expanded, and the Medicare
Choice program became known as “Medicare Advantage.”
In addition to oering comparable coverage to Part A and
Part B, Medicare Advantage plans may also oer Part D
coverage.
Medicare Part D: Medicare Part D subsidizes the costs
of prescription drugs for Medicare beneciaries. It was
enacted as part of the Medicare Prescription Drug,
Improvement, and Modernization Act of 2003 (MMA)
and went into eect on January 1, 2006. Beneciaries can
obtain the Medicare drug benet through two types of
private plans: beneciaries can join a Prescription Drug
Plan (PDP) for drug coverage only or they can join a
Medicare Advantage plan (MA) that covers both medical
services and prescription drugs (MA-PD). Alternatively,
beneciaries may receive drug coverage through a former
employer, in which case the former employer may qualify
for a retiree drug subsidy payment from Medicare.
Medigap: See Supplemental health insurance.
National population adjustment matrix: e national
population adjustment matrix adjusts the population to
account for net underenumeration. Details on this matrix
can be found on the U.S. Census Bureau website: https://
www.census.gov/population/www/censusdata/adjustment.
html.
Noninstitutional group quarters: For the 2010 Census,
the Census Bureau dened noninstitutional group
quarters as facilities that house those who are primarily
eligible, able, or likely to participate in the labor force
while resident. e noninstitutionalized population
lives in noninstitutional group quarters such as college/
university student housing, military quarters, and other
noninstitutional group quarters such as emergency
and transitional shelters for people experiencing
homelessness and group homes. For more information on
noninstitutional group quarters, please see Appendix B at
http://www.census.gov/prod/cen2010/doc/sf1.pdf.
Obesity: See Body mass index.
Office-based medical provider services: In the Medical
Expenditure Panel Survey (Indicator 33), this category
includes expenses for visits to physicians and other health
practitioners seen in oce-based settings or clinics. “Other
health practitioner” includes audiologists, optometrists,
chiropractors, podiatrists, mental health professionals,
therapists, nurses, and physician’s assistants, as well as
providers of diagnostic laboratory and radiology services.
Services provided in a hospital based setting, including
outpatient department services, are excluded.
Other health care: In the Medicare Current Beneciary
Survey (Indicator 34), this category includes short-term
institution, hospice, and dental services. In the Medical
Expenditure Panel Survey (MEPS) (Indicator 33) other
health care includes home health services (formal care
provided by home health agencies and independent
home health providers) and other medical equipment
and services. e latter includes expenses for eyeglasses,
contact lenses, ambulance services, orthopedic items,
hearing devices, prostheses, bathroom aids, medical
equipment, disposable supplies, alterations/modications,
and other miscellaneous items or services that were
obtained, purchased, or rented during the year.

177
Glossary
Other income: Other income is total income minus
retirement benefits, earnings, asset income, and
public assistance. It includes, but is not limited to,
unemployment compensation, worker’s compensation,
alimony, and child support.
Out-of-pocket health care spending: ese are health
care expenditures that are not covered by insurance.
Outpatient hospital: See Hospital outpatient services.
Overweight: See Body mass index.
Pensions: Pensions include money income reported in
the Current Population Survey from Railroad Retirement,
company or union pensions (including profit sharing and
401(k) payments), distributions from IRAs, distributions
from Keoghs, regular payments from annuities and paid-
up life insurance policies, Federal government pensions,
U.S. military pensions, and state or local government
pensions.
Physician/Medical services: In the Medicare Current
Beneciary Survey (Indicator 34), this category includes
visits to a medical doctor, osteopathic doctor, and health
practitioner as well as diagnostic laboratory and radiology
services. Health practitioners include audiologists,
optometrists, chiropractors, podiatrists, mental health
professionals, therapists, nurses, paramedics, and
physician’s assistants. Services provided in a hospital-based
setting, including outpatient department services, are
included.
Physician/Outpatient hospital: In the Medicare Current
Beneciary Survey (Indicator 30), this term refers to
“physician/medical services” combined with “hospital
outpatient services.”
Physician visits and consultations: In Medicare claims
data (Indicator 29), physician visits and consultations
include visits and consultations with primary care
physicians, specialists, and chiropractors in their oces,
hospitals (inpatient and outpatient), emergency rooms,
patient homes, and nursing homes.
Population: Data on populations in the United States
are often collected and published according to several
dierent definitions. Various statistical systems then use
the appropriate population for calculating rates.
Resident population: e resident population of the
United States includes people resident in the 50 states
and the District of Columbia. It excludes residents of
the Commonwealth of Puerto Rico and residents of
the outlying areas under United State sovereignty or
jurisdiction (principally American Samoa, Guam, Virgin
Islands of the United States, and the Commonwealth
of the Northern Mariana Islands). An area’s resident
population consists of those persons “usually resident”
in that particular area (where they live and sleep most
of the time). e resident population includes people
living in housing units, nursing homes, and other types
of institutional settings. People whose usual residence is
outside of the United States, such as the U.S. military and
civilian personnel as well as private U.S. citizens living
overseas, are excluded from the resident population.
Resident noninstitutionalized population: e resident
noninstitutionalized population is the resident population
residing in noninstitutional group quarters. See also the
denitions of Resident population and Noninstitutional group
quarters.
Civilian population: e civilian population is the U.S.
resident population not in the active-duty Armed Forces.
Civilian noninstitutionalized population: is
population includes all U.S. civilians residing in
noninstitutional group quarters. See also the denition of
Noninstitutional group quarters.
Institutionalized population: For the 2010 Census, the
Census Bureau dened institutional group quarters as
facilities that house those who are primarily ineligible,
unable, or unlikely to participate in the labor force while
resident.
e institutionalized population is the population
residing in institutional group quarters such as adult
correctional facilities, juvenile facilities, skilled-nursing
facilities, and other institutional facilities such as mental
(psychiatric) hospitals and in-patient hospice facilities.
People living in noninstitutional group quarters are the
noninstitutionalized population. For more information on
institutional and noninstitutional group quarters, please
see Appendix B at http://www.census.gov/prod/cen2010/
doc/sf1.pdf.
Poverty: e ocial measure of poverty is computed
each year by the U.S. Census Bureau and is dened
as having income less than 100 percent of the poverty
threshold (i.e., $11,354 for one person age 65 and over
in 2014).
73
Poverty thresholds are the dollar amounts
used to determine poverty status. Each family (including
single-person households) is assigned a poverty threshold
based upon the family’s size and the ages of the family
members. All family members have the same poverty
status. Several of the indicators included in this report
include a poverty status measure. Poverty status (less than
100 percent of the poverty threshold) was computed for

178
Glossary
“Indicator 7: Poverty,” “Indicator 8: Income,” “Indicator
28: Cigarette Smoking,” “Indicator 32: Sources of Health
Insurance,” and “Indicator 33: Out-of-Pocket Health
Care Expenditures” using the ocial U.S. Census Bureau
denition for the corresponding year. In addition, the
following income-to-poverty categories are used in this
report:
Indicator 8: Income: e income categories are derived
from the ratio of the family’s money income (or an
unrelated individual’s money income) to the poverty
threshold. Being in poverty is having income less than
100percent of the threshold. Low income is income
between 100 percent and 199 percent of the poverty
threshold (i.e., between $11,354 and $22,707 for one
person age 65 and over in 2014). Middle income is
income between 200 percent and 399 percent of the
poverty threshold (i.e. between $22,708 and $45,415
for one person age 65 and over in 2014). High income
isincome 400 percent or more of the poverty threshold.
Indicator 28: Cigarette Smoking: Below poverty is
dened as having income less than 100 percent of the
poverty threshold. Above poverty is grouped into two
categories: (1) income between 100 percent and 199
percent of the poverty threshold and (2) income equal
toor greater than 200 percent of the poverty threshold.
Indicator 32: Sources of Health Insurance: Below
poverty is dened as having income less than 100 percent
of the poverty threshold. Above poverty is grouped into
two categories: (1) income between 100 percent and
199percent of the poverty threshold and (2) income equal
to or greater than 200 percent of the poverty threshold.
Indicator 33: Out-of-Pocket Health Care Expenditures:
Two income categories were used to examine out-of-
pocket health care expenditures using the Medical
Expenditure Panel Survey (MEPS) and MEPS predecessor
survey data. e categories were expressed in terms of
poverty status (i.e., the ratio of the family’s income to
the Federal poverty thresholds for the corresponding
year), which controls for the size of the family and the
age of the head of the family. e income categories were
(1)poor and near poor and (2) other income. e poor
and near poor income category includes people in families
with income less than 100 percent of the poverty line,
including those whose losses exceeded their earnings,
resulting in negative income (i.e., the poor), as well as
people in families with income from 100 percent to less
than 125 percent of the poverty line (i.e., the near poor).
e other income category includes people in families
with income greater than or equal to 125 percent of the
poverty line. See Income, household.
Prescription drugs/medicines: In the Medicare
Current Beneciary Survey (Indicators 30, 31, 34) and
in the Medical Expenditure Panel Survey (Indicator
33), prescription drugs are all prescription medications
(including rells), except those provided by the doctor or
practitioner as samples and those provided in an inpatient
setting.
Prevalence: Prevalence is the number of cases of a disease,
infected people, or people with some other attribute
present during a particular interval of time. It is often
expressed as a rate (e.g., the prevalence of diabetes per
1,000 people during a year).
Private supplemental health insurance: See Supplemental
health insurance.
Public assistance: Public assistance is money income
reported in the Current Population Survey from
Supplemental Security Income (payments made to
low-income people who are age 65 and over, blind, or
disabled) and public assistance or welfare payments, such
as Temporary Assistance for Needy Families and General
Assistance.
Quintiles: See Income fifths.
Race: See specific data source descriptions.
Rate: A rate is a measure of some event, disease, or
condition in relation to a unit of population, along with
some specification of time.
Reference population: e reference population is the
base population from which a sample is drawn at the time
of initial sampling. See Population.
Respondent-assessed health status: In the National
Health Interview Survey, respondent-assessed health status
is measured by asking the respondent, “Would you say
[your/subject name’s] health is excellent, very good, good,
fair, or poor?” e respondent answers for all household
members including himself or herself.
Retiree Drug Subsidy: e Retiree Drug Subsidy is
designed to encourage employers to continue providing
retirees with prescription drug benets. Under the
program, employers may receive a subsidy of up to 28
percent of the costs of providing the prescription drug
benet.
Short-term institution: is category in the Medicare
Current Beneciary Survey (Indicators 30 and 34)

179
Glossary
includes skilled nursing facility stays and other short-term
(e.g., sub-acute care) facility stays (e.g., a rehabilitation
facility stay). Payments for these services include Medicare
and other payment sources. See Skilled nursing facility
(Indicator 29), Nursing facility (Indicator 36), and Long-
term care facility (Indicators 22, 30, 34, and 37).
Skilled nursing facility: A skilled nursing facility (SNF)
as dened by Medicare (Indicator 29) provides short-
term skilled nursing care on an inpatient basis, following
hospitalization. ese facilities provide the most intensive
care available outside of inpatient acute hospital care. In
the Medicare Current Beneciary Survey (Indicators 30
and 34) “skilled nursing facilities” are classied as a type
of “short-term institution.” See Short-term institution
(Indicators 30 and 34), and Long-term care facility
(Indicators 22, 30, 34, and 36).
Skilled nursing facility stays: Skilled nursing facility
stays in the Medicare claims data (Indicator 29) refers to
admission to and discharge from a skilled nursing facility,
regardless of the length of stay. See Skilled nursing facility
(Indicator 29).
Social Security benefits: Social Security benefits include
money income reported in the Current Population Survey
from Social Security old-age, disability, and survivors’
benefits.
Standard population: is is a population in which the
age and sex composition is known precisely, as a result of
a census. A standard population is used as a comparison
group in the procedure for standardizing mortality rates.
Supplemental health insurance: Supplemental
health insurance is designed to fill gaps in the original
Medicare plan coverage by paying some of the amounts
that Medicare does not pay for covered services and
may pay for certain services not covered by Medicare.
Private Medigap is supplemental insurance individuals
purchase themselves or through organizations such as
AARP or other professional organizations. Employer- or
union-sponsored supplemental insurance policies are
provided through a Medicare enrollee’s former employer
or union. For dual-eligible beneciaries, Medicaid acts
as a supplemental insurer to Medicare. Some Medicare
beneficiaries enroll in HMOs and other managed care
plans that provide many of the benefits of supplemental
insurance, such as low copayments and coverage of
services that Medicare does not cover.
Supplemental Poverty Measure: Since 2011, the
Census Bureau has published poverty estimates using
the Supplemental Poverty Measure (SPM). e SPM
creates a more complex statistical picture incorporating
additional items such as tax payments, work expenses, and
medical out-of-pocket expenditures in its family resource
estimates. e resource estimates also take into account
the value of noncash benets including nutritional,
energy, and housing assistance. resholds used in the
new measure are derived from Consumer Expenditure
Survey expenditure data on basic necessities (food, shelter,
clothing, and utilities) and are adjusted for geographic
dierences in the cost of housing.
TRICARE: TRICARE is the Department of Defense’s
regionally managed health care program for active duty
and retired members of the uniformed services, their
families, and survivors.
TRICARE for Life: TRICARE for Life is TRICARE’s
Medicare wraparound coverage (similar to traditional
Medigap coverage) for Medicare-eligible uniformed
services beneficiaries and their eligible family members
and survivors.
Veteran: Veterans include those who served on active
duty in the Army, Navy, Air Force, Marines, Coast Guard,
uniformed Public Health Service, or uniformed National
Oceanic and Atmospheric Administration; Reserve Force
and National Guard called to Federal active duty; and
those disabled while on active duty training. Excluded are
those dishonorably discharged and those whose only active
duty was for training or State National Guard service.
Veterans’ health care: Health care services provided
by the Veterans Health Administration (Indicator 35)
includes preventive care, ambulatory diagnosis and
treatment, inpatient diagnosis and treatment, and
medications and supplies. is includes home- and
community-based services (e.g., home health care) and
long-term care institutional services (for those eligible to
receive these services).

.
.
.
.
.
.
.
.
.
.
.
2003
2008
2013
The Historical Experience of Three Cohorts of Older Americans: A Timeline of Selected Events 1923–2016
1929 – Stock market crashes
1941 – Pearl Harbor; United States enters WWII
1945 – Yalta Conference; Cold War begins;
1946 – Baby boom begins
1950 – United States enters Korean War
1955 – Nationwide polio vaccination program begins
1964 – United States enters Vietnam War; baby boom ends
1969 – First man on the moon
1989 – Berlin Wall falls; 1990 – United States enters
Persian Gulf War
1980 – First AIDS case is reported to the Centers for
Disease Control and Prevention
2001 – September 11: Terrorists attack United States; 2003 –
United States enters Iraq war; 2007 – Economic downturn
begins December 2007; 2008 – First Baby Boomers begin to
turn 62 years old and become eligible for Social Security
retired worker benefits; 2009 – Economic downturn ends
June 2009; 2010 – Offshore explosion on the Deepwater
Horizon drilling rig causes the largest oil spill in U.S. history
2011 – World population reaches 7 billion, 0.9 billion age 60
and over; United States formally ends the Iraq War
Historical Events
Year
1923 Cohort
Born
5 years old
15 years old
25 years old
55 years old
65 years old
75 years old
85 years old
35 years old
45 years old
Born
5 years old
15 years old
45 years old
55 years old
65 years old
75 years old
1933 Cohort
25 years old
35 years old
Born
5 years old
15 years old
25 years old
35 years old
45 years old
55 years old
65 years old
1943 Cohort
1934 – Federal Housing Administration created by Congress
1935 – Social Security Act passed
1937 – U.S. Housing Act passed, establishing Public Housing
1956 – Women age 62–64 eligible for reduced Social
Security benefits; 1957 – Social Security Disability Insurance
implemented; 1959 – Section 202 of the Housing Act
established, providing assistance to older adults with low
income
1961 – Men age 62–64 eligible for reduced Social Security
benefits; 1962 – Self-Employed Individual Retirement Act
(Keogh Act) passed
1964 – Civil Rights Act passed
1965 – Medicare and Medicaid established; Older
Americans Act passed
1967 – Age Discrimination in Employment Act passed
1972 – Formula for Social Security cost-of-living
adjustment established; Social Security Supplemental
Security Income legislation passed; 1974 – Employee
Retirement Income Security Act (ERISA) passed; IRAs
established; 1975 – Age Discrimination Act passed
1978 – 401(k)s established
1983 – Social Security eligibility age increased for full
benefits; 1984 – Widows entitled to pension benefits if
spouse was vested
1986 – Mandatory retirement eliminated for most workers
1987 – Reverse mortgage market created by the HUD
Home Equity Conversion Program
1990 – Americans with Disabilities Act passed
1996 – Veterans’ Health Care Eligibility Reform Act passed,
creating access to community based long-term care for all
enrollees; 1997 – Balanced Budget Act passed changing
Medicare payment policies
2000 – Social Security earnings test eliminated for full
retirement age
2003 – Medicare Modernization Act passed, creating the
Medicare prescription drug benefit
2005 – Deficit Reduction Act passed realigning Medicaid
incentives to provide noninstitutionalized long-term care;
2006 – Pension Protection Act passed
Legislative Events
.
.
.
.
1928
.
.
.
.
.
.
.
.
.
.
.
.
.
.
.
.
.
.
.
.
.
.
.
.
.
.
.
.
.
.
.
.
.
.
.
.
.
.
.
.
.
.
.
.
.
.
.
.
.
.
.
.
.
.
.
.
.
.
.
.
1923
1933
1938
1943
1948
1953
1958
1963
1968
1973
1978
1983
1988
1993
1998
2012 – First Baby Boomers reach Social Security full-
retirement age; 2013 – Supreme Court rules Defense of
Marriage Act (DOMA) unconstitutional; Nobel Prize for
Medicine and Physiology honored research advancing
insights on diabetes and Alzheimer's disease
2014 – Cuba and the United States agree to resume full
diplomatic relations
2010 – Patient Protection and Affordable Care Act passed;
2014 – The Multiemployer Pension Reform Act of 2014
passed, enabling certain plans to apply to reduce pension
benefits; 2015 – The Medicare Access and CHIP
Reauthorization Act passed, reforming Medicare physician
reimbursement
2016 – Reauthorization of the Older Americans Act

